A TLAS-CONF-2012-153 12 November 2012
ATLAS NOTE
ATLAS-CONF-2012-153
November 11, 2012
Search for Supersymmetry in events with four or more leptons in 13.0 fb − 1 pp collisions at √
s = 8 TeV with the ATLAS detector
The ATLAS Collaboration
Abstract
Results of a search for supersymmetry in events with four or more leptons (electrons or muons) are presented. The analysis uses a sample corresponding to 13.0 fb − 1 of proton- proton collision data delivered by the LHC at √
s = 8 TeV and recorded by the ATLAS detector. Two signal regions are defined with a selection vetoing Z boson production. The first signal region has large missing transverse momentum (E miss T > 50 GeV), where 1 event is observed while 0.25 +0.29 − 0.25 are expected from Standard Model processes. The second requires large total effective mass (m eff > 300 GeV), where 2 events are observed while 1.2 ± 0.5 are expected from Standard Model processes. Limits are placed on various R-parity violating simplified models, where the lightest supersymmetric particle ( ˜ χ 0 1 ) decays promptly to first- and second-generation leptons. Considering one other sparticle at a time, pair-produced and decaying directly to a ˜ χ 0 1 , charged Winos are excluded up to a mass of ∼ 710 GeV, left-handed sleptons up to ∼ 450 GeV, sneutrinos up to ∼ 410 GeV and gluinos up to ∼ 1300 GeV.
c Copyright 2012 CERN for the benefit of the ATLAS Collaboration.
Reproduction of this article or parts of it is allowed as specified in the CC-BY-3.0 license.
1 Introduction
Supersymmetry (SUSY) [1] is one of the most popular theoretical extensions of the Standard Model (SM). SUSY is able to stabilise the mass of the Higgs boson and unify gauge couplings through the introduction of “superpartner” fermions and bosons for each SM boson and fermion, respectively. In the most general formulation of SUSY, the proton becomes unstable due to new baryon-and lepton-number violating terms in the superpotential [2]:
W RPV = λ i jk L i L j E ¯ k + λ ′ i jk L i Q j D ¯ k + λ ′′ i jk U ¯ i D ¯ j D ¯ k + κ i L i H 2 , (1) where L i and Q i denote the lepton and quark SU(2) doublet superfields, respectively, while the corre- sponding singlet superfields are given by ¯ E i and ¯ D i . H 2 denotes the Higgs SU(2) doublet superfield that couples to up-like quarks. λ i jk , λ ′ i jk and λ ′′ i jk are new Yukawa couplings and the κ i have dimensions of mass, but vanish at the unification scale. The indices i, j and k refer to quark and lepton generations.
It is often assumed in supersymmetric models that R-parity is conserved, which has the effect of forbidding the superpotential terms in Equation (1) [3]. This symmetry makes the lightest SUSY par- ticle (LSP) stable, allowing it to be a dark matter candidate [4]. Additionally, the LSP is forbidden on cosmological grounds from carrying electric or colour charges. In a collider experiment, production of SUSY particles decaying to the LSP would produce significant amounts of missing transverse momen- tum (E miss T ), a characteristic that drives many searches for supersymmetric particle production.
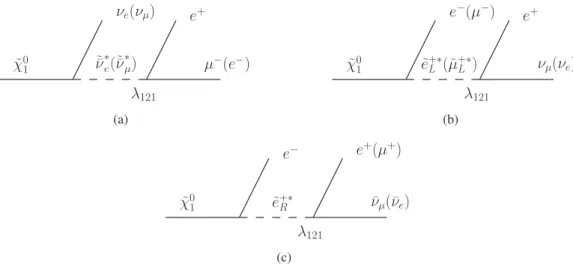
It may be, however, that the proton lifetime is protected by another, less stringent, symmetry that allows some of the terms in Equation (1). In this case, the LSP is not stable, and the distinctive signature of large missing transverse momentum may therefore be lost. If only one of the λ i jk is non-zero, final states with high lepton multiplicities may be produced instead. For example, a neutralino LSP will decay into two charged leptons and one neutrino:
˜
χ 0 1 → ν i/ j ℓ ± j/i ℓ k ∓ . (2)
The ˜ χ 0 1 decay proceeds via a virtual slepton or sneutrino, shown in Figure 1 for i jk = 121. If the lambdas are sufficiently small, sparticles are pair produced and decay via gauge interactions into LSPs. The LSPs subsequently decay via RPV interactions leading to final states with 4 leptons and non-zero MET due to the presence of neutrinos. R-parity violation releases cosmological constraints on the LSP nature [5].
˜
χ 0 1 ν ˜¯ ∗ e (˜¯ ν ∗ µ )
ν e (ν µ ) e +
µ − (e − ) λ 121
(a)
˜
χ 0 1 ˜ e + L ∗ (˜ µ + L ∗ )
e − (µ − ) e +
ν µ (ν e ) λ 121
(b)
˜
χ 0 1 e ˜ + R ∗
e − e + (µ + )
¯ ν µ (¯ ν e ) λ 121
(c)
Figure 1: Illustration of λ 121 χ ˜ 0 1 decays. In all cases, the charge conjugate decay is implied.
Previous ATLAS analyses considered a model where the ˜ τ 1 was the LSP [6, 7], however for the purposes of constructing some benchmark simplified models, a more conventional neutralino LSP is studied here.
Only one RPV coupling, either λ 121 or λ 122 , is set to be non-zero, the exact value of that coupling being that which forces the ˜ χ 0 1 LSP to decay promptly, with a width of 0.1 GeV irrespective of other model parameters. All other λ i jk , λ ′ i jk , λ ′′ i jk and κ i are set to zero.
In this document, a search for new physics with a multilepton signature is presented, in events with four or more isolated leptons. The term “lepton” refers to electrons and muons only, including those from leptonic τ decays. A total of 13.0 fb − 1 of proton-proton collision data delivered by the LHC at √
s = 8 TeV are analysed. While motivated by supersymmetry, the search itself is model-independent. The results are presented in terms of the visible cross-section for new physics processes with this signature, and also interpreted in a variety of R-parity violating simplified supersymmetric models. This note continues and extends the analysis of Ref. [6], with improved lepton and E T miss reconstruction with respect to data taken in 2011 leading to reduced background levels and smaller systematic uncertainties. In addition, the Z-boson veto has been extended to better reject electroweak radiative decays of the Z-boson.
2 Detector description
ATLAS [8] is a multipurpose particle detector with forward-backward symmetric cylindrical geometry.
It includes an inner tracker (ID) immersed in a 2 T axial magnetic field providing precision tracking of charged particles for pseudorapidities 1 | η | < 2.5. Sampling calorimeter systems with either liquid argon or scintillator tiles as the active media provide energy measurements over the range | η | < 4.9. The muon detectors are positioned outside the calorimeters and are contained in a toroidal magnetic field produced by air-cored superconducting magnets with field integrals varying from 1 T · m to 8 T · m. The ID and muon detectors provide trigger and high-precision tracking capabilities for | η | < 2.4 and | η | < 2.7, respectively.
3 Event reconstruction and preselection
Events recorded during normal running conditions are analysed if the primary vertex has five or more tracks associated to it. The primary vertex of an event is identified as the vertex with the highest Σp 2 T of associated tracks.
Electrons must satisfy “medium” identification criteria, similar to Ref. [9], and fulfil | η | < 2.47 and E T > 10 GeV, where E T and | η | are determined from the calibrated clustered energy deposits in the elec- tromagnetic calorimeter and the matched ID track, respectively. Muons are reconstructed by combining tracks in the ID and tracks in the muon spectrometer [10]. Reconstructed muons are considered as can- didates if they have transverse momentum p T > 10 GeV and | η | < 2.4.
Jets are reconstructed with the anti-k t algorithm [11] with a distance parameter of R = 0.4 using three-dimensional calorimeter energy clusters as input. The clusters are calibrated using local cluster calibration, consisting of weighting differently the energy deposits arising from electromagnetic showers and those from hadronic showers [12]. The final jet energy calibration includes the jet energy scale, which corrects the calorimeter response to the true particle-level jet energy [13, 14]. The correction factors were obtained from simulation and have been refined and validated using data. Jets considered in this analysis have E T > 20 GeV and | η | < 2.5. The p T -weighted fraction of the tracks in the jet that are associated with the primary vertex is required to be larger than 0.5.
1
ATLAS uses a right-handed coordinate system with its origin at the nominal interaction point (IP) in the centre of the
detector and the z-axis along the beam pipe. The x-axis points from the IP to the centre of the LHC ring, and the y-axis points
upward. Cylindrical coordinates (r, φ) are used in the transverse plane, φ being the azimuthal angle around the beam pipe. The
pseudorapidity is defined in terms of the polar angle θ as η = − ln tan(θ/2).
Events containing jets failing the quality criteria described in Ref. [13] are rejected to suppress both unwanted collision and single beam background. Jets are identified as containing b-hadron decays, and thus called “b-tagged”, using a multivariate technique based on quantities such as the impact parameters of the tracks associated to a reconstructed secondary vertex. The chosen working point of the b-tagging algorithm [15] correctly identifies b-quark jets in simulated top-quark decays with an efficiency of 85%, with a light-flavour jet misidentification rate of about 10% [16] for jets with E T > 20 GeV and | η | < 2.5.
The missing transverse momentum, E miss T , is the magnitude of the vector sum of the transverse mo- mentum or transverse energy of all p T > 10 GeV muons, E T > 10 GeV electrons, E T > 20 GeV jets, and calibrated calorimeter energy clusters with | η | < 4.9 not associated to these objects. Reconstructed tracks are used to suppress pileup in the soft components of E miss T [17].
In this analysis, “tagged” leptons are leptons separated from each other and from candidate jets as described below. If two candidate electrons are reconstructed with ∆R ≡ p
(∆φ) 2 + (∆η) 2 < 0.1, the lower energy one is discarded. Candidate jets within ∆R = 0.2 of an electron candidate are rejected. To suppress leptons originating from semi-leptonic decays of c- and b-quarks, all lepton candidates are required to be separated from candidate jets by ∆R > 0.4. Muons undergoing bremsstrahlung can be reconstructed with an overlapping electron candidate. To reject these, tagged electrons and muons separated from jets and reconstructed within ∆R = 0.1 of each other are both discarded. Events containing one or more tagged muons that have transverse impact parameter with respect to the primary vertex | d 0 | > 0.2 mm or longitudinal impact parameter with respect to the primary vertex | z 0 | > 1 mm are rejected to suppress cosmic muon background.
“Signal” leptons are tagged leptons for which the scalar sum of the transverse momenta of tracks within a cone of ∆R = 0.3 around the lepton candidate, and excluding the lepton candidate track itself, is less than 16% (12%) of the lepton E T for electrons (muons). Tracks selected for the electron (muon) isolation requirement defined above are those which have p T > 0.4 (1.0) GeV and are associated to the primary vertex of the event. To suppress leptons originating from secondary vertices, the distance of closest approach of the lepton track to the primary vertex normalised to its uncertainty is required to be small, with | d 0 | /σ(d 0 ) < 5 (3) for electrons (muons) and | z 0 sin θ | must be less than 0.4 mm (1 mm) for electrons (muons). Signal electrons must also pass “tight” identification criteria, similar to Ref. [9], and the sum of the energy deposits in the calorimeter (corrected for pileup effects) within a cone of ∆R = 0.3 around the electron candidate, must be less than 18% of the electron E T .
The data sample was collected with an inclusive selection of double-lepton triggers with asymmetric and symmetric p T thresholds. For events that are selected by the the symmetric di-muon trigger, at least two signal muons are required to have p T > 14 GeV, while for the asymmetric trigger the requirements are p T > 18 GeV and p T > 10 GeV, requiring at least one signal muon passing each condition. In the case of the symmetric di-electron trigger, at least two signal electrons are required to have E T > 14 GeV, while for the asymmetric electron trigger the requirements are E T > 25 GeV and E T > 10 GeV, requiring at least one signal electron passing each condition. For events that are selected using the electron-muon (muon-electron) trigger, at least one signal electron is required to have E T > 14 GeV (10 GeV) and at least one signal muon to have p T > 10 GeV (18 GeV). These requirements are chosen such that the overall trigger efficiency is high for the four lepton events selected in the analysis, typically close to 100%, and independent of the lepton transverse momenta within uncertainties. The same requirements are applied to the MC simulated events using the results of the trigger simulation.
4 Signal region selection
Selected events must contain four or more signal leptons. The invariant mass of any same-flavour
opposite-sign (SFOS) lepton pair, m SFOS , must be above 12 GeV, otherwise the lepton pair is discarded
to suppress background from low-mass resonances. Z-boson candidates are vetoed by removing events
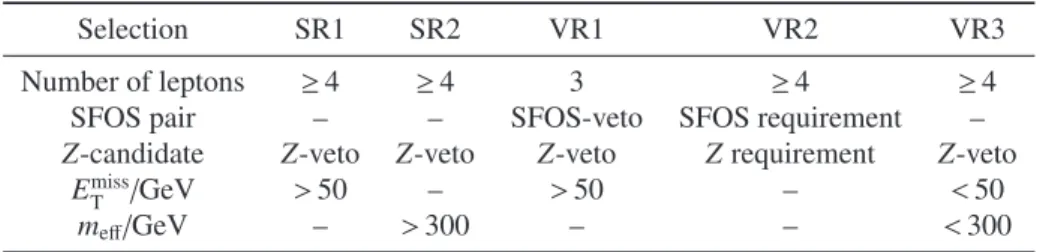
Table 1: The selection requirements for the two signal (SR) and three validation (VR) regions. The Z- candidate veto (requirement) rejects (selects) events that have a SFOS lepton pair, a SFOS+ℓ triplet, or a combination of two SFOS pairs with mass inside the [81.2, 101.2] GeV interval.
Selection SR1 SR2 VR1 VR2 VR3
Number of leptons ≥ 4 ≥ 4 3 ≥ 4 ≥ 4
SFOS pair – – SFOS-veto SFOS requirement –
Z-candidate Z-veto Z-veto Z-veto Z requirement Z-veto E
missT/GeV > 50 – > 50 – < 50
m
eff/GeV – > 300 – – < 300
with pairs, triplets or quadruplets of leptons with an invariant mass inside the [81.2, 101.2] GeV interval.
Lepton pairs and triplets considered for this Z-veto must contain a SFOS pair, while lepton quadruplets must consist of two SFOS pairs.
Two signal regions are then defined: a signal region with E T miss > 50 GeV (SR1) and one with effective mass m eff > 300 GeV (SR2). The effective mass is defined by the scalar sum
m eff = E T miss + X
µ
p µ T + X
e
E e T + X
j
E T j , (3)
where p µ T (E e T ) is the transverse momentum (transverse energy) of the signal muons (electrons) and E T j is the transverse energy of jets with E T > 40 GeV. SR1 is sensitive to scenarios where RPV LSP decays produce neutrinos in the final state, while SR2 targets models with large particle multiplicities, for example from sparticle cascade decays, and where E T miss may be small.
Three further regions are defined to validate the expected background against data. The validation regions are described in Section 7. Table 1 summarises the signal and validation region definitions.
5 Standard Model background estimation
Several SM processes, which are classified into irreducible and reducible components below, contribute to the background in the signal regions. The dominant sources are ZZ, tribosons, WZ, and t t ¯ production in both SR1 and SR2.
5.1 Monte Carlo simulation for SM processes
Several Monte Carlo (MC) generators are used to simulate SM processes relevant for this analysis.
SHERPA [18] is used to simulate the diboson processes WW , WZ and ZZ, where Z also includes vir-
tual photons. These diboson samples correspond to all SM diagrams leading to the ℓνℓ ′ ν ′ , ℓℓℓ ′ ν ′ , and
ℓℓℓ ′ ℓ ′ final states, where ℓ, ℓ ′ = e, µ, τ and ν, ν ′ = ν e , ν µ , ν τ . Interference between the diagrams is taken
into account. MadGraph [19] is used for the t tW, ¯ t tWW, ¯ t tZ, ¯ Wγ and Zγ processes. The “triboson” pro-
cesses, WWW and ZWW are also simulated using MadGraph. POWHEG [20] is chosen for the simulation
of the pair production of top quarks, MC@NLO and AcerMC [21] are used for the simulation of single top
production, and ALPGEN [22] is used to simulate W+jets and Z+jets processes. Expected diboson yields
are normalised using next-to-leading-order (NLO) QCD predictions obtained with MCFM [23, 24]. Tribo-
son contributions are normalised to NLO predictions [25]. The top-quark pair-production contribution is
normalised to approximate next-to-next-to-leading-order calculations (NNLO) [26] and the t tW ¯ , t tWW ¯ ,
t tZ ¯ contributions are normalised to NLO predictions [27, 28]. NNLO FEWZ [29, 30] cross-sections are used for normalisation of the inclusive W+jets and Z+jets processes.
The choice of the parton distribution functions (PDFs) depends on the generator. The CTEQ6L1 [31]
PDFs are used with MadGraph and ALPGEN, and the CT10 [32] PDFs with MC@NLO and SHERPA.
Fragmentation and hadronisation for the ALPGEN and MC@NLO samples are performed with HERWIG, while PYTHIA [33] is used for MadGraph and POWHEG, and for SHERPA these are performed internally.
JIMMY [34] is interfaced to HERWIG for simulation of the underlying event. For all MC samples, the propagation of particles through the ATLAS detector is modelled using GEANT4 [35] using the full AT- LAS detector simulation [36] (except the t t ¯ POWHEG sample which uses fast detector simulation AtlFast- II [37]). The effect of multiple proton-proton collisions from the same or different bunch crossings is incorporated into the simulation by overlaying additional minimum-bias events generated with PYTHIA onto hard-scatter events. Simulated events are weighted to match the distribution of the number of in- teractions per bunch crossing observed in data, but are otherwise reconstructed in the same manner as data.
5.2 Irreducible background processes
A background process is considered “irreducible” if it leads to events with four leptons from Z/W boson, t-quark or τ decays, referred to as “real” leptons below. These include ZZ, t tZ, ¯ t tWW, and ¯ ZWW produc- tion, where a gauge boson may be produced off-mass-shell. These contributions are determined using the corresponding MC samples, for which lepton and jet selection efficiencies [13, 38–40] are corrected to account for differences with respect to data. The validation of the simulation of the most important background processes in Section 7 is performed, using dedicated event selection criteria designed to enhance these processes.
5.3 Reducible background processes
A “reducible” process has at least one “fake” lepton, that is either a lepton from a semi-leptonic decay of a b- or c-quark, referred to as heavy-flavour, a lepton from misidentified light-flavour quark or gluon jet, referred to as light-flavour, or an electron from an isolated single-track photon conversion. The reducible background includes WZ, t t, ¯ t tW ¯ , WW , single t-quark, or single Z-boson production, in many cases produced in association with jets or photons. MC simulation studies show that the WZ and the t tW ¯ backgrounds correspond respectively to 95% and 5% of the reducible background in SR1 and SR2 and that the yield of W bosons with three fake leptons is negligible. In both SR1 and SR2, fake leptons are predominantly fake electrons (90%), originating from photon conversions, with a small contribution of fake electrons from light-flavour. Fake muons from heavy flavour (b and c quark) decays and light- flavour are suppressed by the object separation scheme described in Section 3, while fake muons from photon conversions are rare. As the overall contribution from heavy-flavour jets is small, the combination of light- and heavy-flavour fakes are grouped together as “jet fakes” in what follows.
The reducible background is estimated using a weighting method applied to events containing signal leptons (ℓ S ) and loose leptons (ℓ L ), which are tagged leptons failing the signal lepton requirements. Since the reducible background is dominated by events with at most two fake leptons, it is estimated as:
[N data (3ℓ S + ℓ L ) − N MCirr (3ℓ S + ℓ L )] × F(ℓ L )
−
N data (2ℓ S + ℓ L
1+ ℓ L
2) − N MCirr (2ℓ S + ℓ L
1+ ℓ L
2)
× F(ℓ L
1) × F(ℓ L
2), (4)
where the second term corrects for the double counting of reducible-background events with two fake
leptons in the first term. The term N data (3ℓ S + ℓ L ) is the total number of events with three signal leptons
and one loose lepton, while N MCirr (3ℓ S + ℓ L ) is the irreducible contribution of events obtained from
simulation. The definitions of N data (2ℓ S + ℓ L
1+ ℓ L
2) and N MCirr (2ℓ S + ℓ L
1+ ℓ L
2) are analogous, except that the two loose leptons are explicitly numbered (ℓ L
1and ℓ L
2). The potential signal contamination in the 3ℓ S + ℓ L and 2ℓ S + ℓ L
1+ ℓ L
2loose lepton data samples is not taken into account, which leads to a conservative discovery potential and has negligible effect on the exclusion limits as the reducible background contribution in the signal regions is smaller than the uncertainties as shown in Section 8.
The average fake ratio of signal to loose leptons, F, depends on the flavour and kinematics of the loose lepton ℓ L and it is defined as:
F = X
i, j
α i × R i j × f i j
, (5)
where i is the type of fake (jet fakes or electrons from photon conversion) and j is the process category the fake originates from (top quark or W/Z boson). The fake ratios f i j are defined as the ratios of the probabilities that fake tagged leptons are identified as signal leptons to the probabilities that they are identified as loose leptons. The f i j are determined for each relevant fake type and for each reducible- background process, and they are parameterised in muon (electron) p T (E T ) and η. The fake ratios are weighted according to the fractional contribution of the process they originate from through R i j fractions.
Both f i j and R i j are determined from simulation. Each correction factor α i is the fake ratio measured in data divided by that in simulation, in control samples described below. They are all found to have no significant dependence on the lepton p T . The fake ratios F are estimated to vary from 0.2 to 0.6 for muons from jets in boson processes, when the muon p T increases from 10 to 100 GeV. For muons from jets in top-quark processes, the same fake ratio decreases from 0.10 to 0.06 over the same p T range.
For electrons, the fake ratios F increase from 0.02 to 0.10 (0.05 to 0.3) for electrons from jets in top- quark/boson processes (from photon conversions) when the electron p T increases from 10 to 100 GeV.
The electron fake ratio can be lower than the muon fake ratio due to the additional identification criteria applied to electrons.
The correction factor for heavy-flavour jet fakes is measured in a b b-dominated control sample de- ¯ fined by selecting events with only one b-tagged jet (containing a muon) and a tagged lepton. The non-b b ¯ contributions from the single and pair production of top quarks and W bosons produced in association with b-quarks are suppressed with E T miss < 60 GeV and transverse mass m T < 50 GeV requirements, where m T = q
2 · E T miss · p ℓ T · (1 − cos ∆φ ℓ,E
missT
) and ∆φ ℓ,E
missT
is the azimuthal angle between the tagged lepton ℓ and E miss T . The remaining non-b b ¯ background ( ∼ 1% level) is subtracted from the control sample in data using MC predictions. In this control sample, the fake ratio for leptons from heavy-flavour jets is calculated using the ratio of tagged leptons passing signal lepton requirements to those that fail. The correction factors are found to be 0.70 ± 0.04 and 0.81 ± 0.04 for electrons and muons respectively.
The contribution of fake leptons from light-flavour jets is expected to be negligible in this analysis.
Nevertheless, the light-flavour correction factor is measured in a Z + light-flavour jets dominated control sample to cross-check the MC simulation. Events with two SFOS leptons and one tagged lepton of different flavour (i.e. e + e − + µ or µ + µ − + e) are selected and the invariant mass of the SFOS pair is required to lie within 10 GeV of the nominal Z-boson mass value. The three leptons in the event must be separated from all other leptons and jets in the event by ∆R > 0.4 and events with b-tagged jets are rejected. To suppress leptons originating from photon conversions, the trilepton mass is required to lie outside 10 GeV of the nominal Z-boson mass value. Finally, E miss T < 20 GeV is required to suppress non- Z backgrounds. In this control sample, the fake ratio for leptons from light-flavour jets is calculated using the ratio of tagged leptons identified as signal leptons to those identified as loose leptons. The correction factor is found to be 1.50 ± 0.29 for electrons and 1.07 ± 0.27 for muons.
The correction factor for electron candidates originating from photon conversions is determined in
a sample of photons radiated from a muon in Z → µµ decays. Events with two opposite-sign muons
and one tagged electron are selected and the invariant mass of the µµe triplet is required to lie within
10 GeV of the nominal Z-boson mass value. In this control sample, the fake ratio for electrons from
photon conversions is calculated using the ratio of tagged electrons identified as signal electrons to those identified as loose electrons. The correction factor is found to be 1.06 ± 0.30.
6 Systematic uncertainties
Several sources of systematic uncertainty are considered in the signal, control and validation regions.
Correlations of systematic uncertainties between processes and regions are accounted for.
Uncertainties on the MC simulation affect the irreducible background estimate, the R i j fractions of the average fake ratios, and the signal yields. Theoretical uncertainties on the cross-sections include PDF uncertainties, estimated using appropriate PDF error sets, and uncertainties on the renormalisation and factorisation scales, estimated by varying each by a factor of one half and two. Uncertainties on the acceptance from PDFs are also taken into account, and are small relative to the leading system- atic uncertainties. Additional systematic uncertainties are those resulting from the jet energy scale [13]
and resolution [38], the lepton efficiencies [39, 40], energy scales and resolutions, and uncertainties in b-tagging rates [16, 41]. The impact of the choice of MC generator is estimated for the irreducible back- ground. The systematic uncertainty on the luminosity is 3.6%, measured using a technique similar to that of [42,43] and affects only the yields of the irreducible background and the signal. A 5% uncertainty is applied to MC samples to cover differences in efficiency seen between the trigger in data and the MC trigger simulation.
In SR1 (SR2), the total uncertainty on the irreducible background is about 100% (45%). This is dominated by the uncertainties on the MC modeling of the ZZ background, estimated by computing the difference in acceptance obtained with SHERPA (nominal) and POWHEG generators. Additional significant uncertainties on the ZZ contribution arise from the jet energy scale and the statistics of the MC. For the other irreducible backgrounds, the theoretical uncertainties on the cross-section are the most important.
A 50% cross-section uncertainty is assumed for t tZ ¯ [27] and t tWW ¯ , and a conservative 100% uncertainty is assumed for triboson processes.
For the average fake ratio F, the R i j fractions are varied between 0% and 100%, providing a con- servative uncertainty on the R i j fractions from the sources listed above. This constitutes the dominant systematic uncertainty on the reducible background, of order 50% to 100%, depending on the lepton kinematics. In validation regions requiring only three leptons, the uncertainties on the fractions are known to a better degree but this conservative approach is used for consistency across regions. Un- certainties related to possible dependence of the fake ratios on E miss T , as determined in simulation, and uncertainties on the scale factors are also taken into account. Due to the small event counts in the control regions, statistical uncertainties are also important.
7 Background model validation
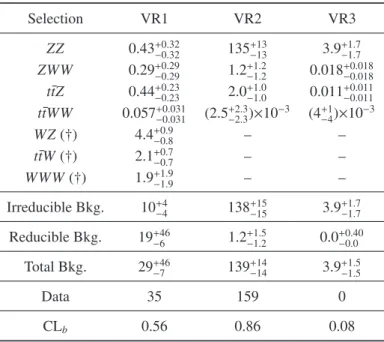
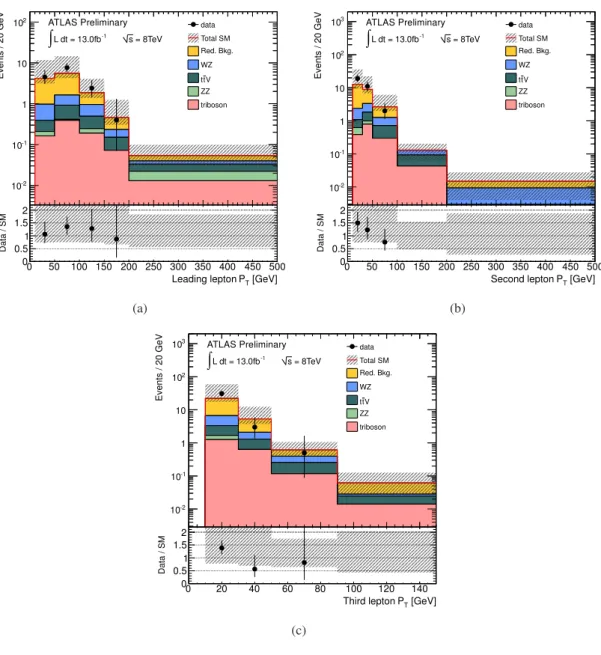
The background expectations have been verified in three validation regions. A region (VR1) selects events with three signal leptons, no SFOS pair among the three leptons and E miss T > 50 GeV. Events in VR1 are dominated by t¯ t production, and this region is used to validate the reducible background estimate. The contribution from ZZ production is validated in a region (VR2) defined by events with four leptons containing a Z-boson candidate, as described in Section 4. A region (VR3) containing events with E T miss < 50 GeV, m eff < 300 GeV, four signal leptons, and no Z-boson candidate is used to validate the simulation of off-shell Z-bosons. The data and background expectations are found to be in agreement within the quoted statistical and systematic uncertainties, as shown in Table 2. The CL b
value [44], testing compatibility with the background prediction, is also reported in each region. The
distribution of E T miss , m eff , and the p T of the leptons in VR1 and VR2 are shown in Figures 2–5, where
good agreement is seen between data and background expectation.
Table 2: Expected number of events from SM backgrounds and observed number of events in data in val- idation regions VR1, VR2 and VR3 (13.0 fb − 1 ). The uncertainties quoted include statistical and system- atic sources. The processes labelled with ( † ) are classified as irreducible background in the three-lepton validation regions.In the four-lepton validation regions they are included in the reducible background.
The CL b value is also given for each region [44].
Selection VR1 VR2 VR3
ZZ 0.43
+0.32−0.32135
+13−133.9
+1.7−1.7ZWW 0.29
+0.29−0.291.2
+1.2−1.20.018
+0.018−0.018t¯ tZ 0.44
+0.23−0.232.0
+1.0−1.00.011
+0.011−0.011t¯ tWW 0.057
+0.031−0.031(2.5
+2.3−2.3) × 10
−3(4
+1−4) × 10
−3WZ ( † ) 4.4
+0.9−0.8– – t¯ tW ( † ) 2.1
+0.7−0.7– – WWW ( † ) 1.9
+1.9−1.9– – Irreducible Bkg. 10
+4−4138
+15−153.9
+1.7−1.7Reducible Bkg. 19
+46−61.2
+1.5−1.20.0
+0.40−0.0Total Bkg. 29
+46−7139
+14−143.9
+1.5−1.5Data 35 159 0
CL
b0.56 0.86 0.08
0 50 100 150 200 250 300 350 400 450 500
Events / 20 GeV
10-2
10-1
1 10
102 data
Total SM Red. Bkg.
WZ V t t ZZ triboson ATLAS Preliminary
L dt = 13.0fb-1
∫
s = 8TeV[GeV]
PT
Leading lepton 0 50 100 150 200 250 300 350 400 450 500
Data / SM
0 0.5 1 1.5 2
(a)
0 50 100 150 200 250 300 350 400 450 500
Events / 20 GeV
10-2
10-1
1 10 102
103 data
Total SM Red. Bkg.
WZ V t t ZZ triboson ATLAS Preliminary
L dt = 13.0fb-1
∫
s = 8TeV[GeV]
PT
Second lepton 0 50 100 150 200 250 300 350 400 450 500
Data / SM
0 0.5 1 1.5 2
(b)
Events / 20 GeV
10-2
10-1
1 10 102
103 data
Total SM Red. Bkg.
WZ V t t ZZ triboson ATLAS Preliminary
L dt = 13.0fb-1
∫
s = 8TeV[GeV]
PT
Third lepton
0 20 40 60 80 100 120 140
Data / SM
0 0.5 1 1.5 2
(c)
Figure 2: Distributions of the p T of (a) the leading lepton, (b) the second leading lepton and (c) the third
leading lepton for events in VR1. The ratio of data to the SM prediction is also shown. The uncertainty
band includes both statistical and systematic uncertainty.
Events / 20 GeV
10-2
10-1
1 10
102 data
Total SM Red. Bkg.
WZ V t t ZZ triboson ATLAS Preliminary
L dt = 13.0fb-1
∫
s = 8TeV[GeV]
miss
ET
0 50 100 150 200 250 300 350 400 450 500
Data / SM
0 0.5 1 1.5 2
(a)
Events / 20 GeV
10-2
10-1
1 10
102 data
Total SM Red. Bkg.
WZ V t t ZZ triboson ATLAS Preliminary
L dt = 13.0fb-1
∫
s = 8TeV[GeV]
meff
0 200 400 600 800 1000 1200 1400
Data / SM
0 0.5 1 1.5 2
(b)
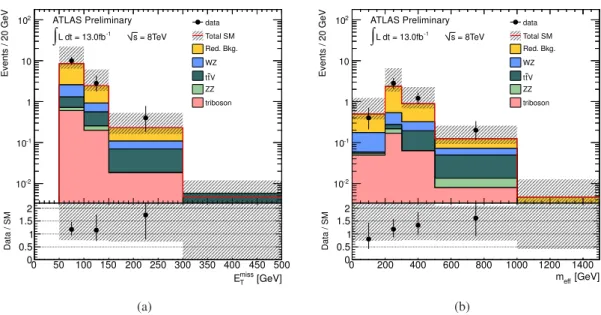
Figure 3: Distributions of (a) E T miss and (b) m eff for events in VR1. The ratio of data to the SM prediction is also shown. The uncertainty band includes both statistical and systematic uncertainty.
Events / 20 GeV
10-2
10-1
1 10 102
103 data
Total SM Red. Bkg.
ZZ ZWW
Z t t
WW t t ATLAS Preliminary
L dt = 13.0fb-1
∫
s = 8TeV[GeV]
miss
ET
0 50 100 150 200 250 300 350 400 450 500
Data / SM
0 0.5 1 1.5 2
(a)
Events / 20 GeV
10-2
10-1
1 10 102
103 data
Total SM Red. Bkg.
ZZ ZWW
Z t t
WW t t ATLAS Preliminary
L dt = 13.0fb-1
∫
s = 8TeV[GeV]
meff
0 200 400 600 800 1000 1200 1400
Data / SM
0 0.5 1 1.5 2
(b)
Figure 4: Distributions of (a) E T miss and (b) m eff for events in VR2. The ratio of data to the SM prediction
is also shown. The uncertainty band includes both statistical and systematic uncertainty.
0 50 100 150 200 250 300 350 400 450 500
Events / 20 GeV
10-2
10-1
1 10 102
103 data
Total SM Red. Bkg.
ZZ ZWW
Z t t
WW t t ATLAS Preliminary
L dt = 13.0fb-1
∫
s = 8TeV[GeV]
PT
Leading lepton 0 50 100 150 200 250 300 350 400 450 500
Data / SM
0 0.5 1 1.5 2
(a)
0 50 100 150 200 250 300 350 400 450 500
Events / 20 GeV
10-2
10-1
1 10 102
103 data
Total SM Red. Bkg.
ZZ ZWW
Z t t
WW t t ATLAS Preliminary
L dt = 13.0fb-1
∫
s = 8TeV[GeV]
PT
Second lepton 0 50 100 150 200 250 300 350 400 450 500
Data / SM
0 0.5 1 1.5 2
(b)
Events / 20 GeV
10-2
10-1
1 10 102
103 data
Total SM Red. Bkg.
ZZ ZWW
Z t t
WW t t ATLAS Preliminary
L dt = 13.0fb-1
∫
s = 8TeV[GeV]
PT
Third lepton
0 20 40 60 80 100 120 140
Data / SM
0 0.5 1 1.5 2
(c)
Events / 20 GeV
10-2
10-1
1 10 102
103 data
Total SM Red. Bkg.
ZZ ZWW
Z t t
WW t t ATLAS Preliminary
L dt = 13.0fb-1
∫
s = 8TeV[GeV]
PT
Fourth lepton
0 20 40 60 80 100 120 140
Data / SM
0 0.5 1 1.5 2
(d)
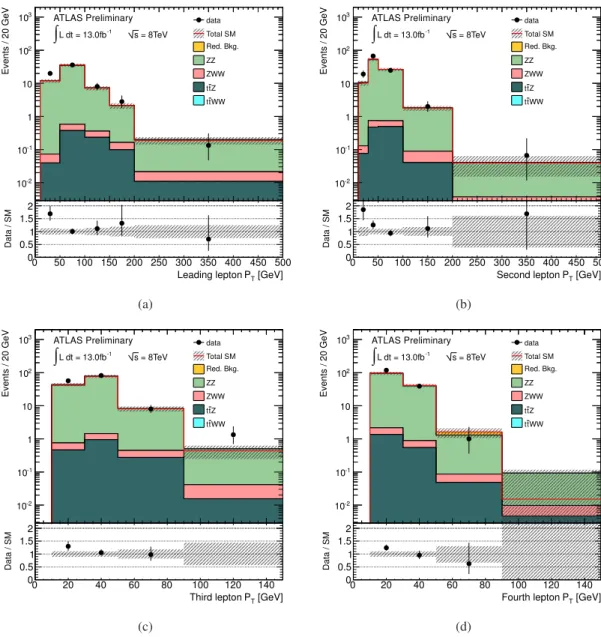
Figure 5: Distributions of the p T of (a) the leading lepton, (b) the second leading lepton, (c) the third
leading lepton and (d) the fourth leading lepton for events in VR2. The ratio of data to the SM prediction
is also shown. The uncertainty band includes both statistical and systematic uncertainty.
8 Results
The numbers of observed and expected events in SR1 and SR2 are reported in Table 3. No significant excess of events is found in the signal regions.
Upper limits on the visible cross-section of new physics processes are calculated, defined by the product of production cross-section, acceptance and efficiency, and placed at 95% CL with the modi- fied frequentist CL s prescription [44]. All systematic uncertainties and their correlations are taken into account via nuisance parameters in a profile likelihood fit [45]. Observed 95% CL limits on the vis- ible cross-section are placed at 0.34 fb in SR1 and 0.38 fb in SR2. The corresponding expected limit is 0.28 fb in both regions. The calculated probability that the signal-free background fluctuates to the observed number of events or higher is 3.7% in SR1 and 16% in SR2.
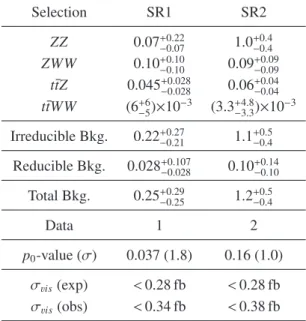
Table 3: Expected number of events from SM backgrounds, and observed number of events in data in signal regions SR1 and SR2 (13.0 fb − 1 ). The uncertainties quoted include statistical and systematic effects. The quoted p 0 -values show the probability of the background fluctuating to the observed number of events or higher, also given in standard deviations (σ). Upper limits on the observed and expected visible production cross-section of new physics processes at 95% CL, σ vis , are also shown.
Selection SR1 SR2
ZZ 0.07
+0.22−0.071.0
+0.4−0.4ZWW 0.10
+0.10−0.100.09
+0.09−0.09t¯ tZ 0.045
+0.028−0.0280.06
+0.04−0.04t¯ tWW (6
+6−5) × 10
−3(3.3
+4.8−3.3) × 10
−3Irreducible Bkg. 0.22
+0.27−0.211.1
+0.5−0.4Reducible Bkg. 0.028
+0.107−0.0280.10
+0.14−0.10Total Bkg. 0.25
+0.29−0.251.2
+0.5−0.4Data 1 2
p
0-value (σ) 0.037 (1.8) 0.16 (1.0) σ
vis(exp) < 0.28 fb < 0.28 fb σ
vis(obs) < 0.34 fb < 0.38 fb
9 Interpretation in RPV simplified models
The above results are interpreted in the context of eight RPV simplified models, all with the signature of a neutralino LSP decaying as described in Section 1. As this analysis is only sensitive to first- and second- generation leptons, the focus is restricted to λ 121 and λ 122 LSP decays. Direct LSP pair production is in principle detectable, however the production cross-section is found to be vanishingly small unless specific Wino/Higgsino mixing is assumed. Therefore, models are analysed that include one or more next-to-lightest SUSY particle (NLSP), produced in pairs, where each NLSP decays promptly to the LSP in a prescribed manner. All sparticles other than the LSP and NLSP(s) have masses set to 4.5 TeV.
Possible small changes in acceptance of the LSP decays due these sparticles are neglected.
Four NLSP choices are considered in this analysis, with the following constituents and cascade de- cays:
Winos: only ˜ χ ± 1 is considered, where ˜ χ ± 1 → W ± χ ˜ 0 1 (the gauge boson may be virtual).
L-sleptons: equal-mass ˜ e L , ˜ µ L and ˜ τ L , where ˜ ℓ L → ℓ χ ˜ 0 1 . Sneutrinos: equal-mass ˜ ν e , ˜ ν µ and ˜ ν τ , where ˜ ν ℓ → ν ℓ χ ˜ 0 1 . Gluino: g ˜ → q q ¯ ′ χ ˜ 0 1 (q, q ¯ ′ ∈ u, d, s, c).
Three of the models focus on electroweak sparticle production, as this will lead to the most conservative limits, while the gluino model serves as an example of how the experimental reach increases for strong production processes.
Relevant experimental limits from previous SUSY searches exist for all the models considered in this note. The Wino model used in this analysis is similar to one considered by D0 [46], where limits were placed on Wino-like ˜ χ ± 1 and ˜ χ 0 2 of approximately 220 GeV for non-zero λ 121 and λ 122 couplings.
For the case of a non-zero λ 121 , these limits were extended up to approximately 540 GeV by ATLAS using data taken in 2011 [6]. The principal difference between that model and the one used here is that
˜
χ 0 2 production processes are not considered in this note. The LEP experiments placed limits on slepton and sneutrino masses in leptonic RPV scenarios [47]. The results vary slightly depending on the slepton or sneutrino flavour, but all are of order 100 GeV [48]. CMS has placed limits in a squark and gluino co-NLSP model with leptonic R-parity violation. With a non-zero λ 123 coupling, they exclude gluino masses below 1 TeV, assuming m χ ˜
01
= 300 GeV [49]. This coupling will produce a significant number of tau leptons in the final state, but is otherwise similar to the model considered here.
The simplified model samples studied here are produced with Herwig++ [50]. Signal cross-sections are calculated to NLO in the strong coupling constant using PROSPINO 2 . The nominal cross-section and the uncertainty are taken from an envelope of cross-section predictions using different PDF sets and factorisation and renormalisation scales, as described in Ref. [56]. For Wino, slepton and sneu- trino production, the theoretical uncertainties are modest, varying from approximately 5% at low NLSP masses to about 10% for the highest masses considered. The uncertainties on gluino production are much greater, due to increased PDF uncertainties, ranging from 16% at m g ˜ = 500 GeV to nearly 60% at m g ˜ = 1700 GeV.
The requirements on the minimum value of the SFOS dilepton mass and on the minimum lepton- lepton separation reduce the acceptance and selection efficiency for leptons from the light ˜ χ 0 1 . In addition, as the mass of the ˜ χ 0 1 approaches zero, the phase space for leptonic decays is greatly reduced, decreasing the likelihood of a prompt LSP decay. For these reasons, only LSP masses greater than 10 GeV are considered (50 GeV for sneutrino and gluino models). For similar reasons when considering the NLSP decay, the focus is restricted to m χ ˜
01
< m NLSP − 10 GeV. The NLSP mass range considered varies, depending on current constraints and our expected sensitivity to each model.
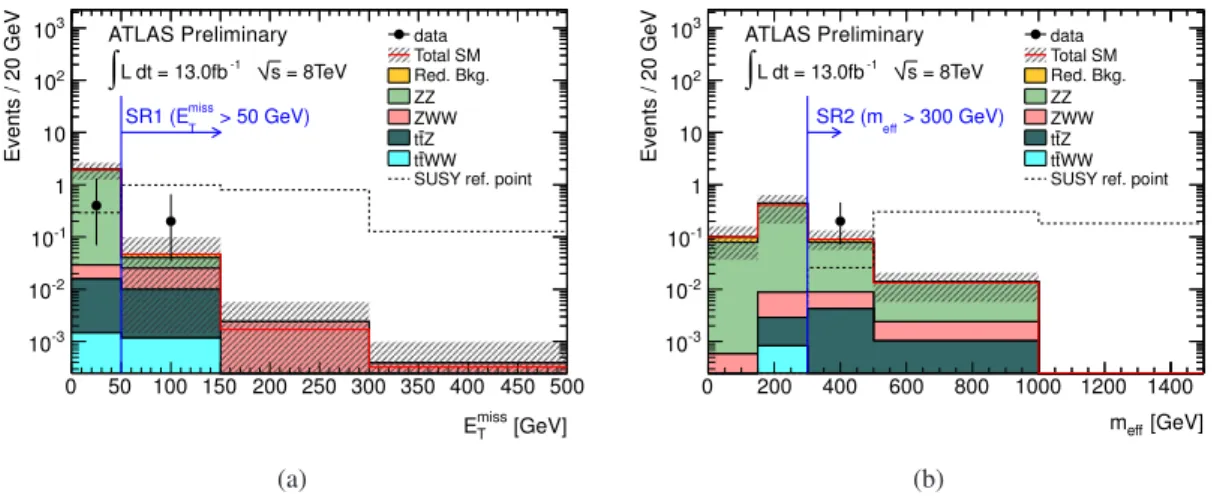
The distributions of the E miss T in SR1 and the m eff in SR2 are presented in Figure 6, where the ex- pectation from one sample mass point from the Wino model is included for illustration purposes. The separation of signal and background events that both of these variables achieve can clearly be seen.
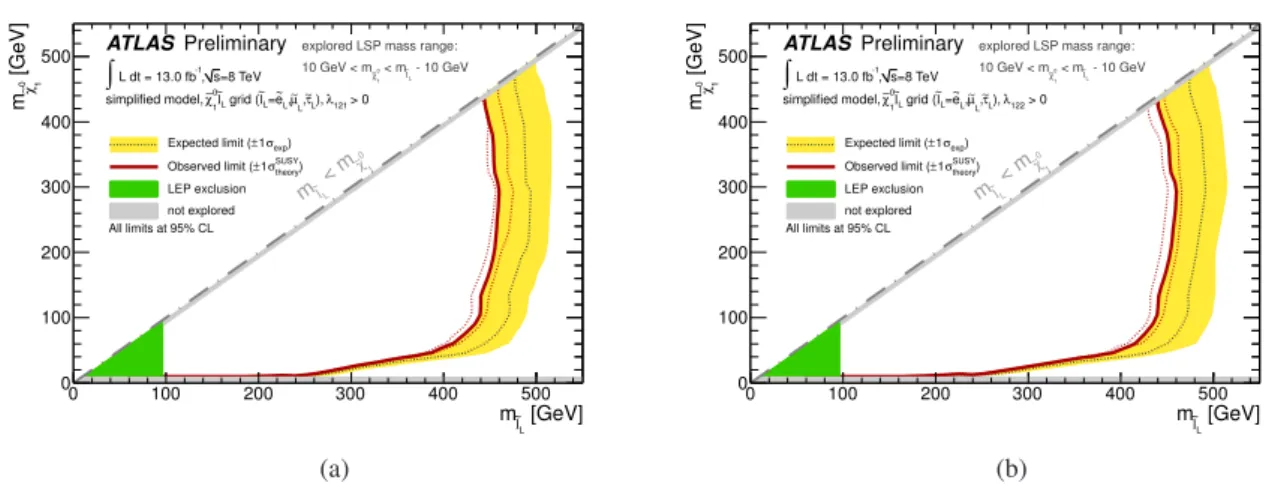
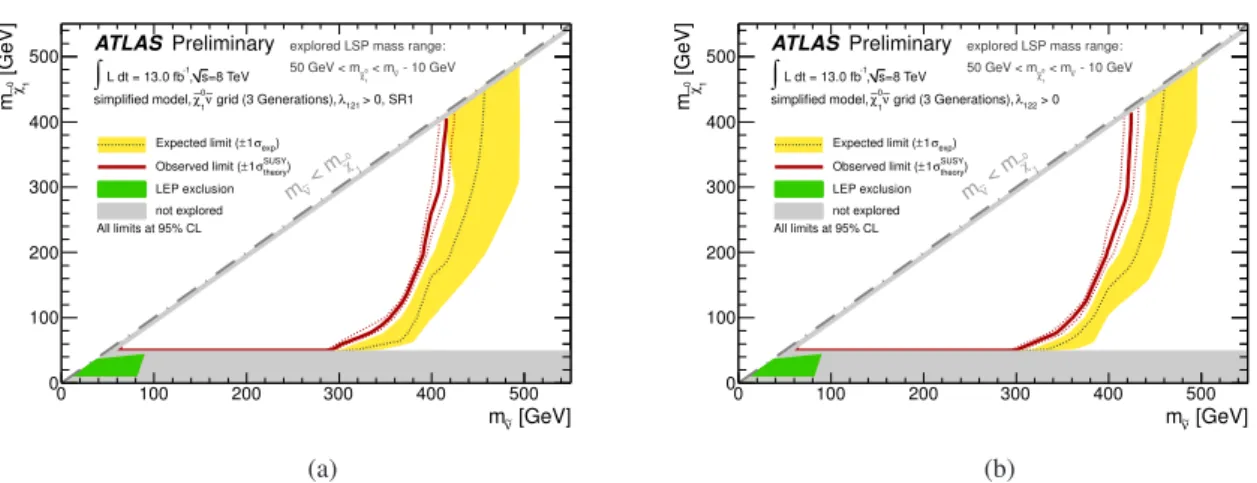
Exclusion limits on the models described above are reported in Figures 7 to 10, where the 95 % CL limits are calculated choosing the signal region with the best expected limit for each of the model points.
Across most of every plane, SR1 is more sensitive than SR2. The uncertainties on the signal cross-section are not included in the limit calculation but their impact on the observed limit is shown. Quoted exclusion limits on sparticle masses refer to the lower edge of the theoretical uncertainty band. In the Wino models
2
The addition of the resummation of soft gluon emission at NLL [51–55] is performed in the case of the gluino model.
(Figure 7), NLSP masses of up to ∼ 710 GeV are excluded, depending on the ˜ χ 0 1 mass, for both λ 121 and λ 122 LSP decays. For m χ ˜
01
> 150 GeV, this limit has only a weak dependence on the LSP mass. As the
˜
χ 0 1 mass decreases, the limit rapidly weakens to approximately 300 GeV for m χ ˜
01
= 10 GeV. This general pattern is repeated across all of the models, with maximum excluded masses of approximately 450 GeV for left-handed sleptons, and 1300 GeV for gluinos.
[GeV]
miss
ET
0 50 100 150 200 250 300 350 400 450 500
Events / 20 GeV
10-3
10-2
10-1
1 10 102
103
> 50 GeV)
miss
SR1 (ET
data Total SM Red. Bkg.
ZZ ZWW
Z t t
WW t t
SUSY ref. point ATLAS Preliminary
L dt = 13.0fb-1
∫
s = 8TeV(a)
[GeV]
meff
0 200 400 600 800 1000 1200 1400
Events / 20 GeV
10-3
10-2
10-1
1 10 102
103
> 300 GeV) SR2 (meff
data Total SM Red. Bkg.
ZZ ZWW
Z t t
WW t t
SUSY ref. point ATLAS Preliminary
L dt = 13.0fb-1
∫
s = 8TeV(b)
Figure 6: Distributions of (a) E miss T and (b) m eff in events with at least four leptons and no Z boson candidates. Events in (a) with E T miss > 50 GeV are those in SR1, while events in (b) with m eff > 300 GeV are those in SR2. The uncertainty band includes both statistical and systematic uncertainty. The yield of one benchmark SUSY model is shown for illustration purposes. “SUSY ref. point” is a scenario from the RPV Wino λ 121 simplified model, with m χ ˜
±1
= 600 GeV, m χ ˜
01
= 400 GeV . The signal distribution is not stacked on top of the expected background.
10 Summary
Results from a search for new phenomena in the final state with four or more leptons (electrons or muons), no Z candidates, and either moderate values of missing transverse momentum or large effective mass are reported. The analysis is based on 13.0 fb − 1 of proton-proton collision data delivered by the LHC at √
s = 8 TeV. No significant excess of events is found in data. Observed 95% CL limits on the visible cross-section are placed at 0.34 fb and 0.38 fb in the two signal regions used in this analysis. The null result is interpreted in a range of simplified models in which the lightest neutralino decays promptly into two charged leptons and a neutrino via an RPV coupling. In the Wino simplified model of RPV supersymmetry, chargino masses up to 710 GeV are excluded. Limits on other NLSP choices are: up to
∼ 450 GeV for left-handed sleptons, up to ∼ 410 GeV for sneutrinos, and up to ∼ 1300 GeV for gluinos.
[GeV]
±
χ∼1
m
0 100 200 300 400 500 600 700 800
[GeV]0 1χ∼m
0 100 200 300 400 500 600 700 800
1
χ0
∼
< m
±
χ1
m∼
exp) σ
±1 Expected limit (
theory) σSUSY
±1 Observed limit ( prev. ATLAS exclusion Tevatron exclusion LEP exclusion not explored
ATLASPreliminary explored LSP mass range:
- 10 GeV
± χ1
< m∼ 0 1 χ∼ 10 GeV < m
=8 TeV s -1, L dt = 13.0 fb
∫
> 0 λ121 grid,
± χ∼1 0 χ∼1 simplified model,
All limits at 95% CL
(a)
[GeV]
±
χ∼1
m
0 100 200 300 400 500 600 700 800
[GeV]0 1χ∼m
0 100 200 300 400 500 600 700 800
1
χ0
∼
< m
±
χ1
m∼
exp) σ
±1 Expected limit (
theory) σSUSY
±1 Observed limit ( Tevatron exclusion LEP exclusion not explored
ATLASPreliminary explored LSP mass range:
- 10 GeV
± χ1
< m∼ 0 1
∼χ 10 GeV < m
=8 TeV s -1, L dt = 13.0 fb
∫
> 0 λ122 grid,
± χ∼1 0 χ∼1 simplified model,
All limits at 95% CL
(b)
Figure 7: Observed and expected 95% CL limit contours for the RPV Wino simplified model where (a) λ 121 > 0 and (b) λ 122 > 0. The expected and observed limits are calculated without signal cross-section uncertainty taken into account. The yellow band is the ± 1σ experimental uncertainty on the expected limit. The red dashed band is the ± 1σ signal theory uncertainty on the observed limit. The exclusion contours are optimized by applying in each signal grid point the CL values from the most sensitive signal region (lowest expected CL). Previous exclusion limits are shown from ATLAS [6], D0 [46] and the LEP experiments [47].
[GeV]
lL
m~
0 100 200 300 400 500
[GeV]0 1χ∼m
0 100 200 300 400 500
1 0χ
∼
< m
lL
m~
exp) σ
±1 Expected limit (
theory) σSUSY
±1 Observed limit ( LEP exclusion not explored
ATLASPreliminary explored LSP mass range:
- 10 GeV lL
< m~ 0 χ1
10 GeV < m∼
=8 TeV s -1, L dt = 13.0 fb
∫
> 0 λ121 L), τ∼
, L µ∼
L, e~ L=
~l grid ( lL
~ 0 χ∼1 simplified model,
All limits at 95% CL
(a)
[GeV]
lL
m~
0 100 200 300 400 500
[GeV]0 1χ∼m
0 100 200 300 400 500
1 0χ
∼
< m
lL
m~
exp) σ
±1 Expected limit (
theory) σSUSY
±1 Observed limit ( LEP exclusion not explored
ATLASPreliminary explored LSP mass range:
- 10 GeV lL
< m~ 0 χ1
10 GeV < m∼
=8 TeV s -1, L dt = 13.0 fb
∫
> 0 λ122 L), τ∼
, L µ∼
L, e~ L= l~ grid ( lL
~ 0 χ∼1 simplified model,
All limits at 95% CL
(b)
Figure 8: Observed and expected 95% CL limit contours for the RPV L-slepton simplified model where
(a) λ 121 > 0 and (b) λ 122 > 0. For further details, refer to Figure 7. Limits from LEP on slepton masses
in RPV scenarios are reported in Refs. [47, 48].
[GeV]
mν∼
0 100 200 300 400 500
[GeV]0 1χ∼m
0 100 200 300 400 500
1
χ0
∼
< m
∼ν
m
exp) σ
±1 Expected limit (
theory) σSUSY
±1 Observed limit ( LEP exclusion not explored
ATLASPreliminary explored LSP mass range:
- 10 GeV < mν∼
0 χ1
50 GeV < m∼
=8 TeV s -1, L dt = 13.0 fb
∫
> 0, SR1 λ121 grid (3 Generations), 0ν∼
1 simplified model, χ∼
All limits at 95% CL
(a)
[GeV]
mν∼
0 100 200 300 400 500
[GeV]0 1χ∼m
0 100 200 300 400 500
1
χ0
∼
< m
∼ν
m
exp) σ
±1 Expected limit (
theory) σSUSY
±1 Observed limit ( LEP exclusion not explored
ATLASPreliminary explored LSP mass range:
- 10 GeV < mν∼
0 χ1
50 GeV < m∼
=8 TeV s -1, L dt = 13.0 fb
∫
> 0 λ122 grid (3 Generations), 0ν∼
1 simplified model, χ∼
All limits at 95% CL
(b)
Figure 9: Observed and expected 95% CL limit contours for the RPV sneutrino simplified model where (a) λ 121 > 0 and (b) λ 122 > 0. For further details, refer to Figure 7. Limits from LEP on sneutrino masses in RPV scenarios are reported in Refs. [47, 48].
[GeV]
~g m
600 800 1000 1200 1400 1600
[GeV]0 1χ∼m
0 200 400 600 800 1000 1200 1400 1600
1
χ0
< m∼ g~
m
exp) σ
±1 Expected limit (
theory) σSUSY
±1 Observed limit ( not explored
ATLASPreliminary explored LSP mass range:
- 10 GeV
~g < m
0 χ1
50 GeV < m∼
=8 TeV s -1, L dt = 13.0 fb
∫
> 0 λ121 grid, g~ 0 χ∼1 simplified model,
All limits at 95% CL
(a)
[GeV]
~g m
600 800 1000 1200 1400 1600
[GeV]0 1χ∼m
0 200 400 600 800 1000 1200 1400 1600
1
χ0
< m∼
~g
m
exp) σ
±1 Expected limit (
theory) σSUSY
±1 Observed limit ( not explored
ATLASPreliminary explored LSP mass range:
- 10 GeV g~ < m
0 χ1
50 GeV < m∼
=8 TeV s -1, L dt = 13.0 fb
∫
> 0 λ122 grid, g~ 0 χ∼1 simplified model,
All limits at 95% CL