ATLAS-CONF-2014-029 05/06/2014
ATLAS NOTE
ATLAS-CONF-2014-029
June 5, 2014
Charged hadron production in p + Pb collisions at √
s
NN= 5.02 TeV measured at high transverse momentum by the ATLAS experiment
The ATLAS Collaboration
Abstract
A measurement of charged hadron production in p + Pb collisions at √
s
NN= 5.02 TeV in the transverse momentum range from 4 GeV to 189 GeV is presented. The results use a data sample with an integrated luminosity of 25 nb
−1collected by the ATLAS experiment at the LHC during 2013. The results extend previous measurements by the ATLAS collaboration.
The p + Pb collisions are analysed in centrality classes determined by the total transverse energy. The p +Pb charged particle multiplicities are compared to charged particle produc- tion in pp collisions obtained by interpolating measurements performed at √
s = 2.76 TeV and 7 TeV to √
s = 5.02 TeV. The charged particle nuclear modification factor is found to vary significantly as a function of transverse momentum with a stronger dependence in more peripheral collisions.
c
Copyright 2014 CERN for the benefit of the ATLAS Collaboration.
Reproduction of this article or parts of it is allowed as specified in the CC-BY-3.0 license.
1 Introduction
The partonic structure of nuclei has been studied extensively in deep inelastic scattering experiments [1].
These measurements have established differences in the parton distribution functions (PDFs) in nuclei from those expected from an incoherent superposition of nucleons. These differences include the phe- nomena of shadowing, anti-shadowing [2] and the EMC e ff ect [3]. These observations have inspired sig- nificant theoretical work [4–13], but to date the underlying physics of these phenomena is not completely understood. Proton-ion collisions at the LHC are capable of probing the nucleus at never before exper- imentally accessible scales. This includes particle production from hard scattering processes with large transverse momentum transfer, q
2, which may provide crucial insight into the large-q
2structure of the nu- cleus or even reveal previously unobserved phenomena. Recently, the CMS collaboration reported [14]
a preliminary measurement of inclusive charged particle production at high transverse momentum ( p
T) that shows a striking enhancement in the yield of high-p
Tparticles relative to expectations from pp col- lisions. This result was unexpected and, if confirmed, indicates that there is still much not yet understood about these collisions, or more profoundly, about the nucleus itself. These results constitute some of the first measurements providing new insight using relatively simple and accessible measurements.
Nuclear modification effects are studied by comparing quantities in heavy ion collisions with the corresponding quantities obtained in pp collisions. The rates of hard scattering processes in heavy ion collisions are enhanced relative to pp collisions due to the increased flux of partons per collision, i.e. the nucleus contains many nucleons capable of participating in a hard scattering. This enhancement depends on the thickness of the target nucleus, T
Pb, at the impact parameter of the projectile, which can be inferred from geometric models such as the Glauber model [15]. The particle yields in p + Pb collisions, scaled by T
Pbcan then be compared directly to the cross section for the same process obtained in pp collisions.
Nuclear modification e ff ects are expected themselves to vary with the collision geometry, and thus it is desirable to study such e ff ects di ff erentially. Typically a relationship between the total event activity and collision geometry is assumed. Events are assigned to a particular event class according to their total activity. The yield in each centrality class is then scaled by the average T
Pbfor the corresponding centrality class. This leads to the definition of the nuclear modification factor,
R
pPb(p
T) = 1 hT
pAi
1/N
evtd
2N
p+Pb/dydp
Td
2σ
pp/dyd p
T. (1)
where 1/N
evtd
2N/dp
Tdy is the per-event charged particle yield in p +Pb collisions at 5.02 TeV mea- sured di ff erentially in p
Tand rapidity
1y and d
2σ/d p
Tdy is the corresponding di ff erential cross section measured in ppcollisions.
The p +Pb events were categorised in centrality classes using the total transverse energy measured in the pseudorapidity interval 3.1 < η < 4.9 in the direction of the lead beam. Following standard techniques [16], centrality classes were defined in terms of percentiles of the Σ E
PbTdistribution after accounting for an estimated inefficiency of 2 ± 2% for inelastic p +Pb collisions to pass the applied event selections. The following centrality intervals were used in this analysis, in order from the most central to the most peripheral: 0–10%, 20–30%, 40–60%, 60–90%, with the 60-90% interval serving as the
1ATLAS uses a right-handed coordinate system with its origin at the nominal interaction point (IP) in the center of the detector and thez-axis along the beam pipe. Thex-axis points from the IP to the center of the LHC ring, and theyaxis points upward. Cylindrical coordinates (r, φ) are used in the transverse plane,φbeing the azimuthal angle around the beam pipe. For thep+Pb collisions, the incident Pb beam traveled in the+zdirection. The pseudorapidity is defined in laboratory coordinates in terms of the polar angleθas η = −ln tan(θ/2) All pseudorapidity values quoted in this note are defined in laboratory coordinates. Rapidity is definedy=0.5 ln
(E+pz)/(E−pz)
, whereEis the energy andpzis the longitudinal momentum. To compare thep+Pb andppspectra, the analysis of both samples is done in intervals of centre-of-mass rapidityy?. For thep+Pb data,y? =y−0.465 and for theppdatay?=y. Particle rapidityyis calculated under assumption that the mass of a particle equal to the mass of pion.
reference in the R
CP.
The average T
Pbin classes of centrality are determined from the Glauber model [17] analysis detailed in Ref. [18] and are recalled in Table 1. Also shown are the ratios of hT
Pbi in centrality bin to the hT
Pbi in the centrality bin 60-90%, hR
colli.
centrality hT
Pbi [mb
−1] hR
colli 0-10% 0.208
+−0.0050.0194.89
+−0.270.8320-30% 0.148
+−0.0020.0043.48
+−0.180.3340-60% 0.092
+0.004−0.0062.16
+0.08−0.0760-90% 0.043
+−0.0040.0030-90% 0.107
+−0.0060.007Table 1: Average values for nuclear thickness function hT
Pbi values and its ratio hR
colli to 60-90% for the centrality classes used in this analysis along with its total systematic uncertainties [19].
This note presents measurements of the per-event charged particle yields in √
s
NN= 5.02 TeV p +Pb collisions as a function of transverse momentum in the range 4 < p
T< 189 GeV. Bins were chosen such that they have approximately the same width in the logarithmic scale. It extends measurements previously presented by the ATLAS Collaboration [20] based on the data sample with integrated lumi- nosity of 1 µb
−1obtained during the pilot run in 2012 which were limited by statistics to the transverse momentum range below 22 GeV. The per-event yields are analysed in intervals of rapidity and classes of collision centrality. The collision centrality is estimated from the sum of transverse energy measured in the ATLAS forward calorimeter in the Pb beam direction, 3.1 < |η| < 4.9.
Related measurements of identified particle spectra in p + Pb collisions have been reported by AL- ICE [21] and CMS [22]. ALICE also published results of centrality-integrated charged hadron produc- tion in a narrow pseudorapidity window relative to the centre-of-mass frame |η
cms| < 0.3 [23], centrality dependent measurement has been reported by ATLAS [20]. Extended in p
Tmeasurement of the nuclear modification factor has been performed by ALICE [24] and CMS [14].
2 The ATLAS detector
The measurements presented in this note are performed using the ATLAS inner detector (ID), calorimeter system, minimum-bias trigger scintillators (MBTS), trigger system and data acquisition systems [25].
The ID measures the trajectories of charged particles with a combination of silicon pixel detector, silicon micro-strip detector (SCT), and a straw-tube transition radiation tracker (TRT), all of which are immersed in a 2 T axial magnetic field [26]. A particle travelling from the interaction point with |η| < 2 crosses at least 3 pixel layers, 4 double sided micro-strip layers and typically 36 straw tubes. The calorimeter system consists of a liquid argon (LAr) electromagnetic (EM) calorimeter covering |η| < 3.2, a steel- scintillator sampling hadronic calorimeter covering |η| < 1.7, a LAr hadronic calorimeter covering 1.5 <
|η| < 3.2, and two LAr electromagnetic and hadronic forward calorimeters (FCal) covering 3.2 < |η| <
4.9. The hadronic calorimeter has three longitudinal sampling layers and has a ∆ η × ∆ φ granularity of
0.1× 0.1 for |η| < 2.5 and 0.2× 0.2 for 2.5 < |η| < 4.9. The EM calorimeters are longitudinally segmented
into three layers with an additional pre-sampler layer. Together, they provide 10 interaction lengths of
material. The minimum-bias trigger scintillators consist of two arrays of scintillation counters positioned
at z = ±3.6 m which measure the presence of charged particles over 2.1 < |η| < 3.9.
3 Data sets and event selection
The p + Pb data presented here were recorded in early 2013. The Pb ions had an energy per nucleon of 1.57 TeV and collided with the 4 TeV proton beam to yield a centre-of-mass energy √
s
NN= 5.02 TeV with a longitudinal rapidity boost of 0.465 relative to the ATLAS laboratory frame. During the 2013 p + Pb run, the directions of the p and Pb beams circulating in the LHC were changed in approximately the middle of the run. Data from both periods are used in the analysis and are presented in the configuration corresponding to the second half of the run in which the proton had positive rapidity and the lead nucleus had negative rapidity. These directions are opposite to the ones used in 2012 pilot run the results of which are presented in Ref. [18, 20].
The p +Pb events used in this analysis are selected from several triggered samples, only a fraction of all events which fire a trigger was randomly selected to be recorded for further analysis. The reciprocal of this fraction, called the trigger prescale factor, was set di ff erently for each trigger. A minimum-bias (MB) sample was obtained using a Level-1 trigger requiring signal coincidences on opposite sides of the MBTS detector. Jets were reconstructed in the events that passed this Level-1 requirement using the anti-k
talgorithm [27] with distance parameter R = 0.4 in the high-level trigger (HLT). Events were selected by the jet trigger if they contained jets above a given threshold. Multiple thresholds each with its own prescale factor were defined. For the highest p
Tthresholds, the Level-1 jet trigger was used instead of the MBTS. The triggers used in this analysis are the same as those used in the analysis presented in Ref. [19].
In the o ffl ine analysis, events were selected if the times measured by the two sides of the MBTS di ff ered by less than 10 ns. Tracks were required to have p
T> 0.1 GeV. Events were required to have at least one reconstructed track and a reconstructed vertex containing at least two tracks. A collision vertex is required to satisfy |z
vtx| < 150 mm. Vertices are reconstructed by an algorithm optimised for minimum- bias pp measurements [28]. Events containing multiple p + Pb collisions (pileup) were suppressed by rejecting events with a second reconstructed vertex having either a scalar transverse momentum sum Σ p
T> 5 GeV or more than 10 tracks, removing an additional ∼ 2% of events. The residual pileup fraction has been estimated to be below 1% in the most central events and significantly smaller in peripheral events. To remove contributions from electromagnetic and diffractive processes, a rapidity gap analysis similar to that applied in [18–20] is used. The detector is divided into slices of ∆ η = 0.2 and edge gaps are calculated as the distance from the edge of the calorimeter to the nearest slice that contains a cluster with a minimum transverse energy of 200 MeV. Events with a large edge gap (∆ η
Pbgap> 2) in the positive η (Pb) direction are excluded from the analysis. No requirement was imposed on edge gaps on the negative η ( p) side. After applying event selection criteria, the total integrated luminosity of the p + Pb collisions used in this analysis is approximately equal to 25 nb
−1[19].
The LHC did not collide protons at the same nucleon-nucleon energy as the p +Pb collisions. There- fore, the pp spectrum used as a reference for the p + Pb is based on an interpolation of spectra obtained from two data samples measured at √
s = 2.76 TeV and 7 TeV. The pp data sample at √
s = 2.76 TeV was recorded immediately following the p +Pb data and represents a total integrated luminosity of 4.0 pb
−1. It uses a trigger setup similar to that used for p + Pb. The pp data set at √
s = 7 TeV with integrated luminosity of 156 pb
−1was obtained by ATLAS in 2010. The jets were selected in a similar way to the p +Pb data based on available triggers. Jets reconstructed online by the HLT were required to ex- ceed E
T> 15 GeV. In the analysis, neither the rapidity gap requirement nor the requirement of a single reconstructed vertex were applied to the pp data.
To study the effects of the detector response on the measurement, Monte Carlo (MC) simulation samples were produced using the PYTHIA event generator [29]. The detector response was then sim- ulated using the GEANT4 [30, 31] description of the ATLAS detector. Samples with √
s = 2.76 TeV
and 7 TeV were produced with the detector conditions reproducing those of the data. Along with MB
events, several samples of events were produced for different intervals of generator-level R = 0.4 jet p
Tin order to obtain good statistics precision over large range in charged particle p
T. Similarly, a sample of
pp collisions at √
s = 5.02 TeV was simulated, but with the output boosted to match the boost due to the asymmetry of the collisions. This simulation output was overlaid onto minimum-bias p +Pb data, thus mimicking the p + Pb environment present in the data. Additional p + Pb samples were produced from a HIJING [32] v1.38b without overlay procedure. Separate MC samples were produced for each of the beam orientations during the 2013 run.
4 Reconstruction of charged particle spectra
Charged particle tracks were reconstructed in the ID using an algorithm optimised for pp events [33].
Tracks selected for this analysis are required to satisfy all requirements used in the previous analysis [20].
Additionally, tracks with p
T> 10 GeV are required to produce at least 8 hits in the straw tubes of the TRT. This requirement selects tracks with better p
Tresolution and suppresses the contribution of poorly reconstructed tracks. Yet it limits the analysis to the coverage of the TRT detector, thus all tracks are selected with |η| < 2. The higher statistics and improved performance of the tracks analysis extend the range of the analysis to p
T< 189 GeV, which is a significant increase over the previous measurement with p
T< 22 GeV [20].
The number of the high-p
Ttracks in the MB sample rapidly decreases with track momentum. Events with high-p
Ttracks were thus taken with the jet triggers. More than 99% of all tracks with p
T> 15 GeV reside within a cone of a radius R = p
∆ η
2+ ∆ φ
2< 0.4 from the direction of an o ffl ine reconstructed jet. Jets were reconstructed from energy deposits measured in the ATLAS calorimeter using the anti-kt algorithm with R = 0.4 [27]. All tracks with momentum higher that 15 GeV both in the MB and in the jet triggered samples are required to match calorimetric jets within a cone with a radius R < 0.4, thus each track has a paired jet corresponding to it. This requirement suppresses the contribution of incorrectly reconstructed tracks and allows the use of the jet triggered events to extend the MB charged hadron spectra out to much higher p
T. To further reject incorrectly reconstructed tracks, a condition of p
T< 0.8E
T+ 10 GeV is imposed on the track-jet pairs, where the jet E
Tis the fully corrected transverse energy of the jet and p
Tis the transverse momentum of the track. This cut removes less than 1% of all primary MC tracks independently of p
T.
Jet events were obtained with jet triggers which used di ff erent thresholds and the prescale factor was set differently for each trigger threshold. An energetic jet can fire a series of jet triggers with consecutive E
Tthresholds and can be recorded randomly by each trigger according to its prescale factor. As a result, the recorded rate of jets with di ff erent E
Tdoes not reflect their production rate in the data. In the analysis, each jet trigger threshold is used for an interval of jet E
Tsuch that the measured jet trigger efficiency [20]
inside the interval is above 99%, and the efficiency of a the triggers with higher thresholds are below 99%.
Only tracks matching jets inside a cone with a radius R < 0.4 are selected for further analysis. Tracks corresponding to jets outside E
Tranges, or to the jets which did not fire a jet trigger, are rejected.
The combined raw track sample is constructed as follows. In the range p
T< 15 GeV, only tracks from the MB trigger sample are selected. Above this p
T, tracks in the MB sample are selected if they correspond to a jet with E
Tbelow the lowest jet trigger interval. Tracks from the jet triggered events are selected in the range p
T> 15 GeV. Tracks from the MB event trigger and the jet triggers are weighted with corresponding prescale factors. The same procedure is applied in the p + Pb and in the pp data samples.
The analysis of the charged particle spectra presented in this note refers to primary charged parti-
cles with a mean lifetime greater than 0.3 × 10
−3s directly produced in the interactions or a charged
particle coming from subsequent decays of particles with a shorter lifetime [33]. All other particles are
considered secondary.
The raw charged particles multiplicities in p +Pb and pp are corrected for the tracks associated with secondary particles, for momentum resolution and for tracking ine ffi ciency, using a similar procedure to that used in Ref. [20]. These corrections are functions of p
Tand y
?and are estimated using MC samples corresponding to p +Pb and pp collisions of the same energy, the same detector configuration, the same beam direction and processed with the same algorithms as the data. In the MC simulation the categorisation of a particle relies on the association of a reconstructed track to a generated particles. The association is based on contributions of true particles to the hits in the detector layers. A reconstructed track is associated to a true particle if it uses hits produced primarily by this particle. Typically, tracks which are not associated at all have kinematic parameters significantly different from their true generated particles. Those tracks are treated as “fake tracks” and are corrected for in the analysis. The algorithm to match reconstructed tracks to generated particles is discussed further in Ref. [34]. First, the raw spectra are corrected at each p
Tfor the fraction of tracks associated to secondary particles and for the fraction of tracks which cannot be associated to primary particles in the MC. The fraction of secondaries have been estimated from the MC, and it is at most 1% at p
T= 4 GeV below 1%. The fraction of particles in the MC which could not be associated to generated particles strongly depend on p
Tand at the highest measured p
Treaches 13% and depends on rapidity. These corrections are applied as multiplicative factors. Next, the resulting spectra are unfolded using Bayesian unfolding [35] to correct the finite detector p
Tresolution. The iterative unfolding procedure rapidly converges after the first iteration, further iterations do not change the result by more than 2% even at the highest p
T. They are then corrected for particle loss in reconstruction by dividing result by the reconstruction e ffi ciency at each p
Tand y
?.
Figure 1 shows a subset of the tracking e ffi ciencies used for correcting the track distributions, for
[GeV]
pT
10 102
Efficiency
0.5 0.6 0.7 0.8 0.9
1 ATLAS Simulation Preliminary
=5.02 TeV sNN
p+Pb 2013 0-90%
-1.5 < y* < -1.25 -0.75 < y* < -0.5 0.25 < y* < 0.5
[GeV]
pT
10 102
Simulation Preliminary ATLAS
=5.02 TeV sNN
Pb+p 2013 0-90%
-1.5 < y* < -1.25 -0.75 < y* < -0.5 0.25 < y* < 0.5
Figure 1: The p
Tdependence of the track reconstruction e ffi ciency as a function of the generated particle momentum in several y
?intervals, for the 0–90% centrality class and for the two running periods of p +Pb collisions. In the A period (left) the protons circulated in the positive z-direction and in B (right), in the negative z-direction.
the 0–90% centrality class and for a set of subranges in y
?. The e ffi ciency has a very weak centrality dependence with the maximum variation from peripheral to central collisions which does not exceed 2%.
The efficiency is generally higher at mid rapidity, reaching above 80%, and decreases towards forward
rapidities, to approximately 70%. A sharp drop at p
T= 10 GeV is due to the requirement of at least
8 straw tube hits in the TRT detector. This requirement is varied in a wide range of p
Tand found to
produce no significant effect on the corrected distributions. At the highest measured p
Tthe efficiency
loss associated to this cut is approximately 10% and has only weak rapidity and centrality dependence.
An analysis performed without the TRT cut at p
T< 60 GeV shows consistent results.
5 Systematic uncertainties
Systematic uncertainties are evaluated by varying individual sources within the ranges of their uncer- tainties and comparing the result to the results of the default analysis. A summary of the systematic uncertainties on the charged particle yields in p +Pb collisions is shown in Fig. 2.
[GeV]
pT
10 102
Systematic Uncertainties
0 0.05 0.1 0.15 0.2 0.25 0.3
Total
Track selection Non-primary fraction MC statistics
resolution pT
Jet trigger Material budget Period dependence
Preliminary ATLAS
p+Pb 2013
=5.02 TeV sNN
0-90%
-2<y*<1.5
Figure 2: The sources of systematic uncertainty on the track reconstruction e ffi ciency as a function of p
T, for the rapidity interval −2 < y
?< 1.5 and for the 0–90% centrality class.
The uncertainty on the detector description arises from the details of the Pixel and SCT detector acceptances and e ffi ciencies. The locations of the inactive modules were matched between the data and simulation. The track selection cuts on the number of hits in the detectors and on the parameters associated with the pointing to a primary vertex were varied and the results compared to standard cuts.
The e ff ect of this variation results in 2% uncertainty at low p
Tand increases to 5% at the highest measured p
T, this contribution is shown as the Track selection uncertainty in Fig. 2.
Due to that fact that the categorisation of a particle relies on the association of a reconstructed track to a generated particles in MC, the parameters of the track to particle association are varied in a wide range and a conservative systematic uncertainty reaching up to 15% in the outermost p
Tand y
?bins is added to the total uncertainty. The uncertainty due to this effect is shown in Fig. 2 as the non-primary fraction.
The comparison between p + Pb and pp spectra is made in intervals of the centre-of-mass rapidity y
?. Non-primary fraction in Fig. 2 also accounts for an additional uncertainty at low p
T, as the calculation of y
?is made with the assumption that all particles are pions, this introduces an uncertainty of 1%, estimated by comparing the di ff erence between using the pion mass assumption and the true mass.
Due to the limited statistics of the MC samples, for p
T> 15 GeV, an exponential fit is applied to smooth the final efficiency curves for p
T> 15 GeV. The uncertainties of the fit, reaching 10% at high y
?and high p
Tare calculated with respect to the covariance error matrix of the fit in each point, are added to the systematic uncertainties. The averaged uncertainty is shown in the plot as MC statistics.
Uncertainties on the momentum resolution of the ID tracking system add a significant contribution
to the systematic uncertainties at high p
Tof reconstructed tracks. This contribution is studied in the MC
by smearing the curvature (1/ p
T) of the reconstructed particle by an additional 10%, the choice of the value of additional smearing is taken as a possible di ff erence between the data and the MC based on the studies of muon tracks in the inner detector which have extensions in the muon system, which provide an independent measurement of track momentum. Another effect contributing to this uncertainty is the di ff erence in the shape of p
Tspectra of the MC and the data jets. The MC is reweighted to match the measured distribution and the resulting contribution of 1-5% is added to the systematic uncertainty. The resulting uncertainty is shown in the figure as p
Tresolution.
The uncertainties related to the description of the inactive detector material were evaluated using a p +Pb MC sample with 10% extra material. The changes to the final result are found to vary between 1-7% depending primarily on η. This systematic error is applied to both pp and p +Pb.
The jet triggers are used in the regions in which their e ffi ciencies reach 99% e ffi ciency. A residual 1% uncertainty due to possible inefficiency of the jet trigger is added to the systematic uncertainty.
This contribution is shown in the figure as jet trigger. The p
Tregion of the spectra measured with tracks obtained from the jet trigger sample is compared between the two parts of the run with opposite directions of the p and Pb beams in the LHC. Di ff erences up to 5% were found in the number of tracks between different periods, this systematics results from the differences in the jet trigger in the two parts of the run.
This number is taken as a systematic uncertainty and its contribution to the total uncertainty is indicated in the figure as period dependence.
The uncertainty on the event selection is accounted for in the uncertainty of the corresponding hT
Pbi values as explained in Ref. [19]. The luminosity of the pp data samples has an uncertainty of 3.2% and 4% for the measurements at √
s = 2.76 and 7 TeV respectively provided in Ref. [36]. For R
pPbmost of the systematic uncertainties between p +Pb and pp contribute to the final ratio, since the y
?variable corresponds to di ff erent areas in the detector, as the two systems are in two di ff erent centre-of-mass frames.
Once the differential cross sections at 2.76 and 7 TeV have been measured, the charged particle cross section at √
s = 5.02 TeV is obtained by interpolation. Two interpolations are performed for every p
Tbin in each rapidity interval used in the p + Pb analysis. The first interpolation is proportional to √
s and the second to ln( √
s). Possible distortions introduced by the interpolation algorithm are studied with MC simulations based on PYTHIA8 at the three centre-of-mass energies, √
s = 2.76, 5.02 and 7 TeV.
Charged particle cross sections obtained by the two interpolation methods are compared to the generated cross section at √
s =5.02 TeV at each p
Tand y
?value. The ratio of the generated cross section to the interpolated one is taken as a multiplicative factor for each interpolation, the same as in Ref. [20].
The ln( √
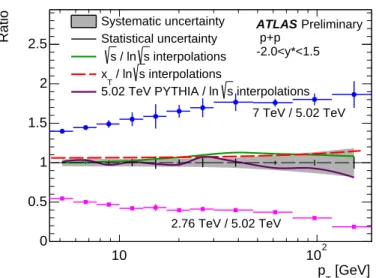
s)-based interpolation is used in the analysis mainly due to its consistency with the behavior of pp total cross sections at high energy [37]. The result produced by the interpolation is compared to results obtained with an x
Tscaling method applied to jets [38] and is similar to a technique used by the CMS collaboration [14]. Figure 3 summarises the results of the interpolation methods for the acceptance ( − 2 < y
?< 1.5) in pp rapidity. The square markers show the ratio of the input cross section at √
s = 2.76 TeV to the interpolated cross section at √
s = 5.02 TeV using the ln( √
s) interpolation, which is used by default. The circles show the same ratio but with the √
s = 7 TeV cross section in the numerator. The green line shows the comparison between the interpolation that uses √
s divided by that using ln( √
s). The red dashed line shows the comparison between the interpolation that uses x
Tscaling divided by the interpolation that uses ln( √
s). The ratio of the cross section obtained from the PYTHIA simulation for √
s = 5.02 TeV to the ln( √
s)-interpolated cross section is shown as a purple line. The grey band shows the overall systematic uncertainty of the pp measurement at √
s = 2.76 TeV, it is used as an uncertainty for the √
s = 5.02 TeV interpolated spectra. The quadrature sum of uncertainties (gray band in the figure) and the difference in results between √
s and ln( √
s) interpolations (green line) are taken as
the systematic uncertainty on the interpolation.
[GeV]
pT
10 102
Ratio
0 0.5 1 1.5 2 2.5
Preliminary ATLAS
p+p -2.0<y*<1.5 Systematic uncertainty
Statistical uncertainty interpolations s
/ ln s
interpolations s
/ ln xT
interpolations s
5.02 TeV PYTHIA / ln
7 TeV / 5.02 TeV
2.76 TeV / 5.02 TeV
Figure 3: √ The ratios of the input invariant cross sections to the interpolated cross section at s = 5.02 TeV. The ratio of the √
s = 7 TeV (2.76 TeV) spectrum is indicated by squares (circles), the error bars reflect the statistical uncertainties of the input spectra. The error bars shown on the unity re- flect the statistical uncertainties of the √
s = 5.02 TeV ln( √
s)-interpolated cross section. The green line indicates the ratio of the cross section obtained when interpolating linearly in √
s to that obtained when interpolating linearly in ln( √
s). The ratio of the x
T-interpolated cross section to the ln( √
s)-interpolated cross section is shown as a dashed red line. The ratio of the cross section obtained from the PYTHIA simulation for √
s = 5.02 TeV to the ln( √
s)-interpolated cross section is shown as a purple line. The grey band shows the systematic uncertainty of the pp measurement at √
s = 2.76 TeV.
6 Results
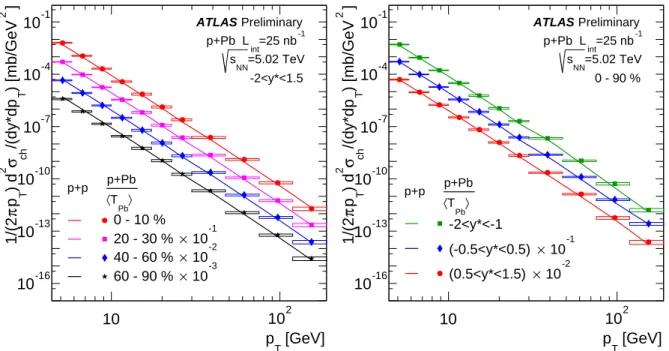
The di ff erential yields of charged hadrons measured in p + Pb collisions at √
s = 5.02 TeV and divided by hT
Pbi are shown in Fig. 4. The left panel shows p
Tspectra integrated over the largest possible rapidity interval −2. < y
?< 1.5 in the four centrality classes. The right panel shows the spectra in the 0–90%
centrality class for several y
?intervals. The ratio of the p + Pb to pp yields shown in Fig. 4 provide the R
pPbmeasurement.
Figure 5 shows R
pPbfor the 0–90% centrality class for three different rapidity intervals: −2 < y
?<
−1, −0.5 < y
?< 0.5 and 0.5 < y
?< 1.5. Within the systematic uncertainties, R
pPbshows a dependence
on y
?only for p
T< 9 GeV. This is consistent with the preliminary ATLAS result [20] and demonstrates a significant dependence of particle production on rapidity.
The measured nuclear modification factors R
pPbare shown in Figure 6 as a function of the charged- particle transverse momentum. The R
pPbare shown in the rapidity interval − 2 < y
?< 1.5 for the 60–90%, 20–30% and 0–10% centrality classes. Within the systematic uncertainties, the data shows the increase of the nuclear modification factor with increasing p
T(from 10 GeV to 189 GeV) in all centrality classes, compared to lower p
Tvalues.
The R
pPbvalue are consistent with the preliminary results previously presented by the CMS collabo- ration [14]. A similar trend, demonstrating significant increase with p
Tof nuclear modification factor in peripheral collisions, was also reported by the PHENIX collaboration in a measurement performed with
π-mesons and reconstructed jets [39] in d +Au collisions at √
s = 200 GeV. All these three results seem
to show a di ff erent trend to the ALICE results [24].
[GeV]
pT
10 102
]2 ) [mb/GeV T/(dy*dp chσ2 ) d Tpπ1/(2
10-16
10-13
10-10
10-7
10-4
10-1 ATLAS Preliminary
=25 nb-1
p+Pb Lint
=5.02 TeV sNN
-2<y*<1.5
0 - 10 %
20 - 30 % × 10-1 40 - 60 % × 10-2 60 - 90 % × 10-3
Pb〉
〈T p+p p+Pb
[GeV]
pT
10 102
]2 ) [mb/GeV T/(dy*dp chσ2 ) d Tpπ1/(2
10-16
10-13
10-10
10-7
10-4
10-1 ATLAS Preliminary
=25 nb-1
p+Pb Lint
=5.02 TeV sNN
0 - 90 %
-2<y*<-1
(-0.5<y*<0.5) × 10-1 (0.5<y*<1.5) × 10-2
Pb〉
〈T p+p p+Pb
Figure 4: (left) Differential yields of charged particles produced in p +Pb collisions at √
s = 5.02 TeV in four centrality classes averaged over −2 < y
?< 1.5. The yields are divided by the hT
Pbi of the corresponding centrality class. (right) The same invariant yields are presented for three y
?intervals for the 0–90% centrality class. The p +Pb spectra are shown as filled markers and the interpolated pp cross sections as lines. The p +Pb and pp points are scaled by constant factors (indicated in the legend) for visibility. The statistical uncertainties are indicated with vertical lines and the systematic uncertainties are indicated with boxes.
7 Conclusions
This note presents a measurement of charged hadron production in p + Pb collisions at √
s
NN= 5.02 TeV by the ATLAS experiment at the LHC. The nuclear modification factor, R
pPb, is obtained from p +Pb collision rates measured at √
s
NN= 5.02 TeV and the interpolation of measurements of pp inclusive charged hadron production cross sections performed at √
s = 2.76 TeV and 7 TeV. The measurements
of R
pPbare presented in the centre-of-mass frame in the rapidity range −2 < y
?< 1.5 and transverse
momentum 4 < p
T< 189 GeV. The nuclear modification factor measured in this analysis shows signs
of increasing with p
T. This trend does not have a strong rapidity dependence but is more marked in
peripheral events, and is consistent with an observation reported by the PHENIX collaboration. The
results presented in this note seem to show the same trend at high p
Tas was observed by the CMS
collaboration but not the ALICE collaboration.
[GeV]
p
T10 102
pPb
R
0.5 1 1.5 2
-2<y*<-1
Preliminary ATLAS
=25 nb-1
p+Pb Lint
=5.02 TeV sNN
0-90%
[GeV]
pT
10 102
pPbR
0.5 1 1.5 2
-0.5<y*<0.5
[GeV]
pT
10 102
pPbR
0.5 1 1.5 2
0.5<y*<1.5
Figure 5: The R
pPbas a function of p
Tmeasured for the 0–90% centrality class in rapidity ranges −2 <
y
?< −1 (left), −0.5 < y
?< 0.5 (middle) and 0.5 < y
?< 1.5 (right). Vertical bars indicate the statistical uncertainty of the measurement. Systematic uncertainties are plotted with step lines encompassing each point, the systematic uncertainty of hT
Pbi is not included in the bands and is plotted at unity.
[GeV]
p
T10 102
pPb
R
0.5 1 1.5 2
60 - 90 % Preliminary
ATLAS
=25 nb-1
p+Pb Lint
=5.02 TeV sNN
-2<y*<1.5
[GeV]
pT
10 102
pPbR
0.5 1 1.5 2
20 - 30 %
[GeV]
pT
10 102
pPbR
0.5 1 1.5 2
0 - 10 %
Figure 6: The R
pPbas a function of p
Tmeasured for the −2 < y
?< 1.5 rapidity range for the 60–
90% (left), 20–30% (middle) and for 0–10% centrality class (right). Vertical bars indicate the statistical
uncertainty of the measurement. Systematic uncertainties are plotted with step lines encompassing each
point, the systematic uncertainties of hT
Pbi are not included in the bands and shown with the gray-shaded
bands at unity.
References
[1] M. Arneodo, Nuclear e ff ects in structure functions, Phys. Rept. 240 (1994) 301–393.
[2] C. Salgado, J. Alvarez-Muniz, F. Arleo, N. Armesto, M. Botje, et al., Proton-Nucleus Collisions at the LHC: Scientific Opportunities and Requirements, J. Phys. G39 (2012) 015010,
arXiv:1105.3919 [hep-ph].
[3] EMC Collaboration, J. Aubert et al., The ratio of the nucleon structure functions F
2Nfor iron and deuterium, Phys. Lett. B123 (1983) 275 – 278.
[4] B. Z. Kopeliovich, A. Schafer, and A. V. Tarasov, Nonperturbative e ff ects in gluon radiation and photoproduction of quark pairs, Phys. Rev. D62 (2000) 054022, arXiv:hep-ph/9908245 [hep-ph].
[5] G. Barnafoldi, J. Barrette, M. Gyulassy, P. Levai, and V. Topor Pop, Predictions for p + Pb at 4.4A TeV to Test Initial State Nuclear Shadowing at energies available at the CERN Large Hadron Collider, Phys. Rev. C85 (2012) 024903, arXiv:1111.3646 [nucl-th].
[6] L. D. McLerran and R. Venugopalan, Computing quark and gluon distribution functions for very large nuclei, Phys. Rev. D49 (1994) 2233–2241, arXiv:hep-ph/9309289 [hep-ph].
[7] K. Eskola, V. Kolhinen, and C. Salgado, The Scale dependent nuclear e ff ects in parton
distributions for practical applications, Eur. Phys. J. C9 (1999) 61–68, arXiv:hep-ph/9807297 [hep-ph].
[8] D. Kharzeev, Y. V. Kovchegov, and K. Tuchin, Cronin e ff ect and high p
Tsuppression in pA collisions, Phys. Rev. D68 (2003) 094013, arXiv:hep-ph/0307037 [hep-ph].
[9] J. L. Albacete and C. Marquet, Single Inclusive Hadron Production at RHIC and the LHC from the Color Glass Condensate, Phys. Lett. B687 (2010) 174–179, arXiv:1001.1378 [hep-ph].
[10] P. Tribedy and R. Venugopalan, QCD saturation at the LHC: comparisons of models to p + p and A + A data and predictions for p + Pb collisions, Phys. Lett. B710 (2012) 125–133,
arXiv:1112.2445 [hep-ph].
[11] J. Jalilian-Marian and A. H. Rezaeian, Hadron production in pA collisions at the LHC from the Color Glass Condensate, Phys. Rev. D85 (2012) 014017, arXiv:1110.2810 [hep-ph].
[12] J. L. Albacete, A. Dumitru, H. Fujii, and Y. Nara, CGC predictions for p + Pb collisions at the LHC, Nucl. Phys. A897 (2013) 1–27, arXiv:1209.2001 [hep-ph].
[13] J. Albacete et al., Predictions for p + Pb Collisions at √
s
NN= 5 TeV, Int. J. Mod. Phys. E22 (2013) 1330007, arXiv:1301.3395 [hep-ph].
[14] CMS Collaboration, Charged particle nuclear modification factor and pseudorapidity asymmetry in pPb collisions at √
s
NN= 5.02 TeV with CMS, CMS-PAS-HIN-12-017.
https://cds.cern.ch/record/1625865.
[15] B. Alver, M. Baker, C. Loizides, and P. Steinberg, The PHOBOS Glauber Monte Carlo, arXiv:0805.4411.
[16] ATLAS Collaboration, Measurement of the centrality dependence of the charged particle pseudorapidity distribution in lead-lead collisions at √
s
NN= 2.76 TeV with the ATLAS detector,
Phys. Lett. B710 (2012) 363–382, arXiv:1108.6027 [hep-ex].
[17] M. L. Miller, K. Reygers, S. J. Sanders, and P. Steinberg, Glauber modeling in high energy nuclear collisions, Ann. Rev. Nucl. Part. Sci. 57 (2007) 205–243, arXiv:nucl-ex/0701025.
[18] ATLAS Collaboration, Measurement of the centrality dependence of the charged particle pseudorapidity distribution in proton-lead collisions at √
s
NN= 5.02 TeV with the ATLAS detector, ATLAS-CONF-2013-096. https://cds.cern.ch/record/1599773.
[19] ATLAS Collaboration, Measurement of the centrality-dependence of inclusive jet production in p + Pb data at √
s
NN= 5.02 TeV with the ATLAS detector, ATLAS-CONF-2013-105.
https://cds.cern.ch/record/1624014.
[20] ATLAS Collaboration, Transverse momentum, rapidity, and centrality dependence of charged particle production in p + Pb √
s
NN= 5.02 TeV collisions measured by ATLAS experiment at the LHC, ATLAS-CONF-2013-107. https://cds.cern.ch/record/1624333.
[21] ALICE Collaboration, Multiplicity Dependence of Pion, Kaon, Proton and Lambda Production in p–Pb Collisions at √
s
NN= 5.02 TeV, arXiv:1307.6796 [nucl-ex].
[22] CMS Collaboration, Study of the production of charged pions, kaons, and protons in pPb collisions at √
s
NN= 5.02 TeV, arXiv:1307.3442 [hep-ex].
[23] ALICE Collaboration, Transverse Momentum Distribution and Nuclear Modification Factor of Charged Particles in p-Pb Collisions at √
s
NN= 5.02 TeV, arXiv:1210.4520 [nucl-ex].
[24] ALICE Collaboration, Transverse momentum dependence of inclusive primary charged-particle production in p-Pb collisions at √
s
NN= 5.02 TeV, arXiv:1405.2737 [nucl-ex].
[25] ATLAS Collaboration, The ATLAS Experiment at the CERN Large Hadron Collider, JINST 3 (2008) S08003.
[26] ATLAS Collaboration, The ATLAS Inner Detector commissioning and calibration, Eur. Phys. J.
C70 (2010) 787–821, arXiv:1004.5293 [physics.ins-det].
[27] M. Cacciari, G. P. Salam, and G. Soyez, The Anti-k(t) jet clustering algorithm, JHEP 0804 (2008) 063, arXiv:0802.1189 [hep-ph].
[28] ATLAS Collaboration, Performance of primary vertex reconstruction in proton-proton collisions at √
s = 7 TeV in the ATLAS experiment, ATLAS-CONF-2013-069.
http://cds.cern.ch/record/1281344.
[29] T. Sjostrand, S. Mrenna, and P. Z. Skands, PYTHIA 6.4 Physics and Manual, JHEP 0605 (2006) 026, arXiv:hep-ph/0603175 [hep-ph].
[30] S. Agostinelli et al., GEANT4: A simulation toolkit, Nucl. Instrum. Meth. A506 (2003) 250–303.
[31] ATLAS Collaboration, The ATLAS Simulation Infrastructure, Eur. Phys. J. C70 (2010) 823–874, arXiv:1005.4568 [physics.ins-det].
[32] M. Gyulassy and X.-N. Wang, HIJING 1.0: A Monte Carlo program for parton and particle production in high-energy hadronic and nuclear collisions, Comput.Phys.Commun. 83 (1994) 307, arXiv:nucl-th/9502021 [nucl-th].
[33] ATLAS Collaboration, Charged-particle multiplicities in pp interactions measured with the
ATLAS detector at the LHC, New J. Phys. 13 (2011) 053033, arXiv:1012.5104 [hep-ex].
[34] T. Cornelissen, M. Elsing, I. Gavrilenko, W. Liebig, and A. Salzburger, Single Track Performance of the Inner Detector New Track Reconstruction (NEWT), ATL-INDET-PUB-2008-002.
https://cds.cern.ch/record/1092934.
[35] G. Choudalakis for the ATLAS Collaboration, Unfolding in ATLAS, arXiv:1104.2962 [hep-ex].
[36] ATLAS Collaboration, Luminosity Determination in pp Collisions at √
s = 7 TeV Using the ATLAS Detector at the LHC, Eur. Phys. J. C71 (2011) 1630, arXiv:1101.2185 [hep-ex].
[37] M. Froissart, Asymptotic Behavior and Subtractions in the Mandelstam Representation, Phys. Rev.
123 (1961) 1053–1057. http://link.aps.org/doi/10.1103/PhysRev.123.1053.
[38] ATLAS Collaboration, Measurement of the inclusive jet cross section in pp collisions at
√ s = 2.76 TeV and comparison to the inclusive jet cross section at √
s = 7 TeV using the ATLAS detector, Eur. Phys. J. C73 (2013) 2509, arXiv:1304.4739 [hep-ex].
[39] D. V. Perepelitsa for the PHENIX Collaboration, Exploring cold nuclear matter e ff ects in d + Au
with high-p
Treconstructed jets at PHENIX, Nucl. Phys. A 904-905 (2013) 1003c – 1006c.
8 Appendix
[GeV]
p
T10 10
2pPb
R
0.8 1 1.2 1.4 1.6 1.8 2 2.2
Preliminary ATLAS
=25 nb-1
p+Pb Lint
=5.02 TeV sNN
0-90%
-1<y*<1
Figure 7: The R
pPbas a function of p
Tmeasured for the |y
?| < 1 rapidity range for the 0–90% centrality
class. Vertical bars indicate the statistical uncertainty of the measurement. Systematic uncertainties are
plotted with step lines encompassing each point, the systematic uncertainty of hT
Pbi is not included in
the bands and shown with the gray-shaded band at unity.
[GeV]
p
T10 10
2pPb
R
0.8 1 1.2 1.4 1.6 1.8 2 2.2
Jet triggers MBTS trigger
PreliminaryATLAS
=25 nb-1
p+Pb Lint
=5.02 TeV sNN
-2<y*<1.5 0-90%
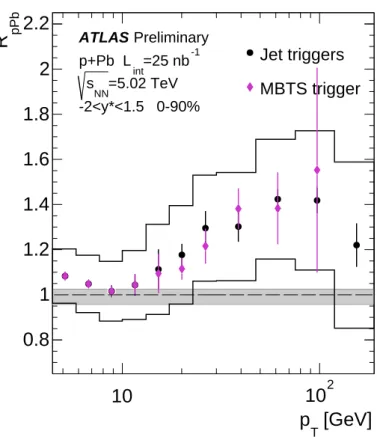
Figure 8: The R
pPbas a function of p
Tmeasured for the −2 < y
?< 1.5 rapidity range for the 0–
90% centrality class (black circles) compared to the R
pPbwhich uses only the MBTS triggered sample
(magenta diamonds). Vertical bars indicate the statistical uncertainty of the measurement. Systematic
uncertainties are plotted with step lines encompassing each point, the systematic uncertainty of hT
Pbi is
not included in the bands and shown with the gray-shaded band at unity.
[GeV]
p
T10 10
2pPb
R
0.8 1 1.2 1.4 1.6 1.8 2 2.2
using pp interpolation using pp PYTHIA
Preliminary ATLAS
=25 nb-1
p+Pb Lint
=5.02 TeV sNN
-2<y*<1.5 0-90%
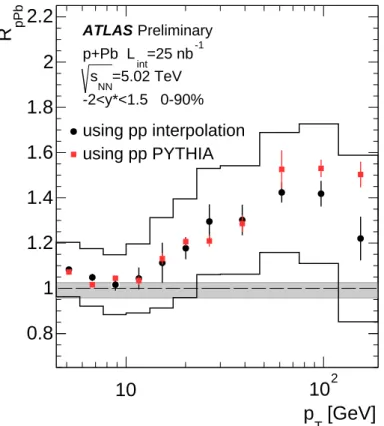
Figure 9: The R
pPbas a function of p
Tmeasured for the −2 < y
?< 1.5 rapidity range for the 0–
90% centrality class (black circles) compared to the R
pPbwhich uses PYTHIA generated cross section
instead of pp interpolation as a baseline (red squares). Vertical bars indicate the statistical uncertainty
of the measurement. Systematic uncertainties are plotted with step lines encompassing each point, the
systematic uncertainty of hT
Pbi is not included in the bands and shown with the gray-shaded band at
unity.
[GeV]
p
T10 10
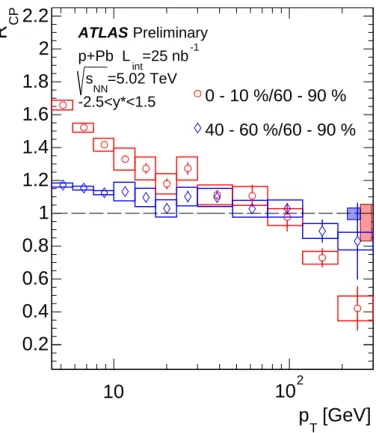
2CP
R
0.2 0.4 0.6 0.8 1 1.2 1.4 1.6 1.8 2 2.2
0 - 10 %/60 - 90 % 40 - 60 %/60 - 90 %
PreliminaryATLAS
=25 nb-1
p+Pb Lint
=5.02 TeV sNN
-2.5<y*<1.5