ATLAS-CONF-2016-026 02June2016
ATLAS NOTE
ATLAS-CONF-2016-026
May 22, 2016
Measurements of long-range azimuthal anisotropies and associated Fourier coe ffi cients in pp collisions at √
s = 5.02 and 13 TeV and p + Pb collisions at √
s
NN= 5.02 TeV with the ATLAS detector
The ATLAS Collaboration
Abstract
Results are presented from ATLAS measurements of two-particle correlations in
√s=
5.02 and 13 TeV
ppcollisions and in
√sNN=
5.02 TeV
p+Pb collisions at the LHC. The correla-tion functions are measured as a function of relative azimuthal angle,
∆φ, and pseudorapidity,∆η, using charged particles detected within the pseudorapidity interval|η|<2.5. Azimuthal
modulation in the long-range component of the correlation function, with
|∆η|>2, is studiedusing a template fitting procedure to remove a “back-to-back” contribution to the correla- tion function that primarily arises from hard-scattering processes. In addition to the elliptic, cos (2∆
φ), modulation observed in a previous measurement, the ppcorrelation functions exhibit significant cos (3∆
φ) and cos (4∆φ) modulation. The Fourier coefficients,vn,n, asso- ciated with the cos (n
∆φ) modulation of the correlation functions forn =2–4 are measured as a function of charged-particle multiplicity,
Nchrec, and charged particle transverse momen- tum,
pT. The Fourier coefficients are observed to be compatible with cos (nφ) modulation of per-event single-particle azimuthal angle distributions. The single particle Fourier coef- ficients,
vn, are measured as a function of charged particle multiplicity,
Nchrec, and charged particle transverse momentum,
pTfor
n=2–4.
c
2016 CERN for the benefit of the ATLAS Collaboration.
Reproduction of this article or parts of it is allowed as specified in the CC-BY-3.0 license.
1 Introduction
Observations of azimuthal anisotropies in the angular distributions of particles produced in proton–lead (p
+Pb) collisions at the LHC [1–5] and in deuteron–gold (d
+Au) [6–8] and
3He
+Au [9] collisions at RHIC have garnered much interest due to the remarkable similarities between the phenomena observed in those colliding systems and the effects of collective expansion seen in the Pb+Pb and Au+Au collisions [3, 10–13].
1The most intriguing feature of the azimuthal anisotropies is the “ridge” – an enhancement in the production of particles with small azimuthal-angle (φ) separation that extends over a large range of pseudorapidity (η) separation [1, 2, 14, 15]. In Pb+Pb [3, 10–13] and
p+Pb [1–3] collisions, the ridge isunderstood to result from sinusoidal modulation of the single-particle azimuthal angle distributions, and the characteristics of the modulation, for example the
pTdependence [16], are remarkably similar in the two systems [4].
While the modulation of the azimuthal angle distributions in Pb
+Pb collisions is understood to result from geometry of the initial state and the imprinting of that geometry on the angular distributions of the particles by the collective expansion (see e.g. [17–19] and references therein), there is, as yet, no consensus that the modulation observed in
p+Pb collisions results from the same mechanism. Indeed, an alternative explanation for the modulation using perturbative QCD and assuming saturated parton distributions in the lead nucleus is capable of reproducing many features of the
p+Pb data [20–29].Nonetheless, because of the many similarities between the
p+Pb and Pb
+Pb observations, extensive theoretical and experimental effort has been devoted to addressing the question of whether the strong- coupling physics understood to be responsible for the collective dynamics in A+A collisions may persist in smaller systems [30–40].
A recent study by the ATLAS Collaboration of two-particle angular correlations in proton–proton (pp) collisions at center-of-mass energies of
√s =
13 and 2.76 TeV obtained results consistent with the presence of an elliptic or cos (2φ) modulation of the per-event single particle azimuthal angle distribu- tions [41]. This result suggests that the ridge previously observed in
√s =
7 TeV
ppcollisions [14]
results from modulation of the single-particle azimuthal angle distributions similar to that seen in Pb
+Pb and
p+Pb collisions. Indeed, the
pTdependence of the modulation was similar to that observed in the other systems. Surprisingly, the amplitude of the modulation relative to the average differential particle yield,
hdn/dφi, was observed to be constant, within uncertainties, as a function of the charged particlemultiplicity of the
ppevents and to be consistent between the two energies, suggesting that the modula- tion is an intrinsic feature of high-energy
ppcollisions. These results provide further urgency to address the question of whether strong-coupling and collective dynamics play a significant role in small systems including the smallest systems accessible at collider energies –
ppcollisions. Since the elliptic modula- tion observed in the
ppdata is qualitatively similar to that seen in
p+Pb collisions, a direct, quantitativecomparison of
ppand
p+Pb measurements is necessary for evaluating whether the phenomena are re-lated.
The modulation of the single-particle azimuthal angle distributions in A+A,
p/d+A, and, most recently, ppcollisions is typically characterized using a set of Fourier coe
fficients,
vn, that describe the relative am- plitudes of the sinusoidal components of the single-particle distributions. More explicitly, the azimuthal
1However, Ref. [8] argues that the observed correlations may be due to poorly understood hard-scattering contributions.
angle distributions of the particles are parameterized according to:
dN dφ
=*
dN dφ
+
1
+Xn
2v
ncos
n
(φ
−Ψn)
,
(1)
where the average in the equation indicates an average over azimuthal angle. Here,
Ψnrepresents one of the
nangles at which the
nth-order harmonic is maximum; it is frequently referred to as the event planeangle for the
nth harmonic. In Pb+Pb collisions,
n=2 modulation is understood to primarily result from an elliptic anisotropy of the initial state for collisions with non-zero impact parameter; that anisotropy is subsequently imprinted onto the angular distributions of the produced particles by the collective evolution of the medium producing an elliptic modulation of the produced particle azimuthal angle distributions in each event [17, 42, 43]. The higher (n
>2) harmonics are understood to result from position-dependent fluctuations in the initial-state energy density which produce higher-order spatial eccentricities that sim- ilarly get converted into sinusoidal modulation of the single-particle dN/dφ distribution by the collective dynamics [44–51]. Significant
vnvalues have been observed in Pb
+Pb (p
+Pb) collisions up to
n=6 [13]
(n
=5 [4]). An important, outstanding question is whether
n>2 modulation is present in
ppcollisions.
The
vncoe
fficients can be measured using two-particle angular correlation functions, which, when eval- uated as a function of
∆φ ≡ φb−φa, where
aand
brepresent the two particles used to construct the correlation function, have an expansion similar to that in Eq. (1):
dN d∆
φ =*
dN
paird∆
φ+
1
+Xn
2v
n,ncos (n
∆φ)
.
(2)
If the modulation of the two-particle correlation function arises solely from the modulation of the single- particle distributions, then,
vn,n = v2n. Often, the two-particle correlations are measured using di
fferent transverse momentum (p
T) ranges for particles
aand
b. Since the modulation is observed to vary with pT, then
vn,n
(p
aT,pbT)
=vn(p
aT)v
n(
pbT), (3) if the modulation of the correlation function results solely from single-particle modulation.
2This “fac- torization” hypothesis can be tested experimentally by measuring
vn,n(
paT,pbT) for different ranges of
pbTand estimating
vn(p
aT) using
vn
(
paT)
=vn,n(
paT,pbT)/
qvn,n
(
pbT,pbT). (4)
and evaluating whether
vn(p
aT) depends on the choice of
pbT.
In addition to the sinusoidal modulation, the two-particle correlation functions include contributions from hard-scattering processes that produce a jet peak centered at
∆φ = ∆η =0 and a dijet enhancement at
∆φ = π
that extends over a wide range of
∆η. The jet peak can be avoided by studying the long-rangepart of the correlation function, which is typically chosen to be
|∆η|>2. Because the dijet contribution to the two-particle correlation function is not localized in
∆η, that contribution has to be subtracted from themeasured correlation function, typically using the correlation function measured in low-multiplicity (“pe- ripheral”) events. Di
fferent peripheral subtraction methods have been applied for the
p+Pb measurements
2See [52,53] for analyses of the breakdown of factorization.
in the literature [2, 4]; all of them relied on the “zero yield at minimum” (ZYAM) [2, 4] hypothesis to sub- tract an assumed flat combinatoric component from the peripheral reference correlation function. These methods were found to be inadequate for
ppcollisions where the amplitude of the dijet enhancement at
∆φ=π
is much larger than the (absolute) amplitude of the sinusoidal modulation. For the measurements in Ref. [41], a template-fitting method, described below, was developed that was better suited for extract- ing a small sinusoidal modulation from the data. Application of the template fitting method to the
ppdata provided an excellent description of the measured correlation functions. It also indicated substantial bias resulting from the application of the ZYAM-subtraction procedure to the peripheral reference correlation function due to the non-zero
v2,2in low-multiplicity events. As a result, the measurements presented in Ref. [41] were obtained without using ZYAM subtraction. However, the previously published
p+Pb data [4] may be susceptible to an unknown bias due to the use of the ZYAM method. Thus, a re-analysis of the
p+Pb data is both warranted and helpful in making comparisons between
ppand
p+Pb data.
To address the points raised above, this note extends previous measurements of two-particle correlations in
ppcollisions at
√s =
13 TeV using additional data acquired by ATLAS subsequent to the mea- surements in Ref. [41] and provides new measurements of such correlations in
ppcollisions at
√s =
5.02 TeV. It also presents a re-analysis of two-particle correlations in 5.02 TeV
p+Pb collisions andpresents a direct comparison between the
ppand
p+Pb data at the same per-nucleon center-of-mass en-ergy as well as a comparison between the
ppdata at the two energies. Two-particle Fourier coe
fficients
vn,nare measured, where statistical precision allows, for
n =2, 3, and 4 as a function of charged particle multiplicity and transverse energy. Measurements are performed for different
paTand
pbTintervals and the factorization of the resulting
vn,nvalues is tested.
This note is organized as follows. Section 2 gives a brief overview of the ATLAS detector sub-systems and triggers used in this analysis. Section 3 describes the data sets, and the offline selection criteria used to select events and reconstructed charged-particle tracks. The variables used to characterize the “event- activity” of the
ppand
p+Pb collisions are also described. Section4 gives details of the two-particle correlation method. Section 5 describes the template fitting of the two-particle correlations, which was originally developed in Ref. [41]. The template fits are used to extract the Fourier harmonics,
vn,n(Eq. (2)), of the long-range correlation, and the factorization of the
vn,ninto single-particle harmonics
vn(Eq. (3)) is studied. The stability of the
vn,nto the relative pseudorapidity separation between, the charged-particle pairs is also checked. Section 6 describes the systematic uncertainties associated with the measured
vn,n. In Sec. 7 the main results of the analysis, which are the
pTand event activity dependence of the single particle harmonics,
vn, are presented. Detailed comparisons of the
vnbetween the three data sets: 13 TeV
pp, 5.02 TeVpp, and 5.02 TeV p+Pb are also shown. Section 8 gives a summary of the main results and observations.
2 Experiment
2.1 ATLAS detector
The measurements presented in this note have been performed using the ATLAS [54] inner detector (ID), minimum-bias trigger scintillators (MBTS), calorimeter, zero-degree calorimeters (ZDC), and the trigger and data acquisition systems. The ID detects charged particles within
|η|<2.53using a combination of
3ATLAS uses a right-handed coordinate system with its origin at the nominal interaction point (IP) in the center of the detector and thez-axis along the beam pipe. The x-axis points from the IP to the center of the LHC ring, and they-axis points
pp
13 TeV
pp5 TeV
p+PbL1 HLT L1 HLT L1 HLT
MBTS
NtrkHLT≥60 ETL1>5 GeV
NtrkHLT≥60 EL1,FCalT >10 GeV
NtrkHLT≥100 EL1T >10 GeV NtrkHLT≥90 ETL1>10 GeV NtrkHLT≥90 EL1,FCalT >10 GeV NtrkHLT≥130 ETL1>20 GeV NtrkHLT≥90
EL1,FCalT >50 GeV NtrkHLT≥150
EL1,FCalT >50 GeV
NtrkHLT≥180 EL1,FCalT >65 GeV NtrkHLT≥200 EL1,FCalT >65 GeV NtrkHLT≥225Table 1: The list of L1 andNtrkHLTrequirements for theppandp+Pb HMT triggers used in this analysis. For thepp HMT triggers, the L1 requirement is on theETover the entire ATLAS calorimetry (EL1T ) or hits in the MBTS. For thep+Pb HMT triggers, the L1 requirement is on theETrestricted to the FCal (EL1,FCalT ).
silicon pixel detectors including the “Insertable B–layer” (IBL) [55, 56] that was installed between Run 1 and Run 2, silicon micro-strip detectors (SCT), and a straw-tube transition radiation tracker (TRT), all immersed in a 2 T axial magnetic field [57]. The MBTS system detects charged particles over 2.07
<|η| <
3.86 using two hodoscopes positioned at
z = ±3.6 m. These hodoscopes were rebuilt betweenRun 1 and Run 2. The ATLAS calorimeter system consists of a liquid argon (LAr) electromagnetic (EM) calorimeter covering
|η| <3.2, a steel–scintillator sampling hadronic calorimeter covering
|η| <1.7, a LAr hadronic calorimeter covering 1.5
< |η| <3.2, and two LAr electromagnetic and hadronic forward calorimeters (FCal) covering 3.2
< |η| <4.9. The ZDCs, situated
≈140 m from the nominal IP, detectneutral particles, mostly neutrons and photons, with
|η|>8.3. The ZDCs use tungsten plates as absorbers, and quartz rods sandwiched between the tungsten plates as the active medium.
2.2 Trigger
The ATLAS trigger system [58] consists of a Level-1 (L1) trigger implemented using a combination of dedicated electronics and programmable logic, and a software-based high-level trigger (HLT). Due to the large interaction rates, only a small fraction of minimum-bias events could be recorded for all three data sets. The configuration of the minimum-bias (MB) triggers varied between the di
fferent data sets.
Minimum-bias
p+Pb events were selected by requiring a hit in at least one MBTS counter on each side(MBTS_1_1) or a signal in the ZDC on the Pb-fragmentation side with the trigger threshold set just below the peak corresponding to a single neutron. In the 13 TeV
ppdata, MB events were selected by a L1 trigger that requires a signal in at least one MBTS counter (MBTS_1). In the 5.02 TeV
ppdata, MB events were selected using the MBTS_1, MBTS_1_1, and a third trigger that required a minimum of one reconstructed track at the HLT. In order to enhance the number of events having high charged-particle multiplicity, several high-multiplicity (HMT) triggers were implemented. These apply a L1 requirement on either the transverse energy (E
T) in the calorimeters or on the number of hits in the MBTS, and an HLT requirement on the multiplicity of HLT-reconstructed charged particle tracks. That multiplicity,
NtrkHLT, is evaluated for tracks having
pT>0.4 GeV that are associated with the reconstructed vertex with the highest multiplicity in the event. This last requirement suppresses the selection of events with multiple collisions (pileup), as long as the collision vertices are not so close as to be indistinguishable. The HMT trigger configurations used in this analysis are summarized in Table 1.
upward. Cylindrical coordinates (r, φ) are used in the transverse plane,φbeing the azimuthal angle around the beam pipe.
The pseudorapidity is defined in terms of the polar angleθasη=−ln tan(θ/2).
3 Data sets
The
√s=
13 and 5.02 TeV
ppdata were collected during Run 2 of the LHC. The 13 TeV
ppdata were recorded over two periods: a set of low-luminosity runs in June 2015 (used in Ref. [41]) for which the collision rate per crossing,
µ, varied between∼0.002 and
∼0.04, and a set of intermediate-luminosity runs in August 2015 where the
µvaried between 0.05 and 0.6. The 5.02 TeV
ppdata were recorded during November 2015 in a set of low-luminosity runs with
µ∼1.5. Thep+Pb data were recorded in Run 1 dur- ing
p+Pb operation of the LHC in January 2013. During that period, the LHC was configured with a 4 TeVproton beam and a 1.57 TeV per-nucleon Pb beam that together produced collisions at
√sNN=5.02 TeV.
The higher energy of the proton beam produces a net rapidity shift of the nucleon–nucleon center-of-mass frame by 0.47 units in the proton-going direction, relative to the ATLAS rest frame. The
p+Pb data were collected in two periods between which the directions of the proton and lead beams were reversed. The integrated luminosities used in this note are as follows: 75 nb
−1for the
√s=
13 TeV
ppdata, 28 pb
−1for the
√s=
5.02 TeV
ppand 28 nb
−1for the
√sNN=
5.02 TeV
p+Pb data.
3.1 Event and track selection
In the o
ffline analysis, additional requirements are imposed on the events selected by the MB and HMT triggers. The events are required to have a reconstructed vertex with the
z-position of the vertex restrictedto
±150 mm. In the p+Pb data, non-collision backgrounds are suppressed by requiring at least one hit ina MBTS counter on each side of the interaction point, and the difference between times measured on the two sides of the MBTS to be less than 10 ns. In the 2013
p+Pb run, the luminosity conditions provided by the LHC result in an average probability of 3% for pileup events. The pileup events are suppressed by rejecting events containing more than one good reconstructed vertex. The remaining pileup events are further suppressed using the number of detected neutrons,
Nn, measured in the ZDC on the Pb- fragmentation side. The distribution of
Nnin events with pileup is broader than that for the events without pileup. Hence, rejecting events at the high tail-end of the ZDC signal distribution further suppresses the pileup, while retaining more than 98% of the events without pileup. In the
ppdata, pileup is suppressed by only using tracks associated with the vertex having the largest
Pp2T
, where the sum is over all tracks associated with the vertex.
In the
p+Pb analysis, charged-particle tracks are reconstructed in the ID using an algorithm optimized for
ppminimum-bias measurements [59]. The tracks are required to have
pT >0.4 GeV and|η|<2.5, atleast one pixel hit, and the additional requirement of a hit in the first pixel layer when one is expected,
4and at least six SCT hits. In addition, the transverse (d
0) and longitudinal (z
0sin(θ)) impact parameters of the track relative to the vertex are required to be less than 1.5 mm. They are also required to satisfy
|d0/σd0|<
3 and
|z0sin(θ)/σ
z|<3, where
σd0and
σzare uncertainties on
d0and
z0sin(θ) respectively.
In the
ppanalysis, charged-particle tracks and primary vertices are reconstructed in the ID using an algorithm similar to that used in Run 1, but substantially modified to improve performance [60, 61]. The reconstructed tracks are required to pass the following selection criteria:
pT>0.4 GeV and
|η|<2.5; at least one pixel hit, with the additional requirement of a hit in the IBL if one is expected (if a hit is not expected in the IBL, a hit in the next pixel layer is required if such a hit is expected); a minimum of six hits in the SCT;
|d0BL|<1.5 mm, where the transverse impact parameter of the track,
d0BL, is calculated with respect to the average beam position; and
|∆z0sin(θ)|
<1.5 mm, where
z0is the longitudinal impact parameter, and
4A hit is expected if the extrapolated track crosses an active region of a pixel module that has not been disabled.
the di
fference is between the position of the track where
dBL0is measured and the primary vertex. Finally, in order to remove tracks with mismeasured
pTdue to interactions with the material or other effects, the track-fit
χ2probability is required to be larger than 0.01 for tracks having
pT >10 GeV.
The efficiencies, (
pT, η), of track reconstruction for the above track selection cuts are obtained usingMonte Carlo generated events that are passed through a GEANT4 [62] simulation [63] of the ATLAS detector response and reconstructed using the algorithms applied to the data. For determining the
p+Pb efficiencies, the events are generated with version 1.38b of the HIJING event generator [64] with a center- of-mass boost matching the beam conditions. For determining the
ppefficiencies, non-diffractive 13 TeV
ppevents obtained from the P
ythia8 [65] event generator (A2 tune [66], MSTW2008LO PDFs [67]) are used. Both the
ppand
p+Pb efficiencies increase by∼3% from 0.4–0.6 GeV and vary only weakly with
pTfor
pT>0.6 GeV. In the p+Pb case, the efficiency for pT>0.6 GeV ranges from 82% atη=0 to 70%at
|η|=2 and 60% at
|η|>2.4. The e
fficiency is also found to vary by less than 2% over the multiplicity range used in the analysis. In the
ppcase, the efficiency for
pT>0.6 GeV ranges from 88–90% atη=0 to77–80% at
|η|=1.5 and 68–73% for|η|>2.0.3.2 Event-activity classes
As with previous ATLAS long-range correlation analyses in
p+Pb and
pp[2, 4, 41] collisions, the event activity is quantified by
Nchrec: the total number of reconstructed charged-particle tracks with
pT>0.4 GeV,passing the track selections discussed in Sec 3.1. For
p+Pb collisions there is a direct correlation between
Nchrecand the number of participating nucleons in the Pb nucleus: events with larger
Nchrecvalues have, on average, a larger number of participating nucleons in the Pb nucleus and a smaller impact parameter. In this case, the concept of centrality used in A
+A collisions is applicable, and in this note the terms “central”
and “peripheral” are used to refer to events with large and small values of
Nchrecrespectively. For
ppcollisions there may not be a correlation between
Nchrecand impact parameter. However, for convenience, but keeping this caveat in mind, the
ppevents with large and small
Nchrecare also termed as “central” and
“peripheral” respectively.
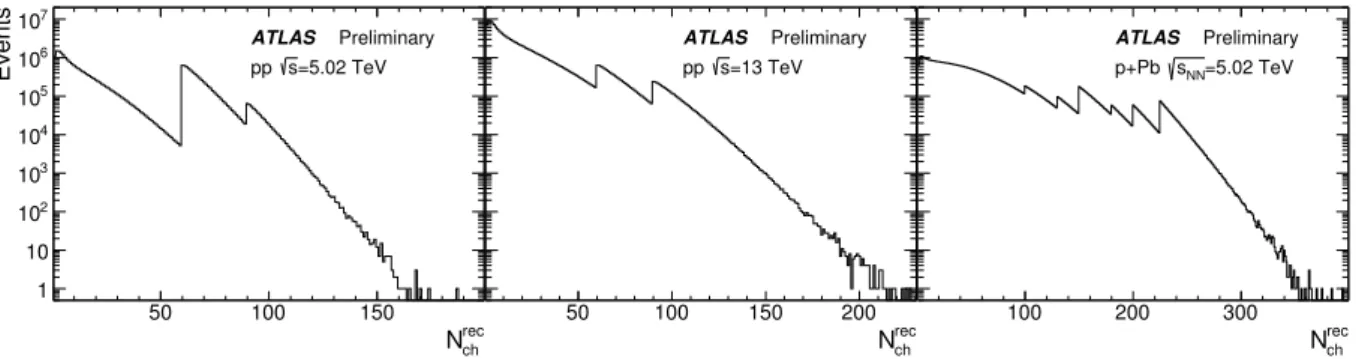
Figure 1 shows the
Nchrecdistributions for the three data sets used in this note. The discontinuities in the distributions result from the di
fferent HMT triggers, for which an o
ffline requirement of
Nchrec>NtrkHLTis applied. This requirement ensures that the HMT triggers are used only where the HLT trigger e
fficiency is close to being fully efficient.
The
ppevent-activity can also be quantified using the total transverse energy deposited in the FCal (E
FCalT). This quantity has been used to determine the centrality in all ATLAS heavy-ion analyses. Using the
ETFCalto characterize the event-activity has the advantage that independent sets of particles are used to determine the event-activity and to measure the long-range correlations. Similarly in the
p+Pb case, the event-activity can be characterized by the sum of transverse energy measured on the Pb-fragmentation side of the FCal (E
TFCal,Pb) [2, 4]. Results presented in this note use both
Nchrecand the
EFCalT(or
EFCal,PbT) to quantify the event-activity.
4 Two-particle correlation analysis
The study of two-particle correlations in this note follows previous ATLAS measurements in Pb
+Pb [13,
68, 69],
p+Pb [2,4] and
pp[41] collisions. For a given event class, the two-particle correlations are
rec
Nch
50 100 150
Events
1 10 102
103
104
105
106
107
ATLAS Preliminary
=5.02 TeV s pp
rec
Nch
50 100 150 200
Events
1 10 102
103
104
105
106
107
ATLAS Preliminary
=13 TeV s pp
rec
Nch
100 200 300
Events
1 10 102
103
104
105
106
107
ATLAS Preliminary
=5.02 TeV sNN
p+Pb
Figure 1: Distributions of the multiplicity, Nchrec, of reconstructed charged particles having pT >0.4 GeV in the 5.02 TeVpp(left), 13 TeVpp, and 5.02 TeV p+Pb (right) data used in this analysis. The discontinuities in the distributions correspond to different high-multiplicity trigger thresholds.
measured as a function of the relative azimuthal angle
∆φ ≡ φa−φband pseudorapidity
∆η ≡ ηa−ηbseparation. The labels
aand
bdenote the two particles in the pair, which may be selected from different
pTintervals. The particles
aand
bare conventionally referred to as the “trigger” and “associated” particles, respectively. The correlation function is defined as:
C(∆η,∆φ)= S
(
∆φ,∆η)B(∆φ,∆η) ,
(5)
where
Sand
Brepresent pair distributions constructed from the same event and from “mixed events” [70], respectively. The same-event distribution,
S, is constructed using all particle pairs that can be formed in each event from tracks that have passed the selections described in Sec. 3.1. The
Scontains both physical correlations between particle pairs, as well as correlations arising from detector acceptance e
ffects. The mixed-event distribution,
B(∆φ,∆η) is similarly constructed by choosing the two particles in the pairfrom different events. The
Bdoes not contain physical correlations, but is similarly affected by detector acceptance e
ffects as
S. In taking the ratio,
S/Bin Eq. (5), the detector acceptance e
ffects largely cancel, and the resulting
C(∆η,∆φ) contains physical correlations only. The pair of events used in the mixingare required to have similar
Nchrec(|
∆Nchrec|<10) and similarzvtx(|
∆zvtx|<10 mm), so that acceptance effectsin
S(
∆φ,∆η) are properly reflected in and compensated by corresponding variations in B(∆φ,∆η). Tocorrect
S(
∆φ,∆η) andB(∆φ,∆η) for the individualφ-averaged inefficiencies of particles
aand
b, the pairsare weighted by the inverse product of their tracking efficiencies 1/(
ab). Statistical uncertainties are calculated on
C(∆η,∆φ) using standard error-propagation procedures assuming no correlation betweenSand
B, and with the statistical variance onSand
Bin each
∆ηand
∆φbin taken to be
P1/(
ab)
2where the sum runs over all of the pairs included in the bin. Typically, the two-particle correlations are used only to study the shape of the correlations in
∆φ, and are conveniently normalized. In this note, the normalizationof
C(∆η,∆φ) is chosen such that the∆φ-averaged value ofC(∆η,∆φ) is unity for|∆η|>2.
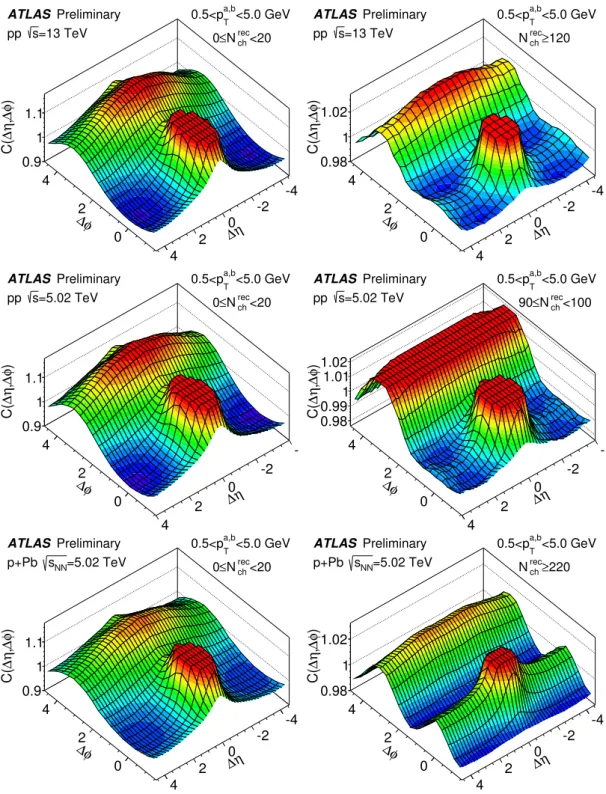
Examples of correlation functions are shown in Fig. 2 for 0.5<
pa,bT <5.0 GeV and for two differentNchrecranges for each of the three data sets: 13 TeV
pp(top), 5.02 TeV
pp(middle), and 5.02 TeV
p+Pb (bottom). The left panels show results for 0≤N
chrec<20 while the right panels show representative high-multiplicity ranges of
Nchrec≥120 for the 13 TeV ppdata, 90≤N
chrec<100 for the 5.02 TeV ppdata and
Nchrec≥220 for the 5.02 TeVp+Pb data. The correlation functions are plotted over the range
−π/2<∆φ<3π/2;the periodicity of the measurement requires that
C(∆η,3π/2)
=C(∆η,−π/2). The low-multiplicity corre-lation functions exhibit features that are understood to result primarily from hard-scattering processes: a
peak centered at
∆η=∆φ=0 that arises primarily from jets and an enhancement centered at
∆φ=πand ex-
tending over the full
∆ηrange that results from dijets. These features also dominate the high-multiplicity
correlation functions. Additionally, in the high-multiplicity correlation functions, each of the three sys- tems exhibit a ridge – an enhancement centered at
∆φ=0 that extends over the entire measured∆ηrange.
One-dimensional correlation functions,
C(∆φ), are obtained by integrating the numerator and denomina-tor of Eq. (5) over 2<|∆
η|<5 prior to taking the ratio:C(∆φ)= R5
2
d|
∆η|S(∆
φ,|∆η|) R52
d|
∆η| B(∆φ,|∆η|) ≡ S(∆
φ)B(∆φ).
(6)
This
|∆η |range is chosen to focus on the long-range features of the correlation functions. From the one-dimensional correlation functions, “per-trigger-particle yields,”
Y(∆
φ) are calculated [2,4, 70]:
Y
(∆
φ)=
R B(∆φ)d∆φ NaR
d
∆φ
C(∆φ),
(7)
where
Nadenotes the total number of trigger-particles, corrected to account for the tracking efficiency.
The
Y(
∆φ) is identical in shape toC(∆φ), but has a physically relevant normalization: it represents theaverage number of associated particles per trigger-particle in a given
∆φinterval. This allows operations, such as subtraction of the
Y(∆φ) in an event-activity class from theY(∆φ) in another, which have beenused in studying the
p+Pb ridge [2, 4].
5 Template fitting
In order to separate the ridge from other sources of angular correlations, such as dijets, ATLAS devel- oped a template fitting procedure in Ref. [41]. In this procedure, the measured
Y(∆φ) distributions areassumed to result from a superposition of a “peripheral”
Y(∆φ) distribution,Yperiph(∆
φ), scaled up by amultiplicative factor and a constant modulated by cos(n
∆φ) forn≥2. The resulting template fit function, Ytempl(∆
φ)=F Yperiph(∆
φ)+Yridge(∆
φ),(8) where
Yridge
(
∆φ)=G
1
+∞
X
n=2
2v
n,ncos (n
∆φ)
,
(9)
has free parameters
Fand
vn,n. The coe
fficient,
G, which represents the magnitude of the combinatoriccomponent of
Yridge(∆
φ), is fixed by requiring thatRπ0
d∆
φYtempl =Rπ0
d∆
φY. In this note, when studyingthe
Nchrecdependence of the long-range correlation, the 0≤N
chrec<20 multiplicity interval is used to producethe
Yperiph(
∆φ). When studying theETFCal(E
TFCal,Pb) dependence, the
ETFCal<10 GeV (E
FCal,PbT <10 GeV) interval is used to produce the
Yperiph(
∆φ).The template fitting procedure is similar to the peripheral subtraction procedure used in previous ATLAS
p+Pb ridge analyses [4]. In those analyses, the scale factor for the peripheral reference, analogous to
Fin Eq. (8), was determined by matching the near-side jet peaks between the peripheral and central samples. A more important difference, however, lies in the treatment of the peripheral bin. In the earlier analyses, a ZYAM procedure was performed on the peripheral reference, and only the modulated part of the
Yperiph(∆
φ),Yperiph(∆
φ)−Yperiph(0), was used in the peripheral subtraction.
5The ZYAM procedure
5The minimum ofYperiph(∆φ) is at∆φ=0 and is thus equal toYperiph(0), which the ZYAM procedure subtracts out.
∆φ 0 2 4
∆η
-4 -2 0 2 4
)φ∆,η∆C(
0.9 1 1.1
ATLAS Preliminary
=13 TeV s pp
<5.0 GeV
a,b
0.5<pT
<20
rec
N ch
0≤
∆φ 0 2 4
∆η
-4 -2 0 2 4
)φ∆,η∆C(
0.98 1 1.02
ATLAS Preliminary
=13 TeV s pp
<5.0 GeV
a,b
0.5<pT
≥120
rec
N ch
∆φ 0 2 4
∆η
-4 -2 0 2 4
)φ∆,η∆C(
0.9 1 1.1
ATLAS Preliminary
=5.02 TeV s
pp
<5.0 GeV
a,b
0.5<pT
<20
rec
N ch
0≤
∆φ 0 2 4
∆η
-4 -2 0 2 4
)φ∆,η∆C(0.98
0.99 1 1.01 1.02
ATLAS Preliminary
=5.02 TeV s
pp
<5.0 GeV
a,b
0.5<pT
<100
rec
N ch
90≤
∆φ 0 2 4
∆η
-4 -2 0 2 4
)φ∆,η∆C(
0.9 1 1.1
ATLAS Preliminary
=5.02 TeV sNN
p+Pb
<5.0 GeV
a,b
0.5<pT
<20
rec
N ch
0≤
∆φ 0 2 4
∆η
-4 -2 0 2 4
)φ∆,η∆C(
0.98 1 1.02
ATLAS Preliminary
=5.02 TeV sNN
p+Pb
<5.0 GeV
a,b
0.5<pT
≥220
rec
N ch
Figure 2: Two-particle correlation functions,C(∆η,∆φ), in 13 TeV ppcollisions (top panels), 5.02 TeV ppcol- lisions (middle panels) and in 5.02 TeV p+Pb collisions (bottom panels). The left panels correspond to a lower- multiplicity range of 0≤Nchrec<20. The right panels correspond to higher multiplicity ranges ofNchrec≥120 for 13 TeV pp, 90≤Nchrec<100 for the 5.02 TeV ppandNchrec≥220 for the 5.02 TeVp+Pb. The plots are for charged particles having 0.5<pa,bT <5.0 GeV. The distributions have been truncated to suppress the peak at∆η=∆φ=0 and are plotted over|∆η|<4.6 (|∆η|<4.0 for middle row) to avoid statistical fluctuations at larger|∆η|. For the middle-right panel, the peak at∆φ=πhas also been truncated.
φ
∆
-1 0 1 2 3 4
)φ∆Y(
5.55 5.6 5.65 5.7 5.75 5.8
) φ Y(∆
) φ (∆
periph
G + FY ) φ (∆
templ
Y
periph(0) G + FY
periph(0)
ridge +FY Y
ATLASPreliminary
=13 TeV s pp
≥90
rec
N ch
<5.0 GeV
a,b
0.5<pT
|<5.0 η 2.0<|∆
φ
∆
-1 0 1 2 3 4
3 10×)φ∆(templ ) - Yφ∆Y(
-3 -2 -1 0 1 2 3 4 5
n=3 component n=4 component Total ATLASPreliminary
=13 TeV s pp
≥90
rec
N ch
<5.0 GeV
a,b
0.5<pT
|<5.0 η 2.0<|∆
Figure 3: Left Panel: template fit to the the per-trigger particle yields,Y(∆φ), in 13 TeVppcollisions for charged particle pairs with 0.5<pa,bT <5 GeV and 2<|∆η|<5. This plot corresponds to the Nchrec≥90 multiplicity range. The template fitting includes only the 2ndorder harmonic,v2,2. Right Panel: The difference between theY(∆φ) and the template fit, showing the presence ofv3,3andv4,4components. The vertical error bars indicate statistical uncertain- ties.
makes several assumptions, the most relevant of which for the present analysis is that there is no long- range correlation in the peripheral bin. As pointed out in Ref. [41], neglecting the non-zero modulation present in
Yperiph(∆
φ) significantly biases the measuredvn,nvalues. Results from an alternative version of the template fitting, where a ZYAM procedure is performed on the peripheral reference, by using
Yperiph(
∆φ)−Yperiph(0) in place of
Yperiph(
∆φ) in Eq. (8), are also presented in this note. This ZYAM-based template fit is similar to the
p+Pb peripheral subtraction procedure. These results are included mainly to compare with previous measurements and to demonstrate the improvements obtained using the present method.
In Ref. [41] the template fitting procedure only included the second-order harmonic
v2,2, but was able to well reproduce the
Nchrecdependent evolution of the
Y(∆
φ) on both the near and away sides. The left panelof Fig. 3 shows such a template fit, in the 13 TeV
ppdata, that only includes
v2,2. The right panel shows the difference between the
Y(∆
φ) and theYtempl(∆
φ) demonstrating the presence of small (compared to v2,2), but significant residual
v3,3and
v4,4components. While it is possible that cos 3∆
φand cos 4∆
φcontributions could arise in the template fitting method due to small multiplicity-dependent changes in the shape of the dijet component of the correlation function, such effects would not produce the excess at
∆φ∼0 observed in the right-hand panel in Fig.
3. That excess and the fact that its magnitude is compatible with the remainder of the distribution indicates that there is real cos 3
∆φand cos 4
∆φmodulation in the two-particle correlation functions. Thus, in this note the
v2,2results in Ref. [41] have been extended to include
v3,3and
v4,4as well. A study of these higher order harmonics, including their
Nchrecand
pTdependence, and factorization (Eq. (4)) can help in better understanding the origin of the long-range correlations.
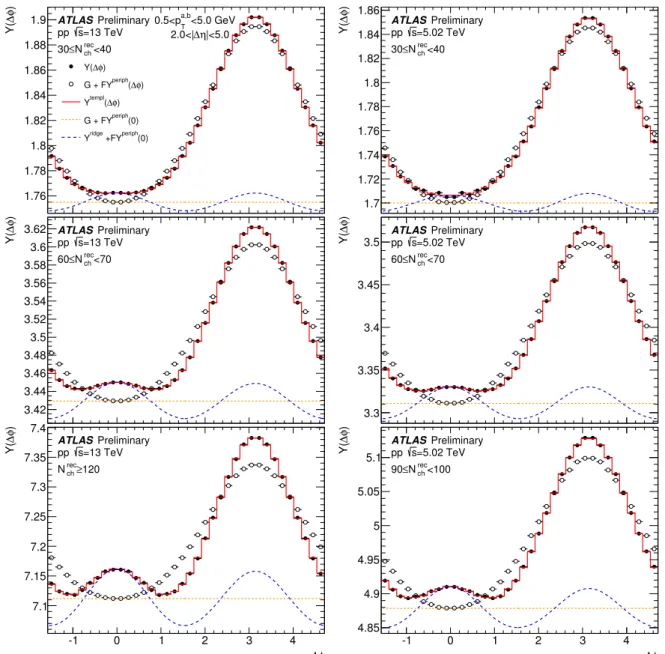
Figure 4 shows template fits to the 13 TeV (left panels) and 5.02 TeV
ppdata (right panels), for 0.5
<pa,bT <
5 GeV. From top to bottom, each panel represents a di
fferent
Nchrecrange. The template fits (Eq. (9))
include harmonics 2–4. Visually, a prominent ridge, i.e. a clear peak on the near-side, cannot be seen
in the top two rows, which correspond to low and intermediate
Nchrecintervals, respectively. However,
the template fits indicate the presence of a large modulated component of
Yridge(
∆φ) even in theseNchrecφ
∆
-1 0 1 2 3 4
)φ∆Y(
1.76 1.78 1.8 1.82 1.84 1.86 1.88 1.9
) φ
∆ Y(
φ) (∆
periph
G + FY ) φ
∆
templ( Y
periph(0) G + FY
periph(0)
ridge +FY Y
<40
rec
N ch
≤ 30
ATLASPreliminary
=13 TeV s pp
<5.0 GeV
a,b
0.5<pT
|<5.0 η 2.0<|∆
φ
∆
-1 0 1 2 3 4
)φ∆Y(
1.7 1.72 1.74 1.76 1.78 1.8 1.82 1.84 1.86
<40
rec
N ch
≤ 30
ATLASPreliminary
=5.02 TeV s pp
φ
∆
-1 0 1 2 3 4
)φ∆Y(
3.42 3.44 3.46 3.48 3.5 3.52 3.54 3.56 3.58 3.6 3.62
<70
rec
N ch
60≤
ATLASPreliminary
=13 TeV s pp
φ
∆
-1 0 1 2 3 4
)φ∆Y(
3.3 3.35 3.4 3.45 3.5
<70
rec
N ch
60≤
ATLASPreliminary
=5.02 TeV s pp
φ
∆
-1 0 1 2 3 4
)φ∆Y(
7.1 7.15 7.2 7.25 7.3 7.35 7.4
≥120
rec
N ch
ATLASPreliminary
=13 TeV s pp
φ
∆
-1 0 1 2 3 4
)φ∆Y(
4.85 4.9 4.95 5 5.05 5.1
<100
rec
N ch
90≤
ATLASPreliminary
=5.02 TeV s pp
Figure 4: Template fits to the per-trigger particle yieldsY(∆φ), in 13 TeV (left panels) and in 5.02 TeVppcollisions (right panels) for charged particle pairs with 0.5<pa,bT <5 GeV and 2<|∆η|<5. The template fitting includes 2nd, 3rd and 4thorder harmonics. From top to bottom, each panel represents a differentNrecch range. The solid points indicate the measuredY(∆φ), the open points and curves show different components of the template (see legend) that are shifted along they-axis, where necessary, for clarity.
intervals. Several prior
ppridge measurements rely on the ZYAM method [70, 71] to extract yields on the near-side [14, 15]. In these analyses, the yield of excess pairs in the ridge above the minimum of the
Y(∆φ)distribution is considered to be the strength of the ridge. Figure 4 shows that such a procedure would give zero yields in low and intermediate multiplicity collisions where the minimum of
Y(∆φ) occurs at∆φ∼0.In high multiplicity events, the ZYAM-based yields, while non-zero, are still underestimated.
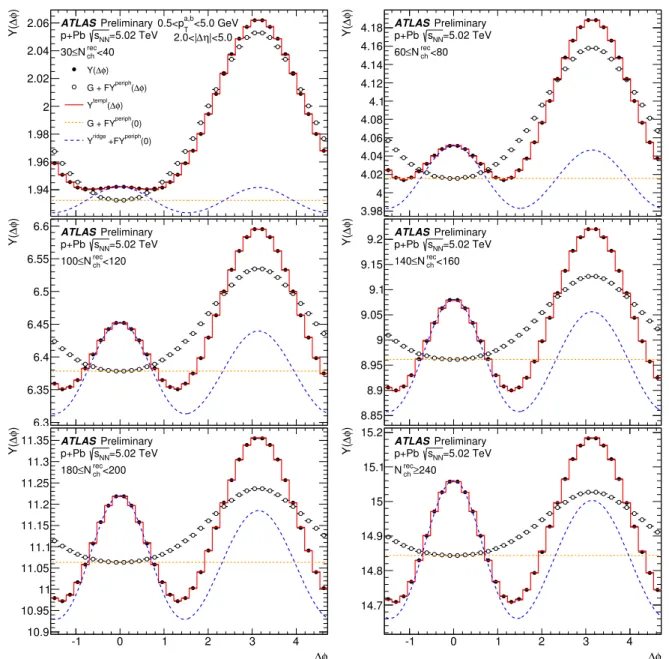
Figure 5 shows the template fits to the
p+Pb data in a format similar to Fig. 4. The template fits describe
the data well across the entire
Nchrecrange used in this note. Previous
p+Pb ridge analyses used a peripheral
φ
∆
-1 0 1 2 3 4
)φ∆Y(
1.94 1.96 1.98 2 2.02 2.04 2.06
φ) Y(∆
) φ
∆
periph( G + FY
φ) (∆
templ
Y
periph(0) G + FY
periph(0)
ridge +FY Y
<40
rec
N ch
30≤
ATLASPreliminary
=5.02 TeV sNN
p+Pb
<5.0 GeV
a,b
0.5<pT
|<5.0 η
∆ 2.0<|
φ
∆
-1 0 1 2 3 4
)φ∆Y(
3.98 4 4.02 4.04 4.06 4.08 4.1 4.12 4.14 4.16 4.18
<80
rec
N ch
60≤
ATLASPreliminary
=5.02 TeV sNN
p+Pb
φ
∆
-1 0 1 2 3 4
)φ∆Y(
6.3 6.35 6.4 6.45 6.5 6.55 6.6
<120
rec
N ch
≤ 100
ATLASPreliminary
=5.02 TeV sNN
p+Pb
φ
∆
-1 0 1 2 3 4
)φ∆Y(
8.85 8.9 8.95 9 9.05 9.1 9.15 9.2
<160
rec
N ch
≤ 140
ATLASPreliminary
=5.02 TeV sNN
p+Pb
φ
∆
-1 0 1 2 3 4
)φ∆Y(
10.9 10.95 11 11.05
11.1 11.15
11.2 11.25 11.3 11.35
<200
rec
N ch
≤ 180
ATLASPreliminary
=5.02 TeV sNN
p+Pb
φ
∆
-1 0 1 2 3 4
)φ∆Y(
14.7 14.8 14.9 15 15.1 15.2
240
rec≥ N ch
ATLASPreliminary
=5.02 TeV sNN
p+Pb
Figure 5: Template fits to the per-trigger particle yieldsY(∆φ) in 5.02 TeV p+Pb collisions for charged particle pairs with 0.5<pa,bT <5 GeV and 2<|∆η|<5. The template fitting includes 2nd, 3rd and 4th order harmonics. Each panel represents a differentNchrecrange. The solid points indicate the measuredY(∆φ), the open points and curves show different components of the template (see legend) that are shifted along the y-axis, where necessary, for presentation.
subtraction procedure to remove the jet component from the
Y(∆φ) [1]. That procedure is similar to theZYAM-based template fitting procedure, in that it assumes absence of any long-range correlations in the
peripheral events. In the next sections comparison between the
vn,nobtained from these two methods will
be shown.
5.1 Fourier coe ffi cients
Figure 6 shows the
vn,nobtained from the template fits in the 13 TeV
ppdata, as a function of
Nchrecand
ETFCal. The
vn,nfrom the ZYAM-based template fits as well as the coe
fficients obtained from a direct Fourier transform of the
Y(∆φ) are also shown for comparison. While the template-vn,nare the most physically meaningful quantities, the Fourier-v
n,nare also included to demonstrate how the template fitting removes the hard contribution. Similarly, the ZYAM-based template-v
n,nare also included, as the ZYAM based fitting is similar to the peripheral subtraction procedure used in prior
p+Pb analyses [2,4], and comparing with the ZYAM-based results illustrates the improvement brought about in the template fitting procedure.
The
v2,2values are nearly independent of
Nchrecthroughout the measured range. As concluded in Ref. [41], this implies that the long-range correlation is not unique to high-multiplicity events, but is in fact present even at very low multiplicities. In the
EFCalTdependence, however, the
v2,2shows a systematic decrease at low
ETFCal. Further, the asymptotic values of the template-v
2,2at large
Nchrecis also observed to be
∼10%larger than the asymptotic value at large
EFCalT. This might indicate that the
v2,2at a given rapidity is more correlated with the local multiplicity than the global multiplicity.
The removal of the hard contribution to the
v2,2in the template fitting can be seen by comparing to the Fourier-v
2,2values. The Fourier-v
2,2values are always larger than the template-v
2,2and show a systematic increase at small
Nchrec(E
FCalT). This indicates the presence of a relatively large contribution from back- to-back dijets over this range. Asymptotically, at large
Nchrecthe Fourier-v
2,2values become stable, but show a small decreasing trend in the
EFCalTdependence. The ZYAM-based
v2,2values are smaller than the template-v
2,2values for all
Nchrec(E
TFCal), and by construction systematically decrease to zero for the lower
Nchrec(E
TFCal) intervals. However, at larger
Nchrec(E
FCalT) they too show only a weak dependence on the
Nchrec(E
FCalT). Asymptotically, at large
Nchrecthe values from the Fourier transform and from the default template fits match to within
∼10% (relative). In general, the v2,2from all three methods agree within
±15% at largeNchrec