ATLAS-CONF-2018-050 03October2018
ATLAS CONF Note
ATLAS-CONF-2018-050
October 3, 2018
Dijet azimuthal correlations and conditional yields in pp and p+Pb collisions at √
s
NN= 5.02 TeV with the ATLAS detector
The ATLAS Collaboration
This paper presents a measurement of forward–forward and forward–central dijet azimuthal angular correlations and conditional yields in proton–proton (pp) and proton–lead (p+Pb) collisions as a probe for possible gluon-density saturation in regions where the momentum fraction of a parton compared to a nucleon in the lead nucleus is low. In these regions, gluon saturation can modify the rapidly increasing parton distribution function of the gluon. The analysis utilizes 25 pb−1ofppdata and 360µb−1ofp+Pb data, both at√
sNN= 5.02 TeV, col- lected in 2015 and 2016, respectively, with the ATLAS detector at the LHC. The measurement is performed in the center-of-mass frame of the nucleon–nucleon system in the center-of-mass rapidity range between -4.0 and 4.0 using the two highest transverse momentum jets in each event. The highest transverse momentum jet is restricted to the forward rapidity range where it is possible to probe the region where the momentum fraction of a parton compared to a nucleon in the lead nucleus is low. No significant broadening of azimuthal angular corre- lations is observed for forward–forward or forward–central dijets in p+Pb compared to pp collisions within the uncertainties. The ratio of conditional yields of forward–forward jet pairs in the proton-going direction inp+Pb collisions compared toppcollisions is suppressed by approximately 20%, with no significant dependence on the transverse momentum of the dijets system. No modification of conditional yields is observed for forward–central dijets.
© 2018 CERN for the benefit of the ATLAS Collaboration.
Reproduction of this article or parts of it is allowed as specified in the CC-BY-4.0 license.
1 Introduction
Studies of particle collisions at accelerators have contributed significantly to an improved understanding of the strong interaction in quantum chromodynamics (QCD), and the knowledge of parton distribution functions (PDFs) of the proton. Global QCD analysis of structure functions in deep-inelastic lepton–
nucleon scattering at HERA, as well as jet and hadron cross sections at the LHC, Tevatron, and RHIC were performed in a wide kinematic range, providing several new sets of PDFs with the highest degree of precision reached so far [1–4]. These analyses further constrain quark and gluon contributions over a wide range of the Bjorken variablex: the longitudinal momentum fraction of a nucleon carried by its constituent partons. From these measurements, the gluon distribution in the proton is found to rise rapidly for decreasingx. Unitarity requires that the first moment of the gluon momentum distribution remains finite. Therefore, the steep rise at low x must change at some x value; this phenomenon is known as saturation[5].
The search for the onset of saturation was a major scientific goal with proton-nucleus collisions at RHIC [6–8], where the sensitivity to saturation effects was increased due to the enhancement of the nuclear gluon density in the Lorentz-contracted nucleus [9]. These measurements were able to probexA,q the longitudinal momentum fraction of the parton compared to a nucleon in the nucleus. A mid-rapidity1 measurement of jet-production rates at RHIC found no significant modification in deutron-gold collisions compared to proton–proton (pp) collisions [10]. Recent analyses at the LHC have been performed in the proton-going direction ofp+Pb collisions and at higher center-of-mass energies, allowing a lower value of xAin the lead nucleus to be probed. The ALICE measurements of charged jet production cross sections and dijet azimuthal angular correlations at mid-rapidity did not find significant modification in p+Pb collisions compared toppcollisions [11,12]. The ATLAS and CMS analyses of inclusive jet production also did not find significant evidence of nuclear modification [13,14]. Recently, CMS extended the search for gluon saturation to the highest gluon densities reached so far by measuring the inclusive jet cross section inp+Pb collisions using the CASTOR detector at very forward pseudorapidity from 5.2 to 6.6 in the downstream proton direction, probingxAdown to 10−6[15]. Comparing measured jetpT spectra to event generators Epos-lhc [16], Hijing [17], and Qgsjetii-04 [18], it was found that none could describe the data over the full jetpTspectra range, opening up the possibility for nuclear effects not described by these models. Another measurement probing gluon saturation in nuclear gluon densities was proposed in the framework of the Color Glass Condensate (CGC) model [19] by studying the modifications of dijet azimuthal angular distributions in pp and p+Pb collisions at xA down to 10−5 [20]. For back-to-back dijets, the gluon field in the lead nucleus is probed at low momentum where saturation effects are expected to be large [21]. Currently, the gluon nuclear PDFs have large uncertainties at lowxA[22], and additional data in this region would help to further constrain them.
In this paper, a measurement of azimuthal correlations between leading and sub-leading jets using the ATLAS detector in pp and p+Pb collisions at √
sNN = 5.02 TeV is presented. The measurement is performed in intervals of the center-of-mass rapidity, y∗(y∗ ≡ y−∆y), where yis the rapidity in the lab
1 ATLAS uses a right-handed coordinate system with its origin at the nominal interaction point (IP) in the center of the detector and thez-axis along the beam pipe. Thex-axis points from the IP to the center of the LHC ring, and theyaxis points upward.
Cylindrical coordinates(r, φ) are used in the transverse plane,φbeing the azimuthal angle around the beam pipe. For the proton–lead (p+Pb) collisions, the incident Pb beam traveled in the+zdirection. The pseudorapidity is defined in terms of the polar angleθasη=−ln tan(θ/2). Angular distance is measured in units of∆R ≡
q(∆η)2+(∆φ)2 with∆ηand∆φ defined as the differences between two directions in pseudorapidity and azimuth. Rapidity is defined in terms of energy and momentum of a particle or jet asy=12ln(E+pE−pz
z).
frame, and∆yis the rapidity shift in the center-of-mass frame. The leading jet has the highest transverse momentum (pT,1) in the event and is required to be in the forward proton-going direction. The sub-leading jet has the second-highest transverse momentum (pT,2) in the event and is not restricted to a single rapidity range. The center-of-mass rapidities of the leading and sub-leading jets arey∗
1andy∗
2, respectively. This measurement of dijets probes the lowest xAbetween 10−4 and 10−3 of the lead nucleus. The azimuthal angular correlation functions,C12, which are normalized to the number of leading jetsN1, are defined as:
C12(pT,1,pT,2,y∗
1,y∗
2) = 1 N1
dN12 d∆φ,
whereN12is the number of dijets, and∆φis the lower azimuthal angle between the leading and sub-leading jets. TheC12distributions are fitted and their widthsW12defined by the root-mean-square (RMS) of the fit:W12(pT,1,pT,2,y∗
1,y∗
2) =RMS(C12).
In addition to dijet azimuthal angular distributions, the dijet conditional yields, I12, are measured and defined as:
I12(pT,1,pT,2,y∗
1,y∗
2)= 1 N1
d4N12 dy∗
1dy∗
2dpT,1dpT,2.
The azimuthal angular correlations and conditional yields evaluated inp+Pb andppcollisions are com- pared and the ratios inW12andI12between the two systems are calculated as:
ρpPbW (pT,1,pT,2,y∗
1,y∗
2)= WpPb
12
Wpp
12
, ρpPbI (pT,1,pT,2,y∗
1,y∗
2) = IpPb
12
Ipp
12
.
To define a phase space which is more tractable for next-to-leading-order (NLO) calculations, a min- imum ∆pT = pT,1 − pT,2 is required on the dijets [23–25]. However, techniques such as Sudakov re-summation [26] can take into account the absence of∆pTrequirements. Also, comparisons with fixed- order calculations and soft-gluon re-summation, which involve transverse momentum dependent PDFs, instead of collinear PDFs, are better suited for scenarios not requiring any minimum∆pT on the dijets.
The results of the measurement are therefore presented both without any requirement on∆pT, as well as with the requirement of∆pT >3 GeV.
2 Experimental setup
The measurements presented here are performed using the ATLAS calorimeter, trigger, and data acquisi- tion systems [27]. The calorimeter system consists of a sampling liquid argon (LAr) electromagnetic (EM) calorimeter covering |η| < 3.2, a steel–scintillator sampling hadronic calorimeter covering |η| < 1.7, a LAr hadronic calorimeter covering 1.5 < |η| < 3.2, and two LAr forward calorimeters (FCal) covering 3.2 < |η| <4.9. The EM calorimeters are segmented longitudinally in shower depth into three layers plus an additional pre-sampler layer and have a granularity that varies with the layer and pseudorapidity, but which is much finer than that of the hadronic calorimeter. The hadronic calorimeter has three longitudinal sampling layers and is comprised of the Tile barrel and extended barrel hadronic calorimeters covering
|η| < 1.7, and the Hadronic-End-Cap (HEC), covering 1.5 < |η| <3.2. The minimum-bias trigger scin- tillators (MBTS) detect charged particles over 2.1< |η| <3.9 using two azimuthally segmented counters placed atz=±3.6 m. Each counter provides measurements of both the pulse heights and the arrival times of ionization energy deposits from each segment. There are twelve measurements per counter.
A two-level trigger system was used to select the pp and p+Pb collisions in this measurement. The first is the Level-1 (L1) hardware-based trigger implemented with custom electronics. The second is the software-based High Level Trigger (HLT). Jet events were selected by the HLT with input from the L1 jet and transverse-energy trigger inppcollisions, and minimum-bias trigger inp+Pb collisions. The two L1 total energy triggers used required a total transverse energy measured in the calorimeter to be greater than 5 GeV and 10 GeV, respectively. L1 jet trigger used inppcollisions required a jet with transverse energy thresholds ranging from 12 GeV to 20 GeV. Minimum-biasp+Pb events were required to have at least one hit in the MBTS detector on each side of the interaction point at the L1 trigger. The HLT jet trigger operated a jet reconstruction algorithm similar to that applied in the offline analysis and selected events containing jets with transverse energy thresholds ranging from 15 GeV inp+Pb collisions and up to 85 GeV in pp collisions. In both ppand p+Pb collisions, the highest threshold jet trigger sampled the full delivered luminosity, jet triggers with lower thresholds were prescaled2and sampled a fraction of delivered luminosity. Both forward (3.2 < |η| < 4.9) and central (|η| < 3.2) jet triggers are used in this measurement.
3 Data sets and event selection
A total of 25 pb−1 of
√s = 5.02 TeV pp data from 2015 is used with two equal energy proton beams.
Duringppdata taking, the average number of interactions per bunch crossing varied from 0.6 to 1.3.
Thep+Pb data used in this analysis were recorded in 2016 with the LHC configured with a 4 TeV proton- beam and a 1.57 TeV per nucleon Pb beam, producing collisions with√
sNN= 5.02 TeV and a rapidity shift of the nucleon–nucleon center-of-mass frame∆y =0.465 relative to the ATLAS frame. The Pb beam was traveling to positive pseudorapidity and the proton beam to negative pseudorapidity. However, in order to be consistent with previous measurements [13,28], the proton-going direction is defined as the positive rapidity in this measurement. The total p+Pb integrated luminosity is 360 µb−1. The instantaneous luminosity conditions during the p+Pb data-taking resulted in an average number of p+Pb interactions per bunch crossing of 0.03. Inp+Pb andppcollisions, events are required to have a reconstructed vertex.
Only events taken during stable beam conditions and satisfying detector and data-quality requirements are considered.
The performance for measuring azimuthal angular correlations and conditional yields in both the pp and p+Pb data samples is evaluated with a 5.02 TeV pp Monte Carlo (MC) sample simulated using Pythia 8.212 [29]. Hard scattering ppevents with the A14 [30] tune and NNPDF23LO PDF set [31]
are used. Additionally, the 5.02 TeVppHerwig++ [32] MC simulation is used with approximately 5.6 million events for performance studies. The detector response is then simulated using GEANT4 [33,34].
Theppsamples used for this analysis contain approximately 12 million events. Correspondingp+Pb MC samples are obtabined by overlayingppMC events with minimum-bias data events fromp+Pb collisions.
The simulated 5.02 TeVppevents are generated with the same MC tune as for theppMC sample but with a rapidity shift equivalent to that in thep+Pb collisions. The minimum-biasp+Pb data events used were recorded during the 2016 data-taking period.
2The prescale indicates which fraction of events that passed the trigger selection was selected for recording by the data acquisition system.
4 Jet selection and reconstruction
Jets inppandp+Pb collisions are reconstructed using a heavy-ion jet reconstruction procedure developed for previous jet measurements inp+Pb and Pb+Pb collisions [13,28]. The jet reconstruction is first run in four-momentum recombination mode, on∆η ×∆φ = 0.1×0.1 calorimeter towers with the anti-kt algorithm [35] with the distance parameter R = 0.4. Energies in the towers are obtained by summing the energies of calorimeter cells at the electromagnetic energy scale within the tower boundaries. Then, an iterative procedure is used to estimate the layer and η-dependent underlying event (UE) transverse energy density, while excluding the regions populated by jets. The UE transverse energy is subtracted from each calorimeter tower and the four-momentum of the jet is updated accordingly. Then, a jetη−
and pT-dependent correction factor derived from the simulation samples is applied to correct for the calorimeter response. An additional correction based onin situstudies of the momentum balance of jets recoiling against photons,Zbosons, and jets in other regions of the calorimeter is applied [36,37].
Jets are selected in the transverse momentum range of 28< pT < 90 GeV and a center-of-mass rapidity of|y∗| < 4.0. This is the largest symmetric overlap between the two colliding systems for which most forward jets can be reconstructed using the FCal with full coverage forR=0.4 jets. All reconstructed jets are required to have apT such that the jet trigger efficiency is greater than 99%. As a result, no trigger efficiency correction is applied. During thep+Pb data taking, part of the HEC in the lead-going direction was disabled in the pseudorapidity and azimuthal intervals−3.2 < η < −1.3 and −π < φ < −π/2, respectively. Reconstructed dijets where the sub-leading jet area overlaps with the disabled HEC region are excluded from the analysis inp+Pb data and MC samples.
The MC samples are used to evaluate the jet reconstruction performance and to correct the measured distributions for detector effects. This is done independently for both pp and p+Pb collisions. In the MC samples, the generator-level jets are reconstructed from primary particles3with the anti-kt algorithm with radiusR=0.4. Using the pseudorapidity and azimuthal anglesηtruth,φtruth,ηreco, andφrecoof the generated and reconstructed jets, respectively, generator-level jets are matched to reconstructed jets by requiring∆R< 0.2.
The efficiency of reconstructing jets inppandp+Pb collisions is evaluated using the Pythia8 MC samples by determining the probability of finding a reconstructed jet associated with a generator-level jet. The jet reconstruction efficiency is greater than 99% for jets with pT > 30 GeV and decreases to 95% at a jet pT =28 GeV. The jet reconstruction efficiency exhibits a small variation with rapidity.
The ratios of transverse momenta of generated and reconstructed jets,ptruth
T andpreco
T respectively, deter- mine the relevant jet energy scale (JES), and jet energy resolution (JER), which characterize the jet energy reconstruction performance. The JES and JER are shown as a function ofptruth
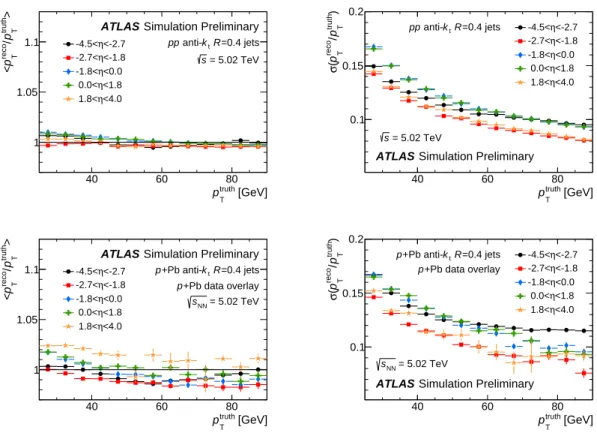
T , in intervals of generated jet pseudorapidityηtruth, in Fig.1forppandp+Pb MC samples. The JES shows a very small dependence onηtruth, with a maximum deviation of±3% from unity. Jet angular reconstruction performance has been studied in terms of angular distances in pseudorapidity and azimuthal angle,h∆ηiandh∆φi, and their resolutionsσ(∆η) andσ(∆φ). The mean angular distances are consistent with zero, and the jet angular resolutions (JAR) decrease as a function ofptruth
T for both theppandp+Pb MC samples.
3Primary particles are defined as particles with a mean lifetimeτ >0.3×10⁻¹⁰s, excluding muons and neutrinos, which are weakly interacting and do not leave significant energy deposits in the calorimeters.
[GeV]
truth
pT
40 60 80
>truth Tp/reco Tp<
1 1.05
1.1 -4.5<η<-2.7
<-1.8 η -2.7<
<0.0 η -1.8<
<1.8 η 0.0<
<4.0 η 1.8<
Simulation Preliminary ATLAS
=0.4 jets
tR k anti- pp
= 5.02 TeV s
[GeV]
truth
pT
40 60 80
)truth Tp/reco Tp(σ
0.1 0.15 0.2
<-2.7 η -4.5<
<-1.8 η -2.7<
<0.0 η -1.8<
<1.8 η 0.0<
<4.0 η 1.8<
Simulation Preliminary ATLAS
=0.4 jets
tR k anti- pp
= 5.02 TeV s
[GeV]
truth
pT
40 60 80
>truth Tp/reco Tp<
1 1.05
1.1 -4.5<η<-2.7
<-1.8 η -2.7<
<0.0 η -1.8<
<1.8 η 0.0<
<4.0 η 1.8<
Simulation Preliminary ATLAS
=0.4 jets
tR k +Pb anti- p
+Pb data overlay p
= 5.02 TeV sNN
[GeV]
truth
pT
40 60 80
)truth Tp/reco Tp(σ
0.1 0.15 0.2
<-2.7 η -4.5<
<-1.8 η -2.7<
<0.0 η -1.8<
<1.8 η 0.0<
<4.0 η 1.8<
Simulation Preliminary ATLAS
=0.4 jets
tR k +Pb anti- p
+Pb data overlay p
= 5.02 TeV sNN
Figure 1: Jet energy scale (left) and jet energy resolution (right) evaluated inpp(top) andp+Pb (bottom) MC samples in different pseudorapidity intervals and shown as a function of the generator-level jet transverse momentumptruth
T . Bins inpT,1[GeV] Bins inpT,2[GeV] Bins iny∗
2
28 < pT,1 <35 28< pT,2< 35 2.7< y∗
2 < 4.0 35 < pT,1 <45 35< pT,2< 45 1.8< y∗
2 < 2.7 45 < pT,1 <90 45< pT,2< 90 0.0< y∗
2 < 1.8
−1.8< y∗
2< 0.0
−4.0< y∗
2 < −1.8
Table 1: Transverse momentum and y∗ binning for leading and sub-leading jets. For the leading jet, only the 2.7<y∗
1 <4.0 bin is used.
5 Analysis procedure
The two highestpTjets in each event are used to study azimuthal angular correlations, which are evaluated as a function of∆φrelative to the leading jet in the center-of-mass rapidity interval 2.7< y∗
1< 4.0, and in different intervals ofy∗
2,pT,1, and pT,2. Table1lists the various transverse momenta and center-of-mass rapidity intervals used in the measurement. TheC12distributions are subsequently fitted to extract their widths.
Detector effects affecting the leading-jetpTspectra and the azimuthal angular distributionsC12inppand p+Pb collisions are corrected using a bin-by-bin unfolding procedure. The unfolding procedure corrects for the effect of the migration due to the jet energy and angular resolutions as well as the jet reconstruction
efficiency. The jets excluded due to the disabled HEC region inp+Pb data and MC samples are accounted for using the same procedure because generator-level jets are not excluded from the affected region.
Thus, the correction factors used in the unfolding account for the missing reconstructed-xlevel jets. Two corresponding MC distributions for each of the two observables are evaluated, one using generator-level jets and the other using reconstructed jets after the detector simulation. The ratio of these two MC distributions provides correction factors which are then applied to the data. The bin-by-bin unfolding procedure is sensitive to differences in the shapes of distributions between the data and the MC samples.
Thus, the jetpTspectra andC12distributions in the MC reconstructed samples are re-weighted to match the shapes in the data. Weights are derived by evaluating the ratios between data and MC reconstructed distributions. The re-weighting is done in two steps: 1) weights for jetpT spectra are evaluated; 2) when deriving weights forC12 distributions, the dependence on the jet pT spectra is removed by applying the weights from the previous step. The final weight is the product of the two weights. JetpTspectra weights are consistent with unity for ppandp+Pb collisions, and the∆φweights are consistent with unity near the peak ofC12distributions, where the effect of re-weighting is largest.
The unfolded jetpT spectra and dN12/d∆φare further used to evaluateC12distributions both in ppand p+Pb collisions. TheC12 distributions are then fitted as a function of∆Φ = ∆φ−π by a symmetric exponential distribution convolved with a Gaussian function:
C12(∆Φ) =Z ∞
−∞
dδ e−δ2/2σ2
√
8πσ2τ2e− |∆Φ−δ|/τ
whereτis the inverse slope of the exponential component andσis the width of the Gaussian distribution.
All parameters are required to be positive. Evaluating the convolution of the Gaussian and symmetric exponential functions, the resulting fit function used in the analysis is:
C12(∆Φ)= Aeσ2/2τ2 2τ
1 2
e∆Φ/τErfc 1
√ 2
∆Φ
σ + σ
τ
+e−∆Φ/τ
1− 1 2Erfc
1
√ 2
∆Φ
σ − σ
τ
,
whereAis the overall scaling factor. The widthW12is chosen to be represented by the analytic root-mean- square of the resulting fit function:W12=RMS(C12)=√
2τ2+σ2. The fitting procedure is performed in the range 2.5<∆φ < π. However, the convolution of the Gaussian and symmetric exponential functions is found to better describe the data around the peak of the C12 distributions than a pure exponential function.
6 Systematic uncertainties
Systematic uncertainties originate from the JES, JER, JAR, the fitting procedure, acceptance correction, and unfolding procedure. For each source of systematic uncertainties, the valuesW12,I12, and their ratios, ρpPbW andρpPbI , inp+Pb andppcollisions are re-evaluated. The difference between the varied and nominal values is used as an estimate of the uncertainty.
The systematic uncertainty due to the JES is determined from in situ studies of the calorimeter re- sponse [36–39], and studies of a relative energy-scale difference between the heavy-ion jet reconstruction procedure [38] and the procedure used in 13 TeV pp collisions [40]. The JES uncertainty depends on the jetpT and jetη and is applied as a modification to the reconstructed jetpT and varied separately by
±1 standard deviation. The bin-by-bin correction factors are recomputed accordingly and the data are
unfolded with them. The resulting uncertainty from the JES is typically less than 15% on the values of both W12andI12. An additional source of systematic uncertainty on the JES inp+Pb collisions originates from differences between detector response and its simulation compared to ppcollisions. These differences are on the order of 1%, and their resulting systematic uncertainties are added to the total JES systematic uncertainty in quadrature.
The uncertainty due to the JER is evaluated by repeating the unfolding procedure with modified bin-by-bin correction factors, where an additional contribution is added to the resolution of the simulated jetpTusing a Gaussian smearing procedure [40]. The smearing factor is evaluated using anin situtechnique in 13 TeV ppdata involving studies of dijet transverse energy balance [41]. An additional uncertainty is included to account for differences between the heavy-ion jet reconstruction and that used in the analyses of 13 TeV ppdata. The resulting uncertainty from the JER is symmetrized to account for negative variations of the JER. The size of the resulting uncertainty due to the JER on the values ofI12 reaches up to 30% and is typically below 10% on the values ofW12.
The systematic uncertainty from the JAR originates in differences in the angular resolution between the data and MC samples. The uncertainty is derived as the difference in the angular resolutions evaluated using the two different MC generators, Herwig++ and Pythia8. Distributions are unfolded with modified bin-by-bin correction factors where the reconstructed jetη andφ are smeared to reflect an up to∼5%
uncertainty on the JAR.
The systematic uncertainty from the fitting procedure is associated with the sensitivity of the measurement to the fit range. This systematic uncertainty is present only on the values ofW12andρpPbW . The uncertainty is evaluated by modifications of the fit interval from the default of 2.5 < ∆φ < π to a fit range of 2.1 < ∆φ < π. In different ranges of pT,1 and pT,2, the resulting uncertainties are fitted to a constant function over the range|y∗| < 4.0. The systematic uncertainty is smoothed by a fit in order to minimize the impact of the statistical fluctuations. The size of the resulting uncertainty onW12is less than 7%.
The systematic uncertainty associated with the bin-by-bin unfolding is associated with differences in the spectral shape between the data and MC samples. To achieve better correspondence with the data, the simulated values are reweighted to match the shapes in the data. The entire change in unfolded values induced by the use of reweighted bin-by-bin correction factors is taken as the systematic uncertainty, which is below 5% forC12andI12.
The systematic uncertainty associated with the acceptance correction for the disabled part of the HEC duringp+Pb data taking is evaluated by increasing the size of the excluded region by 0.1 in azimuth and pseudorapidity that corresponds to the size of calorimeter tower. The resulting uncertainty is symmetrized to account for no negative variation in the excluded region due to the simultaneous overlap of the jet area with the regions covered by the enabled and disabled HEC. The uncertainty only affects the rapidity region−4.0 < y∗
2 < −1.4. The resulting uncertainty onW12is negligible. The uncertainty on the yields I12reaches up to 10%.
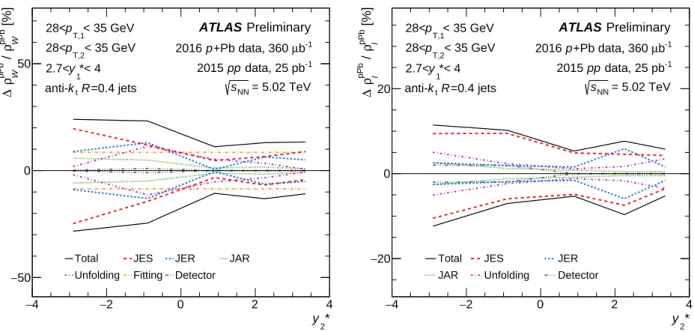
Examples of systematic uncertainties on the values ofW12andI12are presented in Fig.2. The systematic uncertainties from each source are assumed to be uncorrelated and are thus combined in quadrature to obtain the total systematic uncertainty.
The correlations between the various systematic components are considered in evaluating thep+Pb topp ratios. The uncertainties associated with unfolding, fitting, the disabled HEC region, and the additional JES uncertainties associated with the differences between the detector response and its simulations in p+Pb collisions compared toppcollisions are taken to be uncorrelated between the two collision systems
2* y
−4 −2 0 2 4
[%]12W / 12W ∆
−20 0 20 40
Total JER JES
JAR Unfolding Fitting
Preliminary ATLAS
data, 25 pb-1
pp 2015
=0.4 jets
tR k anti-
= 5.02 TeV s
< 35 GeV pT,1
28<
< 35 GeV pT,2
28<
*< 4 y1
2.7<
2* y
−4 −2 0 2 4
[%]12I / 12I ∆
−20 0 20 40
Total JER JES
JAR Unfolding
Preliminary ATLAS
data, 25 pb-1
pp 2015
=0.4 jets
tR k anti-
= 5.02 TeV s
< 35 GeV pT,1
28<
< 35 GeV pT,2
28<
*< 4 y1
2.7<
2* y
−4 −2 0 2 4
[%]12W / 12W ∆
−20 0 20 40
Total JER JES JAR
Unfolding Fitting Detector
Preliminary ATLAS
b-1
µ +Pb data, 360 p
2016
=0.4 jets
tR k anti-
= 5.02 TeV sNN
< 35 GeV pT,1
28<
< 35 GeV pT,2
28<
*< 4 y1
2.7<
2* y
−4 −2 0 2 4
[%]12I / 12I ∆
−20 0 20 40
Total JER JES JAR
Unfolding Detector
Preliminary ATLAS
b-1
µ +Pb data, 360 p
2016
=0.4 jets
tR k anti-
= 5.02 TeV sNN
< 35 GeV pT,1
28<
< 35 GeV pT,2
28<
*< 4 y1
2.7<
Figure 2: Relative systematic uncertainties on values ofW12(left) andI12(right) inpp(top) andp+Pb (bottom) col- lisions. The uncertainty associated with the disabled HEC region is labeled as the Detector uncertainty. Uncertainty values are presented for the center of the bin and with no∆pTrequirement.
and are added in quadrature. All other uncertainties associated with the JES, JER, and JAR are taken to be correlated. The ratios are re-evaluated by applying the variation to both collision systems simultaneously and the resulting variations of the ratios from their central values are used as the correlated systematic uncertainty from a given source. Examples of systematic uncertainties for the values ofρpPbW andρpPbI are presented in Fig.3, where the systematic uncertainty from the JES (up to 20%) is dominant.
2* y
−4 −2 0 2 4
[%]pPb Wρ / pPb Wρ∆
−50 0 50
Total JES JER JAR
Unfolding Fitting Detector
Preliminary ATLAS
b-1
µ +Pb data, 360 p
2016
data, 25 pb-1
pp 2015
= 5.02 TeV sNN
=0.4 jets
tR k anti-
< 35 GeV pT,1
28<
< 35 GeV pT,2
28<
*< 4 y1
2.7<
2* y
−4 −2 0 2 4
[%]pPb Iρ / pPb Iρ∆
−20 0 20
Total JES JER
JAR Unfolding Detector
Preliminary ATLAS
b-1
µ +Pb data, 360 p
2016
data, 25 pb-1
pp 2015
= 5.02 TeV sNN
=0.4 jets
tR k anti-
< 35 GeV pT,1
28<
< 35 GeV pT,2
28<
*< 4 y1
2.7<
Figure 3: Relative systematic uncertainties on values ofρpPbW (left) andρpPbI (right). The uncertainty associated with the disabled HEC region is labeled as the Detector uncertainty. Uncertainty values are presented for the center of the bin and with no∆pTrequirement.
7 Results
This section presents values ofW12and theI12 and their ratios,ρpPbW andρpPbI , inp+Pb andppcollisions.
Examples of unfoldedC12 distributions in different intervals of pT,1andpT,2 evaluated in ppand p+Pb collisions are shown in Fig.4together with the fit results. TheC12distributions have a characteristic peak at∆φ= π.
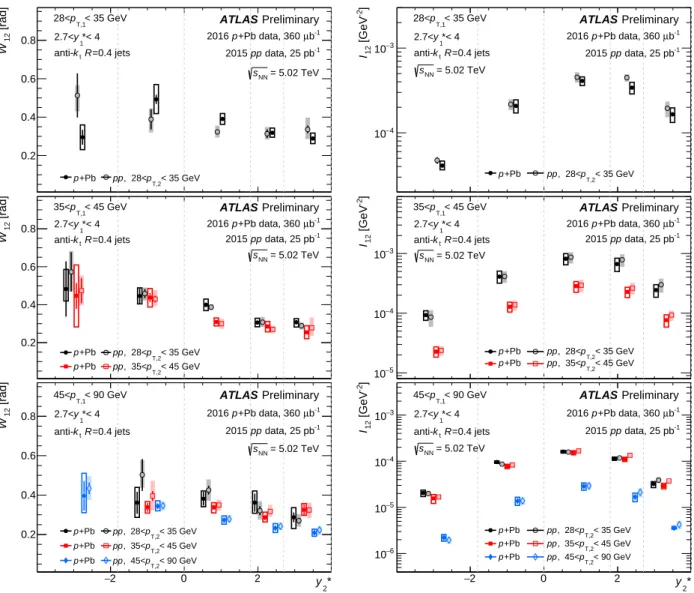
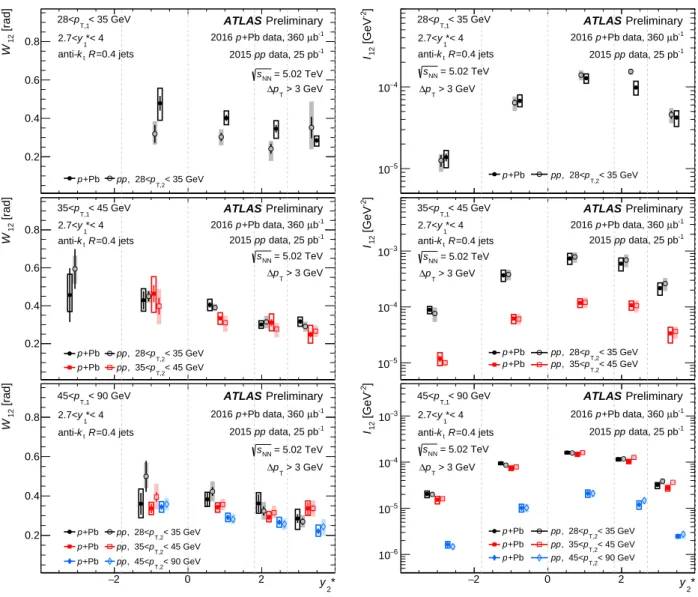
The results of measurements ofW12inp+Pb collisions andppcollisions for different ranges ofpT,1and pT,2as a function ofy∗
2are presented in left panels of Fig.5. The value ofW12increases with increasing rapidity separation between the leading and sub-leading jets both in theppandp+Pb collisions. Further,
[rad]
φ
∆
2.5 3
]-1 [rad12C
0 0.02 0.04 0.06
Preliminary ATLAS
b-1
µ +Pb data, 360 p
2016
data, 25 pb-1
pp 2015
*< 4 y1
2.7<
< 35 GeV pT,1
28<
< 35 GeV pT,2
28<
*< 4 y2
2.7<
=0.4 jets
tR k anti-
= 5.02 TeV sNN
+Pb p pp
[rad]
φ
∆
2.5 3
]-1 [rad12C
0 0.05 0.1
0.15 ATLAS Preliminary
b-1
µ +Pb data, 360 p
2016
data, 25 pb-1
pp 2015
*< 4 y1
2.7<
< 45 GeV pT,1
35<
< 35 GeV pT,2
28<
*< 4 y2
2.7<
=0.4 jets
tR k anti-
= 5.02 TeV sNN
+Pb p pp
[rad]
φ
∆
2.5 3
]-1 [rad12C
0 0.05
Preliminary ATLAS
b-1
µ +Pb data, 360 p
2016
data, 25 pb-1
pp 2015
*< 4 y1
2.7<
< 45 GeV pT,1
35<
< 45 GeV pT,2
35<
*< 4 y2
2.7<
=0.4 jets
tR k anti-
= 5.02 TeV sNN
+Pb p pp
Figure 4: UnfoldedC12distributions inpp(red symbols) andp+Pb (black symbols) collisions for different selections ofpT,1andpT,2 as a function of∆φ. The lines represent the results of the fit function. The open boxes represent systematic uncertainties and vertical error bars represent statistical uncertainties. The size of the box does not represent the width of the bin. Results are shown with no∆pTrequirement.
theW12 increases with imbalance in pT between the leading and sub-leading jets. The results of the measurement of conditional yieldsI12inp+Pb andppcollisions are shown in the right panels of Fig.5.
The value ofI12increases with the increasing rapidity separation between the two jets reaching a maximum for sub-leading jets in the 0.0 < y∗
2 < 1.8 interval and decreases for larger rapidity separations between the two jets. This is attributed to the dijet cross section falling off faster at forward rapidities compared to the inclusive jet cross section. Distributions ofI12 have similar shapes inppandp+Pb collisions for all pT,1andpT,2combinations.
[rad]12W
0.2 0.4 0.6 0.8
Preliminary ATLAS
data, 25 pb-1
pp 2015
b-1
µ +Pb data, 360 p
2016
=0.4 jets
tR k anti-
= 5.02 TeV sNN
+Pb
p < 35 GeV
pT,2
, 28<
pp
< 35 GeV pT,1
28<
*< 4 y1
2.7<
[rad]12W
0.2 0.4 0.6 0.8
Preliminary ATLAS
data, 25 pb-1
pp 2015
b-1
µ +Pb data, 360 p
2016
=0.4 jets
tR k anti-
= 5.02 TeV sNN
+Pb p
+Pb p
< 35 GeV pT,2
, 28<
pp
< 45 GeV pT,2
, 35<
pp
< 45 GeV pT,1
35<
*< 4 y1
2.7<
2* 2 y
− 0 2
[rad]12W
0.2 0.4 0.6 0.8
Preliminary ATLAS
data, 25 pb-1
pp 2015
b-1
µ +Pb data, 360 p
2016
=0.4 jets
tR k anti-
= 5.02 TeV sNN
+Pb p
+Pb p
+Pb p
< 35 GeV pT,2 , 28<
pp
< 45 GeV pT,2 , 35<
pp
< 90 GeV pT,2 , 45<
pp
< 90 GeV pT,1
45<
*< 4 y1
2.7<
]-2 [GeV12I
−4
10
−3
10
Preliminary ATLAS
data, 25 pb-1
pp 2015
b-1
µ +Pb data, 360 p
2016
=0.4 jets
tR k anti-
= 5.02 TeV sNN
+Pb
p < 35 GeV
pT,2
, 28<
pp
< 35 GeV pT,1
28<
*< 4 y1
2.7<
]-2 [GeV12I
−5
10
−4
10
−3
10
Preliminary ATLAS
data, 25 pb-1
pp 2015
b-1
µ +Pb data, 360 p
2016
=0.4 jets
tR k anti-
= 5.02 TeV sNN
+Pb p
+Pb p
< 35 GeV pT,2
, 28<
pp
< 45 GeV pT,2
, 35<
pp
< 45 GeV pT,1
35<
*< 4 y1
2.7<
2* 2 y
− 0 2
]-2 [GeV12I
−6
10
−5
10
−4
10
−3
10
Preliminary ATLAS
data, 25 pb-1
pp 2015
b-1
µ +Pb data, 360 p
2016
=0.4 jets
tR k anti-
= 5.02 TeV sNN
+Pb p
+Pb p
+Pb p
< 35 GeV pT,2 , 28<
pp
< 45 GeV pT,2 , 35<
pp
< 90 GeV pT,2 , 45<
pp
< 90 GeV pT,1
45<
*< 4 y1
2.7<
Figure 5: Comparison ofW12(left) andI12(right) values inpp(open symbols) andp+Pb (closed symbols) collisions for different selections ofpT,1andpT,2 as a function ofy∗
2. They∗
2 intervals are separated by dotted vertical lines.
The central values are shifted horizontally for visibility, and do not reflect an actual shift in rapidity. The shaded and empty boxes indicate systematic uncertainties and vertical error bars represent statistical uncertainties for thepp andp+Pb, respectively. The size of the box does not represent the width of the bin. Some points are not presented due to high statistical uncertainties. Results are shown with no∆pTrequirement.
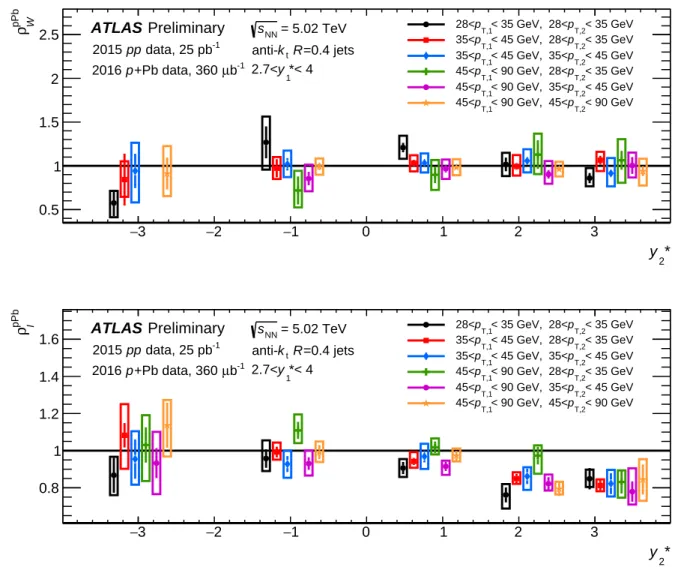
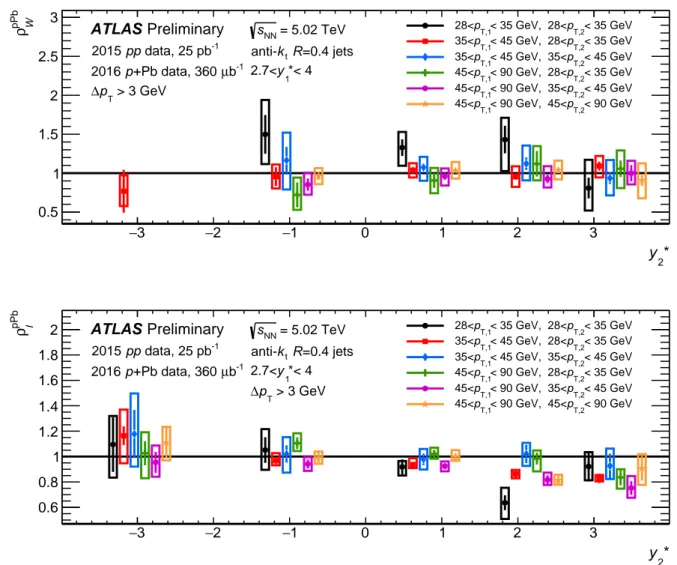
The ratiosρpPbW betweenp+Pb collisions andppcollisions for different ranges ofpT,1andpT,2as a function ofy∗
2are consistent with unity and are presented in the left panel of Fig.6. The ratiosρpPbI betweenp+Pb
collisions andppcollisions in same bins of rapidity and transverse momenta are shown in the right panel of Fig.6. The uncertainty on this ratio is dominated by systematic uncertainties, which are correlated in jetpTandy∗. The ratios ρpPbI are consistent with unity for sub-leading jets in the lead-going direction and for central–forward dijets. The ratio of conditional yields of jet pairs when both leading and sub-leading jets are in the proton-going direction is suppressed by approximately 20% inp+Pb collisions compared topp collisions, with no significant dependence on jetpT. In the most forward-forward configuration, with both jets in the lowest jetpTinterval 28< pT,1,pT,2 < 35 GeV, the approximatexArange probed is between 10−4and 10−3. The suppression is an indication of possible nuclear effects including saturation and shadowing.
2* y
−3 −2 −1 0 1 2 3
pPb Wρ
0.5 1 1.5 2
2.5 ATLAS Preliminary data, 25 pb-1
pp 2015
b-1
µ +Pb data, 360 p
2016
= 5.02 TeV sNN
=0.4 jets
tR k anti-
*< 4 y1
2.7<
< 35 GeV pT,2
< 35 GeV, 28<
pT,1
28<
< 35 GeV pT,2
< 45 GeV, 28<
pT,1
35<
< 45 GeV pT,2
< 45 GeV, 35<
pT,1
35<
< 35 GeV pT,2
< 90 GeV, 28<
pT,1
45<
< 45 GeV pT,2
< 90 GeV, 35<
pT,1
45<
< 90 GeV pT,2
< 90 GeV, 45<
pT,1
45<
2* y
−3 −2 −1 0 1 2 3
pPb Iρ
0.8 1 1.2 1.4
1.6 ATLAS Preliminary data, 25 pb-1
pp 2015
b-1
µ +Pb data, 360 p
2016
= 5.02 TeV sNN
=0.4 jets
tR k anti-
*< 4 y1
2.7<
< 35 GeV pT,2
< 35 GeV, 28<
pT,1
28<
< 35 GeV pT,2
< 45 GeV, 28<
pT,1
35<
< 45 GeV pT,2
< 45 GeV, 35<
pT,1
35<
< 35 GeV pT,2
< 90 GeV, 28<
pT,1
45<
< 45 GeV pT,2
< 90 GeV, 35<
pT,1
45<
< 90 GeV pT,2
< 90 GeV, 45<
pT,1
45<
Figure 6: Ratios ρpPbW ofW12 (left) and ρpPbI of I12 (right) values between p+Pb collisions and ppcollisions for different selections ofpT,1andpT,2as a function ofy∗
2. The central values are shifted horizontally for visibility, and do not reflect an actual shift in rapidity. The open boxes indicate systematic uncertainties and vertical error bars represent statistical uncertainties. The size of the box does not represent the width of the bin. Some points are not presented due to high statistical uncertainties. Results are shown with no∆pTrequirement.
Results for the values ofW12 and the I12 from pp collisions andp+Pb collisions with a∆pT > 3 GeV