A TLAS-CONF-2017-073 25 September 2017
ATLAS CONF Note
ATLAS-CONF-2017-073
17th September 2017
D meson production and long-range azimuthal correlation in 8.16 TeV p +Pb collisions with ATLAS
The ATLAS Collaboration
The production of D
0(D
0) and D
∗±mesons has been measured with the ATLAS detector in p +Pb collisions at √
s
NN= 8 . 16 TeV with an integrated luminosity of 76 . 3 µb
−1taken in 2016.
The D meson production asymmetry between forward (0 < y
∗< 0 . 5) and backward ( − 0 . 5 <
y
∗< 0) center-of-mass rapidities is studied, and no significant asymmetry is observed.
Azimuthal correlations between inclusive D
∗±and charged particles are also presented in intervals of event-wise charged-particle multiplicity. The second-order harmonic coefficients for inclusive D
∗±and charged particles azimuthal correlation have been extracted using template fits.
© 2017 CERN for the benefit of the ATLAS Collaboration.
Reproduction of this article or parts of it is allowed as specified in the CC-BY-4.0 license.
1 Introduction
Heavy quarks are primarily produced at early stages of heavy-ion collisions due to their large mass, and could carry information about the early stage properties of the quark gluon plasma (QGP) created in such collisions. Compared with gluons and light quarks, heavy quarks are expected to lose less energy when transversing the medium due to the dead-cone effect [1]. Detailed measurements of both production and azimuthal anisotropy in the final state for charmed and bottom hadrons can supply crucial information for understanding properties of strongly interacting matter. The LHC has provided a number of successful measurements addressing the modification of heavy quark production in a hot and dense medium using charmed D mesons ( D
0, D
∗±, D
±, D
±setc.) as probes. CMS has observed that the yield of D
0mesons in Pb+Pb collisions is suppressed by a factor of 5 compared to the pp reference at the transverse momentum ( p
T) range of 6 − 10 GeV, while a smaller suppression is observed at lower and at higher p
T[2]. A similar yield suppression of muons from heavy quark decays in Pb+Pb collisions has been observed by ATLAS [3]. Charmed mesons are found to have azimuthal anisotropy coefficients, v
n, with similar p
Tdependence to measurements of charged particles in Pb+Pb collisions as performed by CMS [4] and by ALICE [5].
Measurements of heavy quark production cross sections in proton-lead ( p +Pb) collisions are useful for distinguishing cold nuclear matter (CNM) effects from QGP signatures. Measurements of D meson nuclear modification factors by ALICE [6] in p +Pb collisions at central rapidities are consistent with unity within uncertainties. At large rapidities, a strong asymmetry of D meson production along the proton beam direction with respect to the lead beam direction in p +Pb collisions has been observed by LHCb [7].
The two recent measurements indicate that CNM effects have a strong rapidity dependence. Collectivity of charged particle production, which is sensitive to QGP formation, has been observed in small systems like p +Pb and pp collisions [8, 9]. Measurement of collectivity of heavy quarks in p +Pb collisions would serve as a useful tool to understand interactions between heavy quarks and the nuclear medium created in small systems. A previous ATLAS measurement [10] shows that muons from heavy quark decays in p +Pb collisions have a finite v
2coefficient, smaller than that of charged particles.
In this analysis, the cross sections of "prompt" D
0(D
0) and D
∗±mesons (those not coming from the sequential decays of b -hadrons), denoted as D
0and D
∗, has been measured using p +Pb collision data at
√ s
NN= 8 . 16 TeV collected in 2016 by ATLAS with an integrated luminosity of 76 . 3 µb
−1. The proton and
lead beams were configured with an energy of 6 . 5 TeV and Z × 6 . 5 TeV, respectively, resulting in a center
of mass collision energy of 8 . 16 TeV per nucleon pair and a rapidity boost of the system by ∆ y = ± 0 . 465
units relative to the laboratory frame. By convention, the measurement is reported as a function of center
of mass rapidity, y
∗, in the nucleon–nucleon collision frame, with a positive y
∗corresponding to the proton
beam direction. The D
0mesons are reconstructed in the range of transverse momentum 3 < p
T< 30 GeV
and center of mass rapidity − 1 . 5 < y
∗< 0 . 5, via their D
0→ K
−π
+and D
0→ K
+π
−decay channels,
while the D
∗mesons are reconstructed in the range of 5 < p
T< 30 GeV and − 1 . 5 < y
∗< 0 . 5, via the
channel of D
∗+→ D
0π
+→ ( K
−π
+)π
+and D
∗−→ D
0π
−→ (K
+π
−)π
−. The prompt D
0and D
∗yields
at forward to backward rapidities are compared to study the forward-backward production asymmetry,
which is sensitive to CNM effects. A study of azimuthal angular correlations between charged particles
and inclusive D
∗candidates with 3 < p
T< 30 GeV and − 1 . 5 < y
∗< 0 . 5, referred-to as D
∗- h correlation,
is also presented in intervals of event charged particle multiplicity, N
ch. In D
∗- h correlations, the p
Tof
identified D
∗is more closely related to the p
Tof primordial heavy quarks, relative to the measurement of
their decay muons.
2 Experimental setup
The ATLAS experiment [11] at the LHC is a multi-purpose particle detector with a forward-backward symmetric cylindrical geometry and a near 4 π coverage in solid angle.
1It consists of an inner tracking de- tector surrounded by a thin superconducting solenoid providing a 2 T axial magnetic field, electromagnetic and hadron calorimeters, and a muon spectrometer. The inner detector (ID) covers the pseudorapidity range |η | < 2 . 5. It consists of silicon pixel, silicon micro-strip, and transition radiation tracking detect- ors. Lead/liquid-argon (LAr) sampling calorimeters provide electromagnetic (EM) energy measurements with high granularity. A hadron (steel/scintillator-tile) calorimeter covers the central pseudorapidity range ( |η | < 1 . 7). The end-cap and forward regions are instrumented for both EM and hadronic energy measurements up to |η | = 4 . 9.
A two-level trigger system [12] is used to select events. The first-level trigger is implemented in hardware and uses a subset of the detector information to reduce the accepted rate to at most 100 kHz. This is followed by the software-based trigger level that reduces the accepted event rate to 1–4 kHz depending on the data-taking conditions during 2016. Candidate events for this analysis are collected with the minimum bias trigger and a set of high multiplicity triggers. The minimum bias events are used for measuring the D meson yields, while all events collected by the minimum bias trigger and high multiplicity triggers are used in the D
∗- h correlation.
The D
0meson is reconstructed via its decay of D
0→ K π using charged particle tracks reconstructed in the ID. In each triggered event with reconstructed primary vertex, pairs of oppositely-charged tracks, each with transverse momentum p
trkT
> 1 GeV, are combined to form D
0candidates. The selected pair of tracks is fitted to a common vertex. The kaon and pion masses are assumed in turn for each track. To improve the D meson signal to background significance, requirements similar to those used in Ref. [2] on the secondary vertex probability, secondary vertex decay length significance in the transverse plane and the pointing angle (defined as the angle between the total transverse momentum vector of the tracks and the vector connecting the primary and the secondary vertices in the transverse plane) are applied to the selected Kπ vertices. To form the D
∗candidates, additional tracks, which are assumed to be soft pions ( π
s), are each combined with the track pairs in turn. The track pairs must satisfy 1 . 75 < m(K π) < 1 . 96 GeV and the soft pion candidates must satisfy p
πsT
> 250 MeV , and must have a charge opposite to that of the kaon candidate track in the pair. The D
∗- h correlation analysis, which measures the relative angular modulation, is not sensitive to the contamination of fake tracks at low p
πsT
since their impacts can be largely reduced by the background subtraction procedure as described in Section 4. However, in the D
∗yield analysis, the soft pions are further required to have p
πsT
> 400 MeV for smaller fake track contamination in order to reduce systematic uncertainties in the cross section due to the track reconstruction at very low p
πsT
. The mass
m(K π), three-particle invariant mass m(K ππ
s), and the mass difference, ∆m = m(K ππ
s) − m( Kπ), are
calculated using the track momenta refitted to the decay topology.
A Monte Carlo (MC) [13] sample of inclusive D
∗from di-jet events produced in pp collisions at
√ s = 13 TeV are generated using Pythia 8 [14] using the NNPDF 2.3 LO PDF [15] set with the A14 tune [16].
In each event, one D
∗meson is produced promptly or from the sequential decay of a b quark (called the "non-prompt" contribution). The generated D
∗meson will subsequently decay to a D
0meson and a soft π , according to the decay branching fraction. These simulations are used to optimize selection
1
ATLAS uses a right-handed coordinate system with its origin at the nominal interaction point (IP) in the centre of the detector
and the z-axis along the beam pipe. The x-axis points from the IP to the centre of the LHC ring, and the y -axis points
upwards. Cylindrical coordinates (r, φ) are used in the transverse plane, φ being the azimuthal angle around the z -axis. The
pseudorapidity is defined in terms of the polar angle θ as η = − ln tan (θ/2 ) .
cuts, perform a correction closure test, and to study the fit model in p +Pb collisions. The response of the ATLAS detector is simulated using Geant 4 [17]. The simulated events are reconstructed with the same algorithms used for data.
3 Yields
The differential production cross section of prompt D mesons, including particles and anti-particles, is calculated for each measurement interval as:
d
2σ
d p
Td y
∗= f
prompt× N
corr.∆p
T× ∆ y
∗× B × P × R
L d t , (1) where ∆p
Tand ∆ y
∗are the interval sizes in terms of charmed meson transverse momentum and center of mass rapidity respectively, B is the decay branching fraction adapted from Ref. [18], P is the prescale factor of the minimum bias trigger,
R L d t is the integrated luminosity, f
promptis the fraction of prompt D mesons in the inclusive production and N
corr.is the observed corrected D meson signal yields in each kinematic interval under study. The prompt D meson fraction is determined using a method similar to the one used in Ref. [6], in which expected number of reconstructed non-prompt D mesons is calculated using fixed-order next-to-leading-logarithm (FONLL) predictions [19]. The corrected signal yields are obtained from fitting the m(K π) distributions for D
0and the ∆m distributions for D
∗, both weighted by per- candidate factors to correct for acceptance, track reconstruction efficiency and selection efficiency. Based on the measured D meson yields at forward and backward center of mass rapidities, the forward-backward asymmetry can be studied by taking R
FBdefined as:
R
FB( D ; | y
∗| < 0 . 5 ) = d
2σ( D)/ d p
Tdy
∗(0 < y
∗< 0 . 5)
d
2σ( D)/ d p
Tdy
∗(− 0 . 5 < y
∗< 0) , (2) where the forward and backward y
∗intervals are chosen to be symmetric such that the R
FBis unity for pp collisions by definition.
The acceptance of D
0→ K π ( D
∗→ D
0π
s→ K ππ
s) is defined as the probability that the decay products, K and π from D
0( K , π and π
sfrom D
∗) , fall into the analysis fiducial volume at a given transverse momentum and rapidity. The acceptance depends on the invariant mass, the rapidity in the lab frame, and the p
Tof the D meson. The track reconstruction efficiency is defined as the probability of a generator- level charged hadron from D meson decays to be reconstructed in the ID. The reconstruction efficiency is determined from MC samples. The efficiency, as a function of p
T, reaches its maximum at around 600 MeV, and the plateau efficiency is about 90% in the central η region of |η| < 1 . 0 and 80% in the forward η region of 1 . 0 < |η| < 2 . 5. The selection cut efficiency is also determined in simulations. The efficiencies are measured with respect to reconstructed D meson candidates in a pure signal sample. The average selection efficiency is about 25% with a strong p
Tdependence (10 − 20% at low p
Tand up to 40%
at high p
T) and a 5% variation from central to forward rapidity.
The D
0invariant mass ( m(K π)) distribution is described by a sum of a single Gaussian function, and
a Crystal Ball (CB) function [20] sharing a common mean. The ratio of the Gaussian width to the CB
width is fixed at a constant factor, obtained from the ratio of the track pair invariant mass resolution at
central rapidity, to that at forward in the simulation. The fraction of the Gaussian function in the signal
) [GeV]
π (K m
1.75 1.8 1.85 1.9 1.95 2
Weighted Events / 5 MeV
0 1 2 3 4 5 6 7 8
10
3×
ATLAS Preliminary
= 8.16 TeV sNN
+Pb p
Data Fit
Signal D0 0+ D Comb. Bkg
Swapped π
k
* < 0.5 y -0.5 <
< 6.0 GeV pT
5.0 <
/ndof = 0.9 χ2
) [MeV]
π (K m π ) - π (K m
140 145 150 155 160 165 170
Weighted Events / 0.5 MeV
0 0.5 1 1.5 2 2.5 3 3.5
10
3×
ATLAS Preliminary
= 8.16 TeV sNN
+Pb p
Data Fit
* Signal
±)
D(
Bkg
* < 0.5 y -0.5 <
< 6.0 GeV pT
5.0 <
) < 1.96 GeV π
K ( m 1.75 <
/ndof = 1.2 χ2
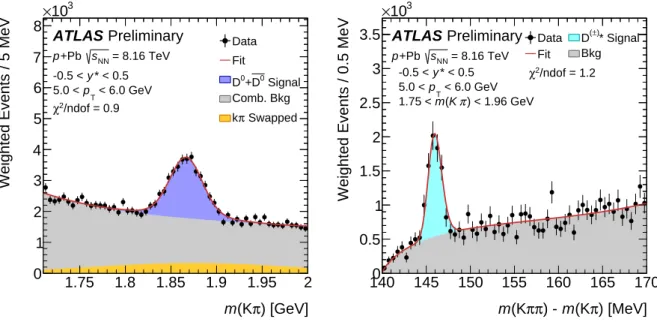
Figure 1: Left: The invariant mass, m(K π) , fits for D
0candidates with 5 < p
T< 6 GeV and − 0 . 5 < y
∗< 0 . 5.
Right: The ∆m = m(K ππ
s) − m(Kπ) fits for D
∗candidates with 5 < p
T< 6 GeV and − 0 . 5 < y
∗< 0 . 5. In both plots, the signal candidates include particles and anti-particles. In the legend, the goodness of the fit is presented as a χ
2divided by the number of degrees of freedom.
model is fixed at value obtained from MC simulation. The combinatorial background contribution is described by a third order Chebychev polynomial. The contribution of signal events with wrong K π mass assignments is described by another Gaussian function constrained using simulations. The D
∗signal ∆m distribution is described by a Novosibirsk function [21], and background events are described using a similar generic function, as used in previous ATLAS measurement [22]. The mean and width parameters in the Novosibirsk function are free, while the parameter controlling the tail of the signal ∆m distribution is fixed to the value obtained from MC simulation. The parameters in the generic background function are fixed to values obtained from fitting a control sample in which the K π secondary vertex associated with the D
∗candidate has an invariant mass with 1 . 70 < m( Kπ) < 1 . 75 GeV or 1 . 96 < m(K π) < 2 . 00 GeV.
About 31k raw D
0signal candidates and 3k raw D
∗signal candidates are collected in total for the yield analysis. Selected fits of D
0and D
∗candidates in p +Pb collisions at √
s
NN= 8 . 16 TeV are shown in Fig. 1.
The sources of systematic uncertainties in the D meson yields incorporate uncertainties related to lumin- osity, acceptance, track reconstruction efficiency corrections, selection cut efficiency corrections, trigger efficiency, prompt D meson fraction estimation, decay branching fraction, and the fit model parametriz- ation. For the relative measurements R
FB, the systematic uncertainties are assessed in the same manner as for the yields, except that in ratios the correlated systematic uncertainties, such as the luminosity uncertainty, cancel out.
The luminosity systematic uncertainties are obtained with a method similar to that for the 2012 pp
collisions [23]. The uncertainty in the acceptance correction is dominated by the statistical uncertainty
associated with the MC correction, and it is propagated to the observables using the pseudo-experiments
similar to those used in Refs. [24, 25]. The systematic uncertainty in the track reconstruction efficiency is
dominated by the uncertainties associated with the ID material distributions as described in Ref. [26], and
it is assigned as the difference between the track reconstruction efficiencies obtained from the nominal MC sample and from those with additional materials. The systematic uncertainties associated with the selection cuts are evaluated by comparing the nominal results to those with either looser or tighter selections. The maximum difference found between the nominal selection and the variation selections is assigned as the systematic uncertainty. The minimum bias trigger is found to be not fully-efficient for events with low multiplicity, so an additional systematic uncertainty is introduced to cover the trigger inefficiency. The systematic uncertainty in the prompt D meson fraction is dominated by the theoretical uncertainties in expectations for non-prompt D meson yield. The uncertainty in the fit procedure is determined by varying the signal and background line shape parameterizations. Eight variations of the D
0fit model and six variations of the D
∗fit model are considered. The total fit model systematic uncertainty is give by the RMS of the differences between the nominal result and all different variation results.
4 D ∗ -h correlation
The study of D meson and hadron correlations in this analysis follows previous ATLAS two-particle correlation analyses [8–10]. For a given event class, the correlations, denoted as D
∗- h correlation, are measured by correlating D
∗candidates with 144 < ∆m < 148 MeV to other charge particles with p
T> 250 MeV in the event, with pseudorapidity separation of |∆η| = |η( D
∗) − η (h) | > 1 . 0, and are presented as a function of the relative azimuthal angle ∆φ = φ( D
∗) − φ(h) , The correlation function is defined as C ( ∆ φ) = S( ∆ φ)/B( ∆ φ) , where S( ∆ φ) and B( ∆ φ) represent self-normalized D
∗- h pair distributions constructed from the same event and from mixed events [27], respectively. The same-event distribution S( ∆φ) is constructed using D
∗- h pairs that can be formed in each event, while B( ∆φ) is constructed by choosing the D
∗and charged particle in each pair from different events that have similar multiplicity. The B(∆φ) distribution does not contain physical correlations, but includes detector effects similar to those in S ( ∆φ). By taking the ratio, detector effects largely cancel. The contributions from D
0–hadron and hadron–hadron correlations are subtracted from the D
∗- h correlation function based on the correlation function measure in the sideband region (150 < ∆m < 170 MeV) of D
∗∆m distributions:
C ( ∆φ ; Signal) = 1
f
sig· {C( ∆φ ; Signal + Background) − (1 − f
sig)C ( ∆φ ; Sideband) }, (3) where f
sigis the D
∗signal fraction inside the signal region, which is extracted from ∆m fit as described above. Examples of the background subtraction procedure is shown in Fig. 2 with the correlation functions before and after background subtraction compared to the correlation function evaluated in the ∆m sideband region.
A template fit procedure, as used in previous ATLAS measurements [10, 28], is used to extract the harmonic coefficients associated with the long-range ridge contribution, using a decomposition based on a template extracted from low-multiplicity events:
C
templ( ∆φ) = C
ridge( ∆φ) + FC
periph( ∆φ)
= G
1 + 2 v
2,2cos ( 2 ∆φ)
+ FC
periph(∆φ), (4)
where F and the v
2,2are the free fit parameters. The parameter G , which represents the magnitude of the
combinatoric component of C
ridge(∆φ) , is fixed by the requirement that the integral of the C
templ(∆φ) and
φ
∆
0 0.5 1 1.5 2 2.5 3
) φ∆ ( C
0.9 0.95 1 1.05 1.1 1.15
ATLAS Preliminary
= 8.16 TeV sNN
+Pb p
Side Bands Before subtraction After subtraction
> 250 MeV
trk
pT
< 80 Nch
10 <
> 1.0 η
∆
φ
∆
0 0.5 1 1.5 2 2.5 3
) φ∆ ( C
0.9 0.95 1 1.05 1.1 1.15
ATLAS Preliminary
= 8.16 TeV sNN
+Pb p
Side Bands Before subtraction After subtraction
> 250 MeV
trk
pT
< 240 Nch
80 <
> 1.0 η
∆
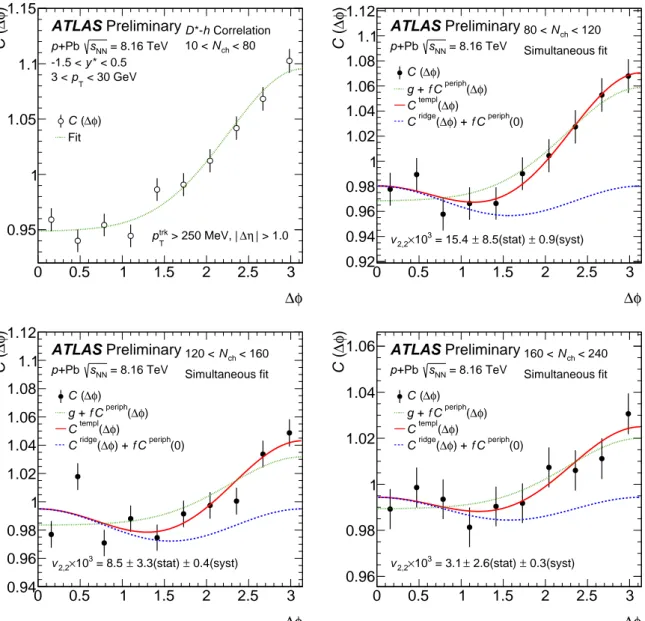
Figure 2: The D
∗- h correlation evaluated in the signal region of 144 < ∆m < 148 MeV before and after background subtraction compared to that in the sideband region of 150 < ∆m < 170 MeV for low multiplicity events with 10 < N
ch< 80 (left) and high multiplicity events with 80 < N
ch< 240 (right). The vertical error bars correspond to statistical uncertainties, while vertical sizes of the boxes around the subtracted correlation function data points indicate the systematic uncertainties.
C (∆φ) be equal. The harmonic coefficient v
2,2quantifies the strength of the cos 2 ∆φ long-range correlation.
The shape of C
periph( ∆φ) is given by the correlation function at p +Pb events with 10 < N
ch< 80 (low multiplicity). To use this template in the higher N
chintervals, the low multiplicity correlation function is fit simultaneously with the higher multiplicity correlation function, in order to incorporate the statistical uncertainty in both the low multiplicity and higher multiplicity correlation functions into the statistical uncertainty on the v
2,2parameter.
The systematic uncertainties in the D
∗- h correlation function is mainly introduced by the background subtraction procedure, which incorporates uncertainties related to the signal fraction estimation and the background correlation function estimation. The uncertainty on the signal fraction includes the statistical uncertainties on the parameters in the ∆m fit to the D
∗events, and the systematic uncertainty due to its dependence on N
ch. Correlation functions evaluated in different ∆m sideband regions are used to estimate the dependence of the background correlation on ∆m . The difference found in correlation functions from different ∆m sidebands is assigned as the systematic uncertainty in the background correlation function estimation. The systematic uncertainties associated with the v
2,2parameter obtained from template fits incorporate the systematic uncertainties in both the low multiplicity reference and the high multiplicity correlation functions being fitted.
5 Results
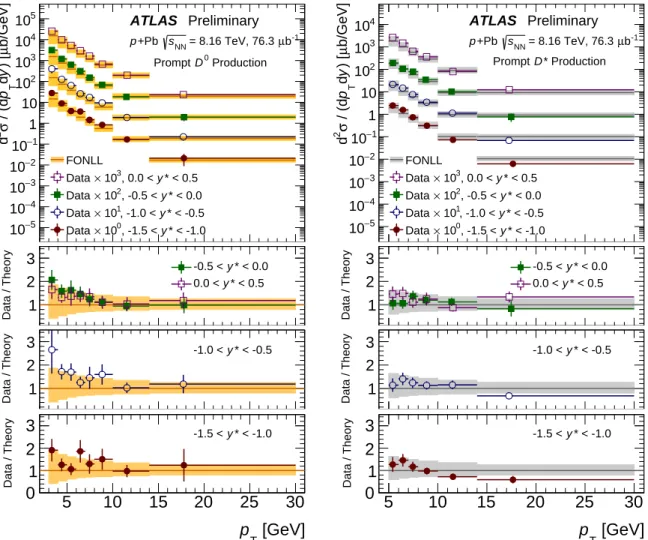
Figure 3 shows the differential cross section of prompt D
0and D
∗as a function of p
Tfor in four center of mass rapidity intervals in p +Pb collisions at √
s
NN= 8 . 16 TeV. Fig. 4 shows the differential cross section
[GeV]
pT
5 10 15 20 25 30
b/GeV] µ ) [ y d
Tp / (d σ
2d
−5
10
−4
10
−3
10
−2
10
−1
10 1 10 10
210
310
410
5ATLAS Preliminary
b-1
µ = 8.16 TeV, 76.3 sNN
+Pb p
Production D0
Prompt
FONLL
* < 0.5 y , 0.0 <
103
× Data
* < 0.0 y , -0.5 <
102
× Data
* < -0.5 y , -1.0 <
101
× Data
* < -1.0 y , -1.5 <
100
× Data
5 10 15 20 25 30
Data / Theory
1 2
3
-0.5 < y* < 0.0* < 0.5 y 0.0 <
5 10 15 20 25 30
Data / Theory
1 2
3
-1.0 < y* < -0.5[GeV]
p
T5 10 15 20 25 30
Data / Theory
0 1 2
3
-1.5 < y* < -1.0[GeV]
pT
5 10 15 20 25 30
b/GeV] µ ) [ y d
Tp / (d σ
2d
−5
10
−4
10
−3
10
−2
10
−1
10 1 10 10
210
310
4ATLAS Preliminary
b-1
µ = 8.16 TeV, 76.3 sNN
+Pb p
* Production D
Prompt
FONLL
* < 0.5 y , 0.0 <
103
× Data
* < 0.0 y , -0.5 <
102
× Data
* < -0.5 y , -1.0 <
101
× Data
* < -1.0 y , -1.5 <
100
× Data
5 10 15 20 25 30
Data / Theory
1 2
3
-0.5 < y* < 0.0* < 0.5 y 0.0 <
5 10 15 20 25 30
Data / Theory
1 2
3
-1.0 < y* < -0.5[GeV]
p
T5 10 15 20 25 30
Data / Theory
0 1 2
3
-1.5 < y* < -1.0Figure 3: The differential cross sections of prompt D
0(left) and D
∗(right) productions as a function of y
∗for D
0p
Trange of 3 < p
T< 30 GeV and D
∗p
Trange of 5 < p
T< 30 GeV in p +Pb collisions at √
s
NN= 8 . 16 TeV. The horizontal position of each data point indicates the mean of the weighted p
Tdistribution. The vertical error bars correspond to the combination of the statistical and systematic uncertainties, and the horizontal bars represent the size of the p
Tinterval.
of prompt D
0and D
∗as a function of y
∗for the D
0p
Trange 3 < p
T< 30 GeV, and for the D
∗p
Trange 5 < p
T< 30 GeV in p +Pb collisions at √
s
NN= 8 . 16 TeV. The measured charmed meson cross sections in p +Pb are compared to FONLL predictions [19] with CTEQ6.6 parton distribution function [29] for pp collisions, scaled by the mass number of the Pb nucleus, A = 208 , with c -to-charmed-meson fraction adapted from Ref. [30]. The FONLL predictions at 8 . 16 TeV are obtained by multiplying the calculations at 8 TeV by a factor of 1 . 02, determined using linear extrapolation of the predictions from 7 to 8 . 16 TeV.
The FONLL uncertainties include renormalisation and factorization scale variations, charm quark mass and parton distribution function uncertainties as detailed in Ref. [19] for pp collisions. The measured charm meson production cross sections are compatible with the FONLL predictions within uncertainties over the measured kinematic ranges.
Figure 5 shows the prompt D meson R
FBas a function of D meson p
T. The measured R
FB, for both prompt
* y
−1.5 −1 −0.5 0 0.5
b]µ [ ydσd
0 20 40 60 80 100 120
140 ATLAS Preliminary
b-1
µ = 8.16 TeV, 76.3 sNN
+Pb p Production D0
Prompt < 30 GeV pT
3 <
FONLL
* y
−1.5 −1 −0.5 0 0.5
b]µ [ ydσd
2 4 6 8 10 12
14 ATLAS Preliminary
b-1
µ = 8.16 TeV, 76.3 sNN
+Pb p
* Production D Prompt
< 30 GeV pT
5 <
FONLL
Figure 4: The differential cross sections of prompt D
0(left) and D
∗(right) productions as a function of y
∗for D
0p
Trange of 3 < p
T< 30 GeV and D
∗p
Trange of 5 < p
T< 30 GeV in p +Pb collisions at √
s
NN= 8 . 16 TeV. The horizontal position of each data point indicates the mean of the weighted y
∗distribution. The vertical error bars correspond to the statistical uncertainties. The horizontal sizes of the colored boxes around data points represent the size of the y
∗interval, and the vertical sizes correspond to the systematic uncertainties.
[GeV]
pT
5 10 15 20 25 30
FBR
0 0.2 0.4 0.6 0.8 1 1.2 1.4 1.6 1.8 2
ATLAS Preliminary
= 8.16 TeV sNN
+Pb p
π
→K D0
Prompt
Forward, 0 < y* < 0.5 Backward, -0.5 < y* < 0
[GeV]
pT
5 10 15 20 25 30
FBR
0 0.2 0.4 0.6 0.8 1 1.2 1.4 1.6 1.8 2
ATLAS Preliminary
= 8.16 TeV sNN
+Pb p
πs
π
→K πs
D0
→
* D Prompt
Forward, 0 < y* < 0.5 Backward, -0.5 < y* < 0
Figure 5: Forward to backward yield ratio, R
FB, of prompt D
0(left) and D
∗(right) as a function of p
Tin p +Pb collisions at √
s
NN= 8 . 16 TeV. The vertical error bars cover only statistical uncertainties. The horizontal sizes of the boxes around data points represent the bin width, while the vertical sizes of the boxes indicate the systematic uncertainties.
D
0and D
∗, shows no significant deviations from unity which indicates no significant modification of the D meson production at − 0 . 5 < y
∗< 0 compared to that at 0 < y
∗< 0 . 5 in the p +Pb collisions. In a recent LHCb measurement [7], the D meson R
FBis found to be 0 . 6 ∼ 0 . 7 at 2 . 5 < | y
∗| < 4 . 0 and p
T< 6 GeV.
The two measurements indicate that the CNM effects have strong p
Tand rapidity dependence. The measured D
0and D
∗results are statistically correlated due to the fact that there is always a D
0candidate for each reconstructed D
∗.
The resulting D
∗- h correlation functions with template fits are shown in Fig. 6 in four multiplicity intervals.
In events with low multiplicity, 10 < N
ch< 80, the D
∗- h correlation function is consistent with being
flat at ∆φ ∼ 0 which indicates a near-side ridge with a small amplitude. In events with N
ch> 80, the
φ
∆
0 0.5 1 1.5 2 2.5 3
) φ∆ ( C
0.95 1 1.05 1.1 1.15
ATLAS Preliminary
= 8.16 TeV sNN
+Pb p
* < 0.5 y -1.5 <
< 30 GeV pT
3 <
Correlation h
*- D
< 80 Nch
10 <
φ)
∆ ( C Fit
> 1.0 η
∆ > 250 MeV,
trk
pT
φ
∆
0 0.5 1 1.5 2 2.5 3
) φ∆ ( C
0.92 0.94 0.96 0.98 1 1.02 1.04 1.06 1.08 1.1 1.12
ATLAS Preliminary
= 8.16 TeV sNN
+Pb p
< 120 Nch
80 <
Simultaneous fit φ)
∆ ( C
φ)
∆
periph( C f + g
φ)
∆
templ( C
periph(0) C f φ) +
∆
ridge( C
0.9(syst)
± 8.5(stat)
± = 15.4 103 2,2× v
φ
∆
0 0.5 1 1.5 2 2.5 3
) φ∆ ( C
0.94 0.96 0.98 1 1.02 1.04 1.06 1.08 1.1 1.12
ATLAS Preliminary
= 8.16 TeV sNN
+Pb p
< 160 Nch
120 <
Simultaneous fit φ)
∆ ( C
φ)
∆
periph( C f + g
φ)
∆
templ( C
periph(0) C f φ) +
∆
ridge( C
0.4(syst)
± 3.3(stat)
± = 8.5 103 2,2× v
φ
∆
0 0.5 1 1.5 2 2.5 3
) φ∆ ( C
0.96 0.98 1 1.02 1.04
1.06 ATLAS Preliminary
= 8.16 TeV sNN
+Pb p
< 240 Nch
160 <
Simultaneous fit φ)
∆ ( C
φ)
∆
periph( C f + g
φ)
∆
templ( C
periph(0) C f φ) +
∆
ridge( C
0.3(syst)
± 2.6(stat)
± = 3.1 103 2,2× v