ATLAS-CONF-2012-115 14August2012
ATLAS NOTE
ATLAS-CONF-2012-115
August 12, 2012
Measurement of inclusive jet charged particle fragmentation functions in Pb + Pb collisions at √
s
NN= 2.76 TeV with the ATLAS detector
The ATLAS Collaboration
Abstract
Measurements of charged particle fragmentation functions of jets produced in ultra- relativistic nuclear collisions are expected to provide insight on the modification of parton showers in the hot, dense medium created in the collisions. ATLAS has measured jets in
√sNN =
2.76 TeV Pb+Pb collisions using a data set recorded in 2011 with an integrated luminosity of 0.14 nb
−1. Jets were reconstructed using the anti-k
talgorithm with distance parameter values
R=0.2, 0.3 and 0.4. Distributions of charged particle transverse momen- tum (
pT) and longitudinal momentum fraction (z
≡ ~pTchg·~pTjet/|~pTjet|) are reported for sevenbins in collision centrality for jet
pT >85, 92, and 100 GeV, respectively, for
R =0.2, 0.3, and 0.4. Ratios of fragmentation spectra to the spectra in the 60-80% central bin are pre- sented. Those ratios show a reduction of fragment yield in central collisions relative to the 60-80% bin at intermediate
zvalues, 0.05
.z.0.2 and an enhancement in fragment yield for
z.0.05. No significant modification is observed at large
z.c
Copyright 2012 CERN for the benefit of the ATLAS Collaboration.
Reproduction of this article or parts of it is allowed as specified in the CC-BY-3.0 license.
1 Introduction
Collisions between lead nuclei at the LHC are thought to produce a quark-gluon plasma (QGP), a form of strongly interacting matter in which quarks and gluon become locally deconfined. One predicted consequence of QGP formation is the “quenching” of jets generated in hard-scattering processes during the initial stages of the nuclear collisions [1]. Jet quenching refers, collectively, to a set of possible modifications of parton showers by the QGP through interactions of the constituents of the shower with the color charges in the plasma [2]. In particular, quarks and gluons in the shower may be elastically or inelastically scattered resulting in both deflection and energy loss of the constituents of the shower.
The deflection and the extra radiation associated with inelastic processes may broaden the parton shower and eject partons out of an experimental jet cone [2, 3]. As a result, jet quenching can potentially both soften the spectrum of fragment hadrons and reduce the total energy of a reconstructed jet. A complete characterization of the e
ffects of jet quenching therefore requires both measurements of the single jet suppression and of jet fragment distributions.
Observations of modified dijet asymmetry distributions [4–6], modified balance jet transverse mo- mentum ( p
T) distributions in γ-jet events [7], and suppressed inclusive jet yield in Pb
+Pb collisions at the LHC [8] are consistent with theoretical calculations of jet quenching. However, it has been argued that those measurements do not su
fficiently discriminate between calculations that make di
fferent as- sumptions regarding the relative importance of the contributions described above [9]. But, based on the above arguments, theoretical analyses are incomplete without experimental constraints on the theoretical description of jet fragment distributions. First measurements of jet fragmentation functions by CMS [10]
in Pb
+Pb collisions at the LHC show no significant modification, but the uncertainties on that measure- ment were not sufficient to exclude modifications at the level of
∼10%. Also the use of the ξ
≡ln(1/z) variable in that analysis may limit the sensitivity of the measurement to modifications that are not at the extremes of the z range.
This note presents measurements of charged particle jet fragmentation functions in
√s
NN=2.76 TeV Pb+Pb collisions using 0.14 nb
−1of data recorded in 2011. The jets used in the measurements were reconstructed with the anti-k
t[11] algorithm using distance parameter values R
=0.2, 0.3, and 0.4.
Results are presented for the transverse momentum (p
T) and longitudinal momentum fraction (z
≡~ p
Tchg·~ p
Tjet/|~ p
Tjet|) distributions of charged particles detected within an angular range∆R
trk< 0.4 of the reconstructed jet directions for jets with p
jetT> 85, 92, and 100 GeV respectively for R
=0.2, 0.3, and 0.4. Here,
∆R
= p∆
φ
2+ ∆η
2where
∆φ (∆ η) is the difference in azimuthal angles (pseudorapidities) between the charged particle and jet directions. The p
jetTthresholds for the three R values were chosen to match the R-dependence of the measured transverse momentum of a typical jet.
2 Experimental setup
The measurements presented in this paper were performed using the ATLAS calorimeter, inner detec- tor, trigger, and data acquisition systems [12]. The ATLAS calorimeter system consists of a liquid argon (LAr) electromagnetic (EM) calorimeter covering
|η|< 3.2, a steel-scintillator sampling hadronic calorimeter covering
|η|< 1.7, a LAr hadronic calorimeter covering 1.5 <
|η|< 3.2, and two LAr forward calorimeters (FCal) covering 3.2 <
|η|< 4.9
1. The hadronic calorimeter has three longitudinal sampling layers and has a
∆η
×∆φ granularity of 0.1
×0.1 for
|η|< 2.5 and 0.2
×0.2 for 2.5 <
|η|< 4.9
2. The EM
1ATLAS uses a right-handed coordinate system with its origin at the nominal interaction point (IP) in the center of the detector and thez-axis along the beam pipe. Thex-axis points from the IP to the center of the LHC ring, and theyaxis points upward. Cylindrical coordinates (r, φ) are used in the transverse plane,φbeing the azimuthal angle around the beam pipe. The pseudorapidity is defined in terms of the polar angleθasη=−ln tan(θ/2).
2An exception is the third sampling layer that has a segmentation of 0.2×0.1 up to|η|=1.7.
calorimeters are longitudinally segmented into three compartments with an additional pre-sampler layer.
The EM calorimeter has a granularity that varies with layer and pseudorapidity, but which is generally much finer than that of the hadronic calorimeter. The middle sampling layer, which typically has the largest energy deposit in EM showers, has a granularity of 0.025
×0.025 over
|η|< 2.5.
The inner detector [13] measures charged particles within the pseudorapidity interval
|η|< 2.5 using a combination of silicon pixel detectors, silicon microstrip detectors, and a straw tube transition radiation tracker, all immersed in a 2 T axial magnetic field. All three detectors are composed of a barrel and two symmetrically placed end-cap sections. The pixel detector is composed of three layers of sensors with nominal feature size 50 µm
×400 µm. The silicon strip barrel section contains four layers of modules with 80 µm pitch sensors on both sides, while the end-caps consists of nine layers of double-sided modules with radial strips having a mean pitch of 80 µm. The two sides of each layer in both the barrel and the end-caps have a relative stereo angle of 40 mrad. The transition radiation tracker contains up to 73 (160) layers of staggered straws interleaved with fibres in the barrel (end-cap). Charged particles with p
T &0.5 GeV and
|η|< 2.5 will typically traverse three layers of silicon pixel detectors, four layers of double-sided microstrip sensors, and 36 straws.
Minimum bias Pb+Pb collisions were identified using measurements from the zero degree calorime- ters (ZDCs) and the minimum-bias trigger scintillator (MBTS) counters [12]. The ZDCs are located symmetrically at z
= ±140 m and cover |η|> 8.3. In Pb
+Pb collisions the ZDCs measure primarily
“spectator” neutrons, which originate from the incident nuclei and do not interact hadronically. The MBTS detects charged particles over 2.1 <
|η|< 3.9 using two counters placed at z
= ±3.6 m. Eachcounter is azimuthally divided into 16 sections, and the MBTS provides measurements of both the pulse heights and arrival times of ionization energy deposits in each section.
Events used in this analysis were selected for recording using a combination of Level-1 minimum- bias and High Level Trigger (HLT) jet triggers. An “OR” of Level-1 ZDC coincidence and total trans- verse energy triggers selected events that were passed to the event filter jet trigger which ran the offline Pb
+Pb jet reconstruction algorithm, described below, for R
=0.2 jets except for the application of the final hadronic energy scale correction. The transverse energy trigger required
ΣE
T> 10 GeV in the calorimeter. The HLT jet algorithm required an R
=0.2 jet energy measured at the electromagnetic en- ergy scale with at least 20 GeV. All such jets found in the event filter were recorded for use in the o
ffline analysis.
3 Event selection and data sets
This analysis uses a total integrated luminosity of 0.14 nb
−1of Pb
+Pb collisions recorded by ATLAS in 2011. All events used in the analysis were required to have either a ZDC coincidence or a total transverse energy in the calorimeter of
ΣE
T> 50 GeV, a reconstructed primary vertex, and a time di
fference between hits in the two sides of the MBTS detector of less than 3 ns. The primary vertices were reconstructed from charged particle tracks with p
T> 500 MeV. The tracks were reconstructed from hits in the inner detector using the standard track reconstruction algorithm [14] with settings optimized for the high hit density in heavy ion collisions [15]. The e
fficiency for a minimum-bias Pb
+Pb collision to pass the applied selections was estimated to be 98
±2%. For the jet fragmentation measurements, only events selected by the HLT jet trigger were analyzed. A total of 14.2 million such triggers passed the event selections described above.
The centrality of Pb+Pb collisions was characterized by
ΣE
FCalT, the total transverse energy measured in the forward calorimeters (FCal) [15]. The results in this note were obtained using seven centrality bins defined according to successive percentiles of the
ΣE
TFCaldistribution ordered from the most central to the most peripheral collisions: 0-10%, 10-20%, 20-30%, 30-40%, 40-50%, 50-60%, and 60-80%.
The percentiles were defined after correcting the
ΣE
FCalTdistribution for the 2% minimum-bias trigger
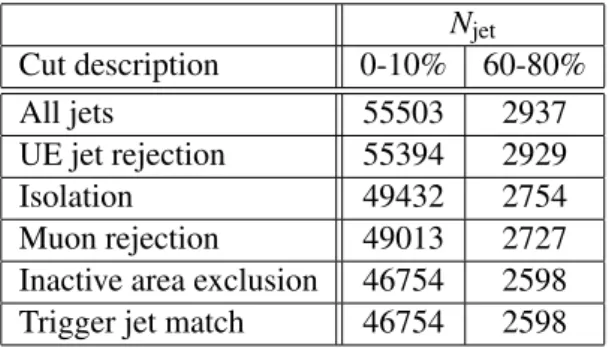
N
jetCut description 0-10% 60-80%
All jets 55503 2937
UE jet rejection 55394 2929
Isolation 49432 2754
Muon rejection 49013 2727
Inactive area exclusion 46754 2598 Trigger jet match 46754 2598
Table 1: The jet cut flow for R
=0.4 jets with p
T> 100 GeV measured in central and peripheral colli- sions. Each line specifies the number of jets passing all cuts for the given line and above.
inefficiency which is concentrated in the most peripheral bins which are not included in this analysis.
The performance of the ATLAS detector and offline analysis in measuring jets and charged particles in the environment of Pb
+Pb collisions was evaluated using a high-statistics Monte Carlo (MC) sample obtained by overlaying simulated [16] PYTHIA [17] hard-scattering events onto 1.2 million minimum- bias Pb+Pb events recorded in 2011. The same number of PYTHIA events were produced for each of five intervals of ˆ p
T, the transverse momentum of outgoing partons in the 2
→2 hard-scattering, with boundaries 17, 35, 70, 140, 280, and 560 GeV. The detector response to the PYTHIA events was simulated using GEANT4 [18], and the simulated hits were combined with the data from the minimum- bias Pb
+Pb events to produce 1.2 million overlaid events for each ˆ p
Tinterval.
4 Jet and charged particle analysis
Charged particles included in the fragmentation measurements were required to have at least two hits in the pixel detector, including a hit in the first pixel layer if such a hit was expected (i.e. if the corresponding sensor was active), and seven hits in the silicon microstrip detector. The following requirements were placed on the longitudinal (z
0sin θ) and transverse (d
0) impact parameters of the tracks measured with respect to the primary vertex:
q
(d
0)
2/d
cov0< 3, (1)
z
0sin θ
, qz
cov0sin
2θ
+sin θ
cov(z
0cos θ)
2< 3 , (2) where d
cov0, z
cov0, and sin θ
cov, are diagonal elements of the track fit covariance matrix for d
0, z
0, and sin θ measurements, respectively. Only charged particles with p
T> 2 GeV are used for the results in this note.
Jets were reconstructed using the techniques described in [8], which are briefly summarized here.
The anti-k
talgorithm was first run in four-vector recombination mode on
∆η
×∆φ
=0.1
×0.1 logical towers for three values of the anti-k
tdistance parameter, R
=0.2, 0.3, and 0.4. The tower kinematics were obtained by summing electromagnetic scale energies of calorimeter cells within the tower boundaries.
Then, a two-step iterative procedure was used to estimate a layer and η-dependent UE energy density
while excluding actual jets from that estimate. The final jet kinematics were obtained by subtracting the
UE energy from each calorimeter cell within the towers included in the reconstructed jet. The subtraction
accounts for a cos 2φ modulation in the energy density of the UE that results from collective motion of
the medium by applying the appropriate modulation to the UE background using a modulation amplitude
measured in the calorimeter. After reconstruction, a correction was applied to account for jets not or only
partially excluded from the second UE estimate. Then, a final η and jet E
T-dependent hadronic energy
scale calibration factor was applied.
<Pixel Hits>
0 1 2 3 4 5 6 7
< 7 GeV
trk
5 < pT
Data 2011 MC 2011
ATLAS Preliminary
=0.14 nb-1
=2.76 TeV, Lint
sNN
Pb+Pb
-2.5 -2 -1.5 -1 -0.5 0 0.5 1 1.5 2 2.5η
Data/MC
0.95 1 1.05
<SCT Hits>
0 2 4 6 8 10 12 14
ATLAS Preliminary
=0.14 nb-1
=2.76 TeV, Lint
sNN
Pb+Pb
-2.5 -2 -1.5 -1 -0.5 0 0.5 1 1.5 2 2.5η
Data/MC
0.95 1 1.05
trkN/N
10-5 10-4 10-3 10-2 10-1 1
10 ATLAS Preliminary
=0.14 nb-1
=2.76 TeV, Lint
sNN
Pb+Pb
[mm]
d0 -0.4 -0.3 -0.2 -0.1 0 0.1 0.2 0.3 0.4
Data/MC
0.5 1 1.5
trkN/N
10-5 10-4 10-3 10-2 10-1
1 ATLAS Preliminary
=0.14 nb-1
=2.76 TeV, Lint
sNN
Pb+Pb
[mm]
θ
0 sin z
-0.4 -0.3 -0.2 -0.1 0 0.1 0.2 0.3 0.4
Data/MC
0.5 1 1.5
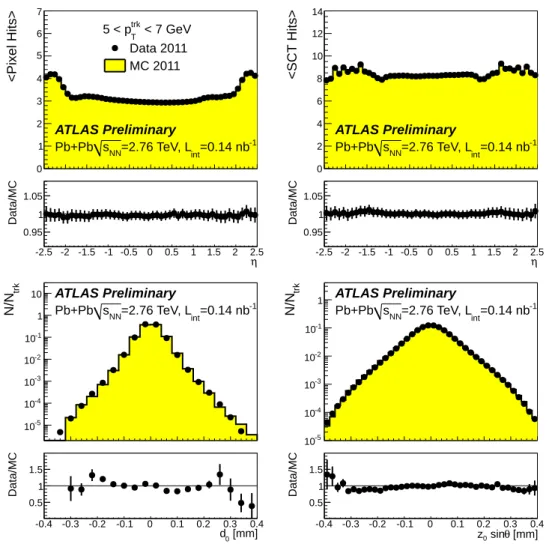
Figure 1: Comparison between data and MC distributions for four di
fferent charged particle recon- struction selection parameters. The distributions are shown for the 0-10% centrality bin and for charged particle transverse momenta in the range 5 < p
T< 7 GeV. Top: average number of pixel (left) and SCT (right) hits per track. Bottom: distributions of track transverse impact parameters, d
0, (left) and longitudinal, impact parameters, z
0sin θ, (right) with respect to the reconstructed vertex.
Separate from the reconstruction of jets using calorimeter data, “track jets” were reconstructed by ap- plying the anti-k
talgorithm with R
=0.4 to reconstructed charged particles that pass the above-described tracking cuts and have p
trkT> 4 GeV. The p
Tthreshold on the charged particles suppresses contribu- tions of the UE to the track jet measurement such that a typical track jet has less than 4% likelihood of including a charged particle from the UE in central (0-10%) collisions.
Following reconstruction additional selections were applied for the purposes of this analysis. To reject “UE jets” generated by fluctuations in the underlying event, jets were required to match within
∆
R < 0.2 either a track jet having p
T> 10 GeV or a reconstructed electromagnetic cluster having p
T> 7 GeV. To prevent neighboring jets from distorting the measurement of the fragmentation functions, jets were required to be isolated. The isolation cut required that there be no other jet within
∆R
=1 having p
T> p
isoTwhere p
isoT, the isolation threshold, is set to half of the analysis threshold for each R value, i.e.
p
isoT =42.5, 46, and 50 GeV for R
=0.2, 0.3, and 0.4, respectively. To prevent muons from semi-leptonic
heavy flavor decays from influencing the measured fragmentation functions, all jets with reconstructed
muons having p
T> 4 GeV within
∆R < 0.4 were excluded from the analysis. To prevent inactive regions
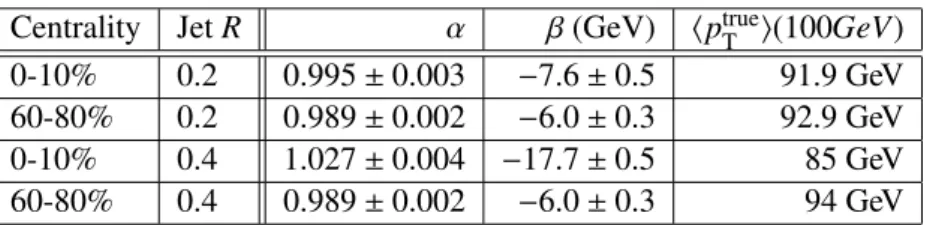
Centrality Jet R α β (GeV)
hptrueT i(100GeV)
0-10% 0.2 0.995
±0.003
−7.6±0.5 91.9 GeV
60-80% 0.2 0.989
±0.002
−6.0±0.3 92.9 GeV
0-10% 0.4 1.027
±0.004
−17.7±0.5 85 GeV
60-80% 0.4 0.989
±0.002
−6.0±0.3 94 GeV
Table 2: Sample values of α and β obtained from linear fits to
hptrueT i(precT) (see text) according to Eq. 3.
in the calorimeters from producing artificial high-z fragments, jets were required to have more than 90%
of their energy contained within fully functional regions of the calorimeter. Finally, all jets included in the analysis were required to match jets reconstructed in the event filter with transverse momenta greater than the trigger threshold. Table 1 demonstrates the jet cut flow for this analysis for central (0-10%) and peripheral (60-80%) collisions.
5 Jet and Track Reconstruction Performance
The performance of the ATLAS detector and analysis procedures in measuring jets was evaluated from the MC sample using the procedures described in [8]. The jet performance is evaluated by comparing reconstructed MC jets to “truth” jets obtained by separately running the anti-k
talgorithm on the final- state PYTHIA particles for the three jet R values used in this analysis. For the purposes of this note, the most important aspect of the jet performance is the jet energy resolution (JER). For jet energies
&
100 GeV, the JER in central (0-10%) collisions for R
=0.4 jets has comparable contributions from UE fluctuations and “intrinsic” resolution of the calorimetric jet measurement. For peripheral collisions and R
=0.2 jets, the intrinsic fluctuations dominate the JER. The combination of the finite JER and the steeply falling spectrum will produce a net migration of jets from lower p
Tto higher p
Tvalues (hereafter referred to as “upfeeding”) such that a jet reconstructed with a given p
recTwill correspond, on average, to a lower truth jet p
T,
hptrueT i. The relationship between
hptrueT iand p
recThas been evaluated from the MC data set for the different centrality bins and three R values used in this note. For the jet p
recTvalues used in this analysis, that relationship is well described by a linear dependence,
hptrueT i=
αp
recT +β. (3)
Sample values for α and β and the resulting
hp
trueT ivalues for R
=0.2 and R
=0.4 jets in peripheral and central collisions are listed in Table 2. The extracted relationships between p
recTand
hptrueT iwill be used in the fragmentation analysis to correct for the average shift in the measured jet energy.
The efficiency for reconstructing charged particles within jets in Pb+Pb collisions was evaluated using the MC sample. Fig. 1 shows comparisons of distributions of four important track quality variables between data and MC for reconstructed tracks over a narrow p
Tinterval 5 < p
T< 7 GeV to minimize the impact of differences in MC and data charged particle p
Tdistributions. The agreement between data and MC for all four variables is very good.
For the purpose of evaluating the track reconstruction performance and for the evaluation of re-
sponse matrices that are used in the unfolding (described below), the reference “truth” particles were
defined as all particles with lifetime longer than 0.3
·10
−10s originating from the primary interaction or
from subsequent decay of particles with shorter lifetime. These were matched to reconstructed charged
particles using associations between detector hits and truth tracks recorded by the ATLAS GEANT sim-
ulations. Truth particles for which no matching reconstructed particle were found were considered lost
due to ine
fficiency. The charged particle reconstruction e
fficiency, ε(p
T, η), was evaluated as a function
of truth particle p
Tfor particles within reconstructed R
=0.4 jets with p
trueT> 100 GeV for the seven
[GeV]
true
pT
10 102
Efficiency
0.5 0.6 0.7 0.8 0.9 1
0-10% + fit 60-80% + fit
ATLAS Preliminary Simulation
=2.76 TeV sNN
Pb+Pb
PYTHIA Overlay
|<1 η
|
Figure 2: Charged particle reconstruction efficiency as a function of truth p
T, p
trueT, for 0-10% (red) and 60-80% (black) centrality bins in the region
|η|< 1. The p
Tvalues for the 0-10% points have been shifted for clarity. The solid curves show the results of fits (see text).
centrality bins used in this note. No significant dependence of the e
fficiency on jet p
Twas observed.
The η and p
Tdependence of the reconstruction efficiency for the charged particle transverse momentum range included in the measurement was found to factorize so the efficiency was parameterized using ε( p
T, η)
=ε( p
T)
×ε(η). ε(η) was found to to be independent of η within the
|η|< 1 except for localized reductions due to inactive modules in the silicon detectors. For
|η|> 1, ε(η) decreases by approximately 10% relative to
|η|< 1 except for a localized region 1.0 <
|η|< 1.3 covering the transition from the barrel to the end-cap portions of the silicon microstrip detector where the e
fficiency decreases by 20%. ε( p
T) was evaluated over
|η|< 1 yielding the results shown in Fig. 2 for the 0-10% and 60-80% centrality bins.
The efficiency is nearly constant for the p
Trange used in the measurement, p
T> 2 GeV, but a weak variation can be observed in the figure. That variation was parameterized by fitting the e
fficiencies to polynomials in ln( p
T); the results of the fits are shown as the solid curves on the figure.
6 Fragmentation functions and unfolding
Jets used for the fragmentation measurements presented here were required to have
|η|< 2.1 and p
T>
85, 92 and 100 GeV for R
=0.2, 0.3, and 0.4 jets, respectively. The η restriction maintains complete tracking coverage for reconstructed jets out to
∆R
=0.4. The jet thresholds for R
=0.3 and R
=0.2 jets represent the typical energy measured with the smaller jet radii for an R
=0.4 jet with p
T =100 GeV.
The fragmentation functions presented in this note were measured for charged particles with p
T> 2 GeV within an angular range
∆R < 0.4 of the jet direction for all three R values used in the jet reconstruction.
To reduce the e
ffects of the UE broadening of the jet position measurement, for R
=0.3 and R
=0.4 jets the jet direction was taken from that of the closest matching R
=0.2 jet within
∆R < 0.3 when such a matching jet was found. For each charged particle, the longitudinal jet momentum fraction, z, was calculated according to
z
=p
chT/p
jetTcos
∆R, (4)
where
∆R here represents the angle between the charged particle and jet directions. Two different sets of charged particle fragment distributions were measured for each centrality bin and R value:
D
meas( p
T)
≡1 N
jet1 ε
∆
N
ch( p
T)
∆
p
T(5)
D
meas(z)
≡1 N
jet1 ε
∆
N
ch(z)
∆
z (6)
where N
jetrepresents the total number of measured jets in the given centrality bin,
∆N
ch( p
T) and
∆N
ch(z) represent the number of measured charged particles within
∆R
=0.4 of the jets in given bins of p
Tand z, respectively, and ε represents the MC-evaluated reconstruction e
fficiency. The e
fficiency correction was applied on a per-particle basis using the parameterized MC efficiency assuming p
trueT =p
recT. While that assumption is not strictly valid, the e
fficiency varies su
fficiently slowly with p
trueTthat the error introduced by this assumption is
.1% everywhere.
Charged particles from the UE will contribute a p
Tand centrality-dependent background to D
meas(z) and D
meas( p
T) that must be subtracted to obtain the true jet fragment distributions. The contribution of the UE background was separately evaluated for R
=0.2, 0.3, and 0.4 jets in events having at least one such jet above the jet p
Tthresholds using a grid of R
=0.4 cones that spanned the full coverage of the inner detector. Any such cone having a charged particle with p
T> 4 GeV was assumed to be associated with a real jet in the event and was excluded from the UE background determination. That threshold was chosen to be low enough to have a high efficiency for excluding particles associated with jets from the background estimate, but high enough that the contribution of the UE above the threshold to the fragmentation functions was small enough to be neglected in the subtraction, but included in the systematic uncertainties. The resulting per-jet UE charged particle yields, dn
UEch/d p
Twere evaluated over 2 < p
chT< 4 GeV as a function of charged particle p
T( p
chT), jet p
T( p
jetT) and jet η (η
jet) averaged over all cones in all events within a given centrality bin according to
dn
UEchd p
T =1
N
cone∆
N
chcone( p
chT, p
jetT, η
jet)
∆
p
T. (7)
Here N
conerepresents the number of background cones in all events with the given centrality bin having a jet of a given radius above the corresponding p
Tthreshold, and
∆N
chconerepresents the number of charged particles in a given p
chTbin in all such cones evaluated for jets with a given p
jetTand η
jet. Not shown in Eq. 7 is a correction factor that was applied to each background cone to correct for the di
fference in the average UE particle yield at a given p
chTbetween the η position of the cone and η
jet.
By evaluating the UE contribution only from events containing jets included in the analysis, the background automatically has the correct distribution of centralities within a given centrality bin. The dn
UEch/d p
Tis observed to be independent of jet p
Tboth in the data and MC. That observation excludes the possibility that the upfeeding of jets in p
Tdue to the finite JER could induce a dependence of the UE on jet p
T. However, such upfeeding was observed to induce in the MC a p
jetT-independent, but centrality dependent mismatch between the extracted dn
UEch/d p
Tand the actual UE contribution to reconstructed jets. That mismatch was found to result from intrinsic correlations between the charged particle density in the UE and the MC jet p
Terror,
∆p
jetT =p
jet,recT −p
trueT. In particular, jets with positive (negative)
∆p
jetTare found to have an UE contribution larger (smaller) than jets with
∆p
jetT ∼0. Because the net upfeeding on the falling jet spectrum, the selection of jets above a given p
jetTthreshold causes the UE contribution to be larger than that estimated from the above-described procedure. The fractional mismatch in the estimated UE background was found to be independent of p
chTand centrality and to be 1.02, 1.07, and 1.12 respectively for R
=0.2, 0.3, and 0.4, respectively. The measured
dn
UEchd pT
values in the data were
multiplied by these same factors before being applied.
The estimated UE backgrounds were subtracted from D
meas(p
T) and D
meas(z) to obtain background- subtracted fragmentation distributions D
sub(p
T) and D
sub(z) using:
D
sub( p
T)
=D
meas( p
T)
−dn
UEchd p
T, (8)
and
D
sub(z)
=D
meas(z)
−dn
UEchd p
T( p
chT =zp
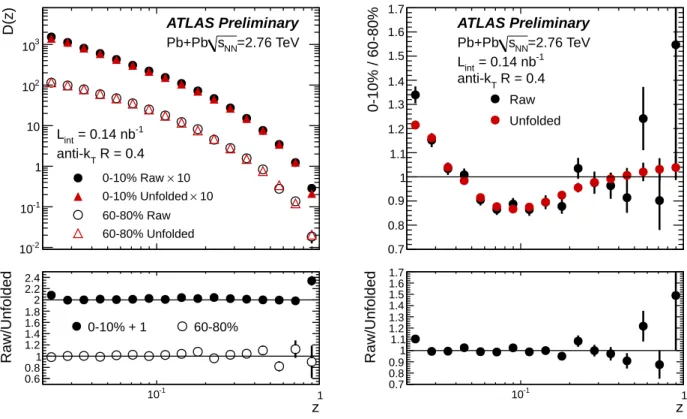
jetT). (9) The top left panel in Figure 3 shows subtracted D
sub(z) distributions for R
=0.4 jets in the 0-10%
and 60-80% centrality bins. The top right panel shows the ratio of D
sub(z) between central (0-10%) and peripheral (60-80%) collisions, R
subD(z) ≡D
sub(z)|
0−10/D
sub(z)|
60−80. That ratio indicates an enhanced fragment yield at low z, z
.0.03 in jets in the 0-10% centrality bin compared to jets in the 60-80%
centrality bin and a suppressed yield of fragments with z
∼0.1. No such di
fference in 0-10% and 60-80% D
sub( p
T) distributions are observed in the MC at either low or intermediate p
T; the central to peripheral ratio of MC D
sub( p
T) distributions for R
=0.4 jets (not shown) is within 4% of one for all p
chT. The D
sub( p
T) and D
sub(z) distributions have been unfolded using a one-dimensional Singular Value Decomposition (SVD) method [19] implemented in
RooUnfold[20] to remove the effects of charged particle and jet p
Tresolution. The SVD method implements a regularized matrix-based unfolding that attempts to “invert” the equation
b = Axwhere
x, is a true spectrum, bis an observed spectrum and
Ais the “response matrix” that describes the transformation of
xto
b. ForD( p
T), the unfolding accounts only for the charged particle p
Tresolution and uses a response matrix derived from the MC data set that describes the distribution of reconstructed p
chTas a function of MC truth p
chT. The response matrix
A(p
recT, p
trueT) is filled out for truth and reconstructed jets and particles using the procedures described in Sec. 5. For D(z) the unfolding was accounted for both charged particle and jet resolution using a response matrix
A(zrec, z
true) with z
true(z
rec) calculated using purely truth (reconstructed) quantities. A cross-check was performed for the D(z) unfolding that accounted only for the jet energy resolution to ensure that the combination of the two sources of resolution in the one-dimensional unfolding did not introduce systematics in the result. Because the D
sub(z) and D
sub(p
T) distributions were already corrected for the charged particle reconstruction efficiency, the response matrices were only populated with truth particles for which a reconstructed particle was obtained and each entry was corrected for reconstruction e
fficiency so as to not distort the shape of the true distributions.
To ensure that statistical fluctuations in the MC p
trueTor z
truedistributions do not distort the unfolding, the p
trueTand z
truedistributions were smoothed by fitting them to appropriate functional forms. The truth D(p
T) distributions were fit to polynomials in ln(p
T). The truth D(z) distributions were fit to the standard functional form [21],
D(z)
=a
·z
c1(1
−z)
c2·(1
+b
·(1
−z)
c3), (10) where a, b, c
iwere free parameters of the fit. When filling the truth spectra (x
ini) and response matrices, the entries were weighted to match the truth spectra to the fit functions. The statistical uncertainties in the unfolded spectra were obtained using the pseudo-experiment method [19]. The SVD unfolding was performed using a regularization parameter obtained from the 6th singular value of the unfolding matrix.
Unfolded fragmentation functions, D(z), are shown in the top left panel in Fig. 3 and compared
to the corresponding D
sub(z) distributions for R
=0.4 jets in central (0-10%) and peripheral (60-80%)
collisions. The ratios of unfolded to subtracted distributions are shown in the bottom left panel with
the ratio for 0-10% centrality bin o
ffset by
+1. The ratios show that the unfolding has minimal impact
on the fragmentation functions in both peripheral and central collisions. Only the largest z point in the
0-10% bin changes by more than 20%. The top right panel in the figure shows the ratio of unfolded D(z)
distributions, R
D(z) ≡D(z)|
0−10/D(z)|
60−80compared to the ratio before unfolding, R
subD(z). The unfolding
z
D(z)
10-2
10-1
1 10 102
103
× 10 0-10% Raw
× 10 0-10% Unfolded 60-80% Raw 60-80% Unfolded
ATLAS Preliminary
=2.76 TeV sNN
Pb+Pb
= 0.14 nb-1
Lint
R = 0.4 anti-kT
z
10-1 1
Raw/Unfolded
0.6 0.8 1 1.2 1.4 1.6 1.8 2 2.2 2.4
0-10% + 1 60-80%
z
0-10% / 60-80%
0.7 0.8 0.9 1 1.1 1.2 1.3 1.4 1.5 1.6 1.7
Raw Unfolded ATLAS Preliminary
=2.76 TeV sNN
Pb+Pb = 0.14 nb-1
Lint
R = 0.4 anti-kT
z
10-1 1
Raw/Unfolded
0.7 0.8 0.9 1 1.1 1.2 1.3 1.4 1.5 1.6 1.7
Figure 3: Subtracted and unfolded D(z) distributions for R
=0.4 jets in central (0-10%) and peripheral (60-80%) collisions. Top left: D
sub(z) and D(z) distributions, bottom left: ratios of subtracted to unfolded distributions with the 0-10% shifted by
+1 for clarity, Top right: central to peripheral ratios of subtracted (R
subD(z)) and unfolded (R
D(z)) distributions, bottom right: ratio of R
subD(z)to R
D(z).
reduces the ratio at low z but otherwise leaves the shape unchanged. The suppression of the statistical uncertainties inherent in the SVD method can be seen at larger z where R
D(z)is much smoother than R
subD(z). It should be noted that there is no property of the unfolding method that prefers R
D(z) →1 for z
→1 though that result is clearly demonstrated in the figure. To evaluate the impact of the unfolding on the di
fference between central and peripheral fragmentation functions, the bottom right panel in Fig. 3 shows the ratio of R
subD(z)to R
D(z). Except for the lowest z point, the ratio is consistent with one over the entire z range. Thus, the features observed in R
subD(z), namely the enhancement at low z in central collisions relative to peripheral collisions and the modest suppression at intermediate z are robust with respect to the effects of the charged particle and jet p
Tresolution.
7 Systematic uncertainties
Systematic uncertainties in the unfolded D(z) and D( p
T) distributions can arise due to uncertainties in
the jet energy scale and jet energy resolution, from limitations in the unfolding procedure including
uncertainties in the shape of the truth distributions, uncertainties in the charged particle reconstruction
efficiency, and due to limitations of the UE subtraction procedure. The uncertainty on the jet energy scale
(JES) and jet energy resolution (JER) have been evaluated in a similar manner as in the jet suppression
measurement [8]. The systematic uncertainty due to the JES has two components: the first is the sys-
tematic uncertainty in the JES between central and peripheral collisions; the second is the absolute JES
uncertainty. The first uncertainty due to the JES was evaluated by shifting the jet p
Tof all measured jets
up and down by 0.5% - 1.5% depending on the centrality. The size of the shift reflects the uncertainty on
the JES evaluated using a data driven technique where the calorimeter jets have been matched to track jets [8]. The second source, the absolute JES uncertainty divides out in the ratio of D(z) and D( p
T) distributions. A
±2% shift has been applied on distributions measured in peripheral collision in order to account for the absolute JES uncertainty [22]. The resulting uncertainty on distributions measured in peripheral events have been propagated into other centrality bins as well.
The systematic uncertainty coming from the disagreement between the JER in the data and MC has been factorized into two uncertainties. The first uncertainty describes the impact of the JER uncertainty on the minimum jet p
Tthreshold used in the measurement. The second uncertainty describes the impact of the JER uncertainty on actual distributions. The first uncertainty due to JER was evaluated using the modified correction factors that account for an average shift in the jet p
Tdue to the effect of JER smearing on steeply falling spectra as described in Sec.5. Each MC reconstructed jet entering the evaluation of the correction factors has been smeared to account for the intrinsic detector JER uncertainty and for the uncertainty due to a difference between the fluctuations of UE in the data and MC. The evaluation of the intrinsic detector JER uncertainty follows the procedure applied in p
+p jet measurements [23].
The evaluation of the uncertainty due to a di
fference between the fluctuations of UE in the data and MC follows the procedure described in [8] where the uncertainty is calculated based on a 2.5
−10%
modification of “noise” term in the MC parameterization of the JER. The same procedure has been used to evaluate the impact of the JER uncertainty on the actual distributions. However, in this case the modified response matrices have been derived and the distributions were unfolded using these new response matrices. The di
fference between the newly unfolded result and the original constitutes the uncertainty. The uncertainty due to the JER is rather high mainly in the central collisions for the largest values of z and p
Texceeding as much as 10% in the last p
Tor z bin.
The systematic uncertainty associated with the unfolding is connected with the sensitivity of the unfolding procedure to the choice of the regularization parameter and to the parameterization of the truth distribution. The choice of a too small regularization parameter implies over-regularization that is cutting out information from the data. The choice of too large regularization parameter amplifies fluctuations in the result of unfolding. To evaluate the systematic uncertainty due to the sensitivity to the choice of the regularization parameter, k we have performed the unfolding with values for the regularization parameter, k
0=k
+1 and k
0=k
+2 respectively. The uncertainty associated with the unfolding is found to be smaller then 5% for both the D(z) and D( p
T) distribution in all the centrality bins. The systematic uncertainty due to the parameterization of the truth distribution was determined from the statistical uncertainties of the fits to these distributions. This systematic uncertainty is below 1% for the D(z) distribution and below 2% for the D(p
T) distribution.
An independent evaluation of potential systematic uncertainties in the central to peripheral ratios of D(z) and D( p
T) due to all aspects of the analysis was obtained by evaluating the deviation of the MC central (0-10%) to peripheral (60-80%) ratios of the fragmentation functions from unity. That deviation is
.4% for all p
Tor z values. To quantify the deviations from unity, the MC R
D(z)and R
D(pT)ratios have been fit by piecewise continuous functions composed of linear functions defined over the z ( p
T) ranges z
=0.02
−0.06 (p
T =2
−6 GeV), z
=0.06
−0.3 (p
T =6
−30 GeV, ), and z > 0.3 (p
T> 30 GeV) with parameters constrained such that the linear functions match at the boundaries. The resulting fits are used as estimates of the systematic uncertainties on all measured R
D(z)and R
D(pT)ratios reported in Sec. 8. This systematic uncertainty is certainly correlated with and may overlap with other systematic uncertainties described above.
The basic systematic uncertainty due to the tracking efficiency correction uses the result from the
inclusive charged particle measurement [24] which estimated the systematic uncertainty due to the track-
ing efficiency to be
±3% for charged particle p
Tspectra and 1% for their central to peripheral ratios. We
have therefore evaluated the measured distributions with tracking efficiency correction factors shifted by
3% for the spectra and 1% for the ratios and compared the resulting and the original distributions. This
z
10-1 1
D(z)
10-2
10-1
1 10 102
103
104
26
× 0-10%
25
× 10-20%
24
× 20-30%
23
× 30-40%
22
× 40-50%
21
× 50-60%
60-80%
ATLAS Preliminary
=2.76 TeV sNN
Pb+Pb
=0.14 nb-1
Lint
R=0.4 anti-kT
> 100 GeV
jet
pT
[GeV]
pT
10 102
) TD(p
10-4
10-3
10-2
10-1
1 10 102
26
× 0-10%
25
× 10-20%
24
× 20-30%
23
× 30-40%
22
× 40-50%
21
× 50-60%
60-80%
ATLAS Preliminary
=2.76 TeV sNN
Pb+Pb
=0.14 nb-1
Lint
R=0.4 anti-kT
> 100 GeV
jet
pT
Figure 4: Unfolded R
=0.4 longitudinal charged particle fragmentation functions, D(z) and D(p
T), for the seven centrality bins included in this analysis. The statistical uncertainties are everywhere smaller than the points. The shaded error bars indicate systematic uncertainties.
yielded in a fully bin-wise correlated systematic uncertainty which moves the whole distribution up and down and which is plotted as a band in the resulting distributions. To cover also the aspect of the bin- wise uncorrelated systematic uncertainty due to the tracking e
fficiency we have evaluated the statistical uncertainties of the fit of the tracking e
fficiency shown in Fig. 2. The resulting uncertainty was then taken as uncorrelated systematic uncertainty from the efficiency correction.
8 Results
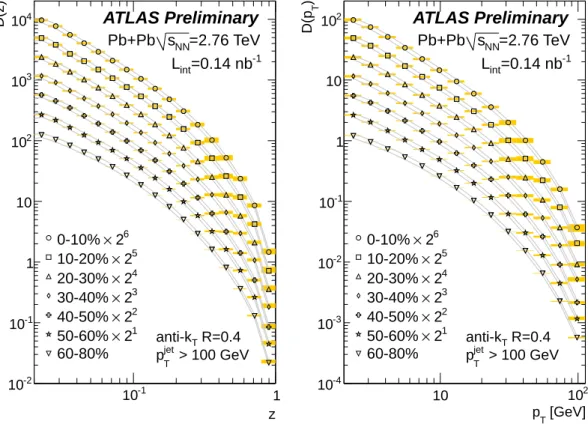
The unfolded fragmentation functions, D(z) and D( p
T), for R
=0.4 jets are shown in Fig. 4 for the seven centrality bins included in the analysis with the distributions for different centralities multiplied by successive values of 2 for presentation purposes. The statistical uncertainties from the unfolding are smaller than the points for all points in the plot. The shaded error bands indicate systematic uncertainties evaluated according the procedures described in Sec. 7. The D(p
T) and D(z) distributions have similar shapes that are characteristic of fragmentation functions with a steep drop at the endpoint.
The D(z) and D( p
T) in Fig. 4 are the primary result of the measurements presented in this note for R
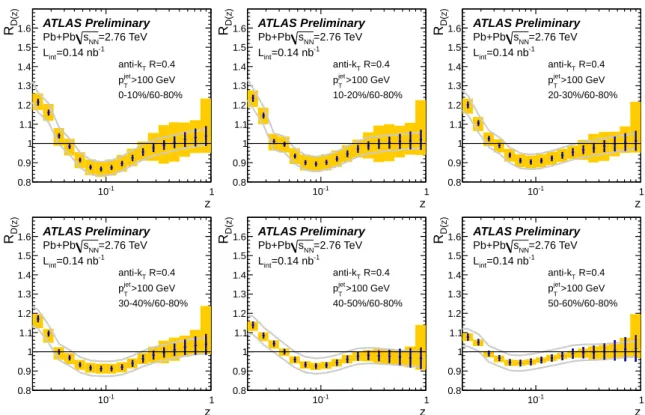
=0.4 jets. However, for the physics purposes of this note, the variation of D(z) with centrality is most important. To evaluate that variation, Fig. 5 shows ratios of the R
=0.4 D(z) distributions for all centrality bins excluding the peripheral bin to the D(z) measured in the peripheral, 60-80% centrality bin.
The ratios for all centralities show the same features seen in Fig. 3, namely an enhanced yield of low-z
fragments and a suppressed yield of fragments at intermediate z values in more central collisions relative
to the 60-80% centrality bin. For the 0-10% centrality bin, the yield of fragments at z
=0.02 is enhanced
z
10-1 1
D(z)R
0.8 0.9 1 1.1 1.2 1.3 1.4 1.5 1.6
0-10%/60-80%
>100 GeV
jet
pT
R=0.4 anti-kT
ATLAS Preliminary
=2.76 TeV sNN
Pb+Pb
=0.14 nb-1
Lint
z
10-1 1
D(z)R
0.8 0.9 1 1.1 1.2 1.3 1.4 1.5 1.6
30-40%/60-80%
>100 GeV
jet
pT
R=0.4 anti-kT
ATLAS Preliminary
=2.76 TeV sNN
Pb+Pb
=0.14 nb-1
Lint
z
10-1 1
D(z)R
0.8 0.9 1 1.1 1.2 1.3 1.4 1.5 1.6
10-20%/60-80%
>100 GeV
jet
pT
R=0.4 anti-kT
ATLAS Preliminary
=2.76 TeV sNN
Pb+Pb
=0.14 nb-1
Lint
z
10-1 1
D(z)R
0.8 0.9 1 1.1 1.2 1.3 1.4 1.5 1.6
40-50%/60-80%
>100 GeV
jet
pT
R=0.4 anti-kT
ATLAS Preliminary
=2.76 TeV sNN
Pb+Pb
=0.14 nb-1
Lint
z
10-1 1
D(z)R
0.8 0.9 1 1.1 1.2 1.3 1.4 1.5 1.6
20-30%/60-80%
>100 GeV
jet
pT
R=0.4 anti-kT
ATLAS Preliminary
=2.76 TeV sNN
Pb+Pb
=0.14 nb-1
Lint
z
10-1 1
D(z)R
0.8 0.9 1 1.1 1.2 1.3 1.4 1.5 1.6
50-60%/60-80%
>100 GeV
jet
pT
R=0.4 anti-kT
ATLAS Preliminary
=2.76 TeV sNN
Pb+Pb
=0.14 nb-1
Lint
Figure 5: Ratios of D(z) for six bins in collision centrality to those in peripheral (60-80%) collisions, D(z)|
cent/D(z)|
60−80, for R
=0.4 jets. The error bars on the data points indicate statistical uncertainties while the shaded bands indicate systematic uncertainties that are uncorrelated or partially correlated between points. The solid lines indicate systematic uncertainties that are 100% correlated between points.
relative to that in the 60-80% centrality bin by 25% while the yield at z
=0.1 is suppressed by about 15%.
The size of the observed modifications decreases gradually with centrality between central and peripheral collisions. The systematic uncertainties on R
D(z)grow as z
→1 due to the statistical fluctuations on the D
sub(z) distributions at large z and due to the sensitivity of the steeply falling D(z) distributions to JER systematic uncertainties. However, the results in Fig. 5 exclude any significant modification of the D(z) distributions at large z.
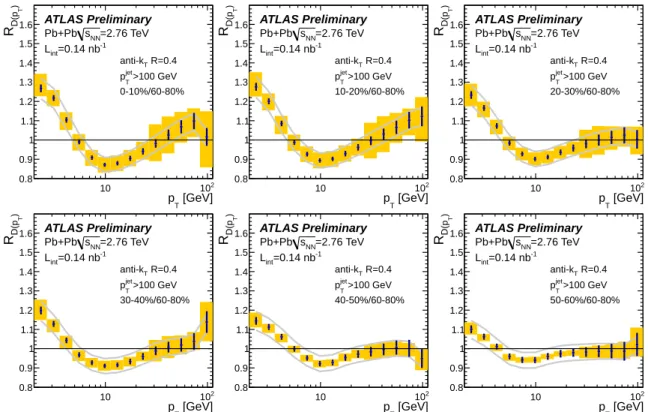
To demonstrate that the modifications observed in Fig. 5 do not result from characteristics of the jet performance, Fig. 6 shows ratios of R
=0.4 D( p
T) distributions from non-peripheral centrality bins to those in the peripheral, 60-80% centrality bin. The ratios in the figure show the same features as the D(z) ratios, namely an enhancement at low z and a suppression at intermediate z. The magnitudes of the enhancement seen at low z or p
Tand the suppression seen at intermediate z are consistent within uncertainties between the D(z) and D( p
T) ratios.
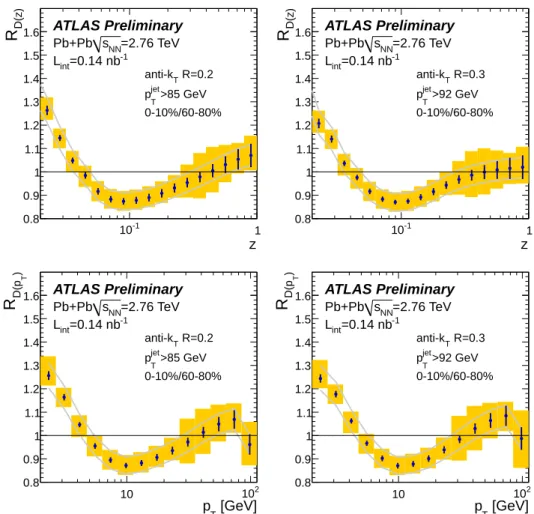
To demonstrate that the centrality-dependent modifications observed in D(z) and D( p
T) do not result
from unknown UE effects not included in the systematic uncertainties, Fig. 7 shows ratios of D(z) and
D(p
T) distributions between central (0-10%) and peripheral (60-80%) collisions for R
=0.2 and R
=0.3
jets. The fluctuations in the UE are a factor of approximately two (30%) smaller for R
=0.2 (R
=0.3)
jets than they are for R
=0.4 jets. Nonetheless, the features seen in the R
=0.4 D(z) or D( p
T) ratios are
also present in the R
=0.2 and R
=0.3 ratios with the same magnitudes, both for the low-z enhancement
and the reduction at intermediate z.
[GeV]
pT
10 102
)TD(pR
0.8 0.9 1 1.1 1.2 1.3 1.4 1.5 1.6
0-10%/60-80%
>100 GeV
jet
pT
R=0.4 anti-kT
ATLAS Preliminary
=2.76 TeV sNN
Pb+Pb
=0.14 nb-1
Lint
[GeV]
pT
10 102
)TD(pR
0.8 0.9 1 1.1 1.2 1.3 1.4 1.5 1.6
30-40%/60-80%
>100 GeV
jet
pT
R=0.4 anti-kT
ATLAS Preliminary
=2.76 TeV sNN
Pb+Pb
=0.14 nb-1
Lint
[GeV]
pT
10 102
)TD(pR
0.8 0.9 1 1.1 1.2 1.3 1.4 1.5 1.6
10-20%/60-80%
>100 GeV
jet
pT
R=0.4 anti-kT
ATLAS Preliminary
=2.76 TeV sNN
Pb+Pb
=0.14 nb-1
Lint
[GeV]
pT
10 102
)TD(pR
0.8 0.9 1 1.1 1.2 1.3 1.4 1.5 1.6
40-50%/60-80%
>100 GeV
jet
pT
R=0.4 anti-kT
ATLAS Preliminary
=2.76 TeV sNN
Pb+Pb
=0.14 nb-1
Lint
[GeV]
pT
10 102
)TD(pR
0.8 0.9 1 1.1 1.2 1.3 1.4 1.5 1.6
20-30%/60-80%
>100 GeV
jet
pT
R=0.4 anti-kT
ATLAS Preliminary
=2.76 TeV sNN
Pb+Pb
=0.14 nb-1
Lint
[GeV]
pT
10 102
)TD(pR
0.8 0.9 1 1.1 1.2 1.3 1.4 1.5 1.6
50-60%/60-80%
>100 GeV
jet
pT
R=0.4 anti-kT
ATLAS Preliminary
=2.76 TeV sNN
Pb+Pb
=0.14 nb-1
Lint