ATLAS-CONF-2013-104 04November2013
ATLAS NOTE
ATLAS-CONF-2013-104
November 1, 2013
Performance of the ATLAS Minimum Bias and Forward Detector Triggers in p + Pb collisions
The ATLAS Collaboration
Abstract
This note describes the performance of the ATLAS minimum bias and forward detector triggers during the 2013 LHC Heavy Ion run (p
+Pbcollisions with
√sNN =
5.02 TeV). The e
fficiency and purity of triggers using a wide variety of ATLAS subdetectors are presented.
The performance of the Level 1 triggers based on signals from MBTS, LUCID, the Forward Calorimeters and Zero Degree Calorimeters is shown. In addition triggers using tracks re- constructed at the High Level Trigger, known as the low-bias mbSpTrk trigger and the High Multiplicity Trigger, are discussed.
c
Copyright 2013 CERN for the benefit of the ATLAS Collaboration.
Reproduction of this article or parts of it is allowed as specified in the CC-BY-3.0 license.
1 Introduction
Proton-Nucleus (p
+A) collisions at the Large Hadron Collider (LHC) at CERN provide an interesting framework for the study of QCD. The collisions of p+Pb nuclei are different in many ways from the p+p interactions for which the ATLAS trigger system was designed. Understanding the trigger efficiencies for di
fferent event types is crucial to control and minimize any possible bias in the event selection.
Minimum bias events are characterized using the total track multiplicity (N
trk) and the total transverse energy
ΣE
TPbmeasured in the Forward Calorimeters (FCal) on the Pb remnant side in a pseudorapidity
1range of 3.1
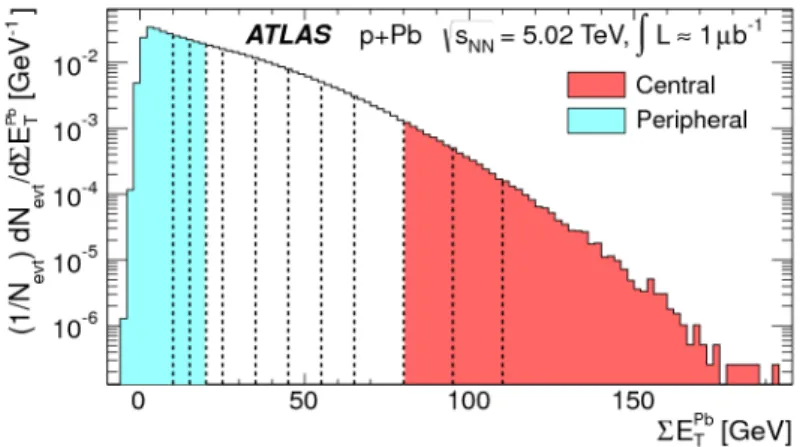
<|η|<4.9. The inclusive minimum bias event sample can be divided into centrality classes according to the measured
ΣE
TPbvalues, as shown in Fig. 1, based on the 2012 p
+Pb data [1] from a pilot run. Centrality in p+A collisions is characterized by the number of nucleon-nucleon collisions. The higher the
ΣE
PbTvalue, the more central the collision is.
Figure 1: Distribution of
ΣE
TPbfor minimum-bias p
+Pb events. These events are divided into centrality classes defined as bins in
ΣE
TPb(indicated by vertical lines). In Ref. [1] however, the analysis was per- formed for peripheral and central events defined by larger intervals (shaded bands) having
ΣE
TPb<20 GeV and
ΣE
TPb>80 GeV, respectively.
In A
+A and p
+A collisions, the nucleons which do not interact are known as spectator nucleons. The Zero Degree Calorimeter (ZDC) described in Section 2.3 is designed to detect free spectator neutrons which follow a straight trajectory after such collisions. The charged remnants of the beam (spectators protons, nuclei fragments, and the una
ffected nuclei) are bent by the magnetic field which guides the beams and have a low probability of impacting the ZDC. In the p
+Pb collisions we do not expect neutral spectators at the proton side at all. In contrast, the number of spectators on the Pb side is very large, however most of them are contained finally in multicharged fragments and relatively few spectator neu- trons are liberated. For p
+Pb collisions the ZDC detector is thus expected to be much less e
fficient than it was in Pb+Pb collisions, in which Pb nuclei are frequently broken into many fragments and release numerous free spectator neutrons.
Heavy nuclei with a large charge also interact electromagnetically. QED processes and photo-nuclear interactions occur when one photon from the electromagnetic field of the proton interacts with the nu-
1In the ATLAS coordinate system, thez-axis points in the direction of the anti-clockwise beam viewed from above (Beam 2). Polar anglesθand transverse momentapTare measured with respect to this axis. The pseudorapidityη=−ln tan(θ/2) is a good approximation to the rapidity of a particle whose mass is negligible compared with its energy and is used here, relative to the nominalz = 0 point at the centre of the apparatus, to describe regions of the detector. The hemisphere at positive pseudorapidity is denoted the A side while the hemisphere at negative pseudorapidity is denoted the C side of the detector.
Natural units are assumed such thatc=~=1.
Period Collision type
√s
NNDates
LNum Evts
[TeV] [pb
−1]
Period A p
+Pb 5.02 21 Jan. 2013-02 Feb. 2013
∼5.8 ∼67M Period B Pb+p 5.02 02 Feb. 2013-10 Feb. 2013
∼3.8
∼75M
Table 1: Different data taking periods in 2013. In Period A proton beam is going from right to left (from positive to negative z coordinate), lead beam from left to right, and the reverse in Period B. As a result, remnants of Pb nuclei can be found at positive (negative) pseudorapidity in Period A (Period B). Because of changed trigger conditions relatively more events were collected in the period B.
cleus, possible fluctuating to a vector meson. This produces soft particles at mid-rapidity [2], however with relatively small multiplicity.
The ATLAS trigger system [3] is designed to record events at approximately 200 Hz from the 40 MHz bunch crossing rate of proton-proton collisions at nominal running conditions of the LHC. In 2013, rates of p+Pb interactions exceeded 200 kHz at peak luminosity of
∼10
29cm
−2s
−1. The trigger system consists of three levels; the first level (L1) is a hardware-based system using information from fast subdetectors (scintillator, ˇ Cerenkov, calorimeter and muon detectors), the second (L2) and third (Event Filter, EF) levels are software-based systems using information from all subdetectors. Together, L2 and EF are called the High Level Trigger (HLT).
Triggering on p
+Pb collisions in ATLAS is based on signals from particle production in the main detector (as in p+p collisions) and on signals from spectator neutrons detected in the ZDC. Although the requirements on the trigger selection for p+Pb runs are not as stringent as those for high luminosity p
+p runs, the trigger selection is still essential for p
+Pb data taking and further physics analysis. One important group of triggers are those which select inelastic events with the smallest bias. Events selected in these triggers are called minimum bias (MB) events and are selected using information from various subsystems including: the Minimum Bias Trigger Scintillators (MBTS), ZDC, the LUminosity ˇ Cerenkov Integrating Detector (LUCID), the Inner Detector (ID) used for tracking and calorimeters providing the Total Calorimetric Energy (TE). With an exception of the Inner Detector, which can be used at the High Level Trigger only, all these detectors provide L1 triggers.
In this note, the performance of the MB triggers in the 2013 p+Pb data taking period is assessed.
Similar studies have been reported in Ref. [4] for the 2011 Pb+Pb collisions. During the running period, lasting from Jan. 21 to Feb. 10, 2013, ATLAS recorded approximately 142 million MB events from p
+Pb collisions at nucleon-nucleon center of mass energy of
√s
NN =5.02 TeV. Additional events from p+p collisions at
√s
=2.76TeV were taken a few days later. The p+Pb data taking period is divided in two parts: period A when Beam 1 and Beam 2 were composed of Pb nuclei and protons, respectively, and period B with the beam types reversed. In Table 1 the various periods are shown together with the approximate integrated luminosity recorded
2. In this note we define the collision types according to the directions of proton and lead beams, assuming that the beam going from right to left
3(from positive to negative z coordinate) is mentioned first.
This note is organized as follows. After a brief description of the MB detectors (Section 2) and data selection requirements (Section 3), the performance of various MB triggers is reviewed (Sections 4 and 5). The performance of the MBTS counters are also investigated and compared with their perfor- mance in previous runs.
2In September 2012, LHC produced test p+Pb collisions for one day collecting∼ 5.7M MB events with an integrated luminosity of∼4.7µb−1.
3Known in LHC operations as Beam 1.
2 The ATLAS Minimum Bias and Forward Detector Trigger System
The ATLAS subdetectors involved in the MB event selections are: MBTS [5], LUCID [6], ZDC [7], ID tracking system [8], Calorimetric system [8]. These will be discussed in subsequent sections.
2.1 MBTS
The MBTS detector [5] consists of 32 scintillator counters each of 2 cm thickness which are organized in two disks with one on each side of the ATLAS detector (called MBTS A and MBTS C for sides A and C, respectively). The scintillators are installed on the inner face of the end-cap calorimeter cryostats at z
=±3650 mm such that the disk surface is perpendicular to the beam direction. Each disk is dividedinto an inner and an outer ring covering the radii 153–426 mm and 426–890 mm respectively. This corresponds in pseudorapidity to 3.84
> |η| >2.82 and 2.82
> |η| >2.09. Both the inner and the outer rings are subdivided into eight readout independent
φsectors, each of 2π/8 radians wide. These sectors are located such that the first sector has its edges at
φ=0 and
φ=π/4. Light emitted by each scintillatorcounter is collected by wavelength-shifting optical fibres and guided to a photomultiplier tube (PMT).
The PMT signals are read out by the Tile Calorimeter (TileCal) electronics. The MBTS signals, after being shaped and amplified by the TileCal electronics, are fed into leading edge discriminators and sent as 25 ns pulses to the Central Trigger Processor (CTP). An MBTS hit is defined as a signal above the discriminator threshold. The MBTS multiplicity is calculated for sides A and C independently. During 2013 p+Pb runs, the signals from MBTS counters were processed individually by the CTP. Different trigger logic is then implemented by combining individual signals, the most important of which are L1 MBTS 2, L1 MBTS 1 1 and L1 MBTS 2 2. These require at least two MBTS hits (either on side A or C), at least one hit on both sides and at least two hits on both sides, respectively. Further rejection based on the collected charge and time of the signal is possible at the L2 trigger.
2.2 LUCID
LUCID is the primary ATLAS instantaneous luminosity monitor [6]. It has been designed to provide information on the luminosity delivered to the experiment both time integrated over all particle bunches and bunch-by-bunch. In order to achieve the latter, its electronics have been designed to process, without deadtime, the number of hits recorded per bunch crossing. This also allows LUCID to operate as part of the trigger system. The light produced by a charged particle crossing a tube is collected by a pho- tomultiplier (PMT), amplified by the front end amplifiers and sent to receiving amplifiers through long cables. The signals are then processed by a Field Programmable Gate Array (FPGA) in order to provide two trigger signals which input to the CTP. These hit patterns are also recorded and are available for further analysis (Section 5.6). Each of these trigger signals requires at least one hit in one of the two detector arms (labeled L1 LUCID A and L1 LUCID C). Also available are the logical OR (L1 LUCID) and logical AND of these two triggers (L1 LUCID A C). The LUCID electronics are equipped with a powerful event processor LUMAT card [6] which runs the luminosity algorithms. The LUMAT also delivers inde- pendent trigger signals to the CTP called L1 LUCID COMM. For the 2013 p
+Pb run, the L1 LUCID COMM trigger is implemented to require at least 11 hits (out of 16) per side on both LUCID arms (logical AND).
2.3 ZDC
The ZDC [7] is a compact tungsten/quartz sampling calorimeter replicated on both sides of the interaction
point (IP) at zero degrees with respect to the beam line. The ZDC is located 140 m downstream from the
IP in the copper Target Absorber Neutral [9], between the beam-pipes just at the place where the single
beam pipe is divided back into two independent beam-pipes. It measures forward neutral particles that are
produced in p+Pb collisions at
|η| >8.3. The ZDCs are segmented longitudinally in four modules - one electromagnetic (EM) module (about 29X
0thick) and three hadronic modules (each of about 1.14λ
int).
Some modules are also segmented laterally but this feature is not used at the trigger level. The quartz strips are viewed by PMT tubes, however due to the high radiation level, digitization electronics could not be placed in the vicinity the ZDC detector. Instead, analog PMT signals are amplified and sent via coaxial cables to special ZDC receiver modules in the service cavern. Here the signals are processed by a variable gain amplifier/shaper which produces a unipolar differential output signal with full length of
∼
60 ns and amplitude within a [−1, 0] V range. The ZDC system provides several triggers, L1 ZDC A and L1 ZDC C trigger on one or more signals above threshold in the detectors placed on the A and C sides of ATLAS respectively. Their combinations are also implemented: logical OR (L1 ZDC) and logical AND (L1 ZDC A C).
2.4 Inner Detector Minimum Bias Triggers
The ID MB trigger, referred to as mbSpTrk, provides an alternative method for selecting p
+Pb interac- tions. mbSpTrk is seeded by a random trigger at L1 which selects random filled bunch crossings to avoid any selection bias. The event selection takes place in the HLT. The mbSpTrk trigger uses the ID silicon subdetectors: the pixel detector (Pixel) and the silicon micro strip tracker (SCT) [10]. The trigger covers the complete ID tracking region up to
|η|<2.5. In the L2 trigger, the algorithms detect central detector activity by forming space-points in both the Pixel and SCT. Space-points are 3-dimensional hit repre- sentations formed from hit clusters. While the Pixel space-points are made by a direct transformation of pixel clusters into space-points, the SCT space-points are only created if a pair of strip hits originate from opposing sides of a module and overlap in
ηand
φ[10]. This coincidence of silicon strips gives an intrinsic noise suppression in the SCT detector. To suppress hits accidentally formed by electronic noise in the Pixel, a cut on the pixel cluster time-over-threshold of 20 bunch crossings is applied before counting the total number of Pixel space-points in the event. Since the main task at L2 is to suppress empty bunch crossing events, the thresholds were set to operate just above the electronic noise level. The configuration used for p+Pb runs required:
•
At least two Pixel space-points with a time-over-threshold larger than 20 bunch crossings.
•
At least three SCT space-points.
At the EF, track reconstruction is performed on the whole event with a momentum threshold of 200 MeV. An additional rejection is performed requesting events with at least one track reconstructed with
p
T >200 MeV and longitudinal impact parameter
|z0|<400 mm .
The mbSpTrk trigger is primarily designed to be a minimally biased trigger which can be used to measure the trigger e
fficiencies of the other MB triggers.
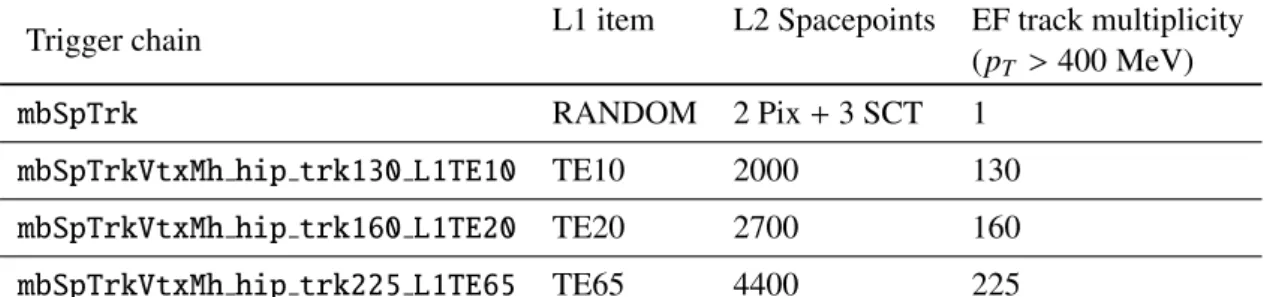
To enhance the contribution of High Multiplicity Track (HMT) events, specific trigger selections have been implemented with large L2 space-point and EF track-multiplicity thresholds. These HMT HLT chains are seeded by di
fferent L1 TEx (see Sec. 2.5) or MBTS based triggers. In Table 2 we list the different HMT trigger selections employed in 2013 p+Pb data taking.
2.5 Additional Items
Additional L1 items used to select MB events are based on the Total Energy (Σ E
T) L1 trigger [11] where
only energy in the forward direction in the pseudorapidity interval 3.2
< |η| <4.9 is summed. For the
2013 p
+Pb run, L1 specific noise suppression cuts are applied. The thresholds available for L1 TEx are
x
=0, 10, 20, 35, 50, 65, 90, 100 GeV. These triggers are deployed standalone or in combination with
other L1 trigger items. They trigger events which are useful for detector monitoring and calibration,
Trigger chain L1 item L2 Spacepoints EF track multiplicity ( p
T >400 MeV)
mbSpTrk RANDOM 2 Pix
+3 SCT 1
mbSpTrkVtxMh hip trk130 L1TE10 TE10 2000 130 mbSpTrkVtxMh hip trk160 L1TE20 TE20 2700 160 mbSpTrkVtxMh hip trk225 L1TE65 TE65 4400 225
Table 2: Various ID based trigger selections employed in the 2013 p
+Pb data taking.
along with physics measurements. Full scan
4ID tracking reconstruction was run on such events in the HLT, selecting a sizable sample of HMT events also in addition to those selected with jet and missing E
Tsignatures.
3 Data Selection
The data set used for this analysis was collected during the 2013 p+Pb data taking with the solenoid switched on. It includes only runs and luminosity blocks
5for which all primary ATLAS subdetec- tors were running at nominal conditions without major problems.The total integrated luminosity for the period A (p+Pb) corresponds to approximately
∼5.8 pb
−1while the one for period B (Pb+p) amounts to approximately
∼3.8 pb
−1. A “loose” track quality requirement is defined on o
ffline recon- structed tracks:
•
track pseudorapidty
|ηtrk|<2.5;
•
at least one pixel hit;
•
one B-layer hit when expected;
•
at least two SCT hits for tracks with 100 MeV
<p
T <200 MeV;
•
at least four SCT hits for tracks with 200 MeV
<p
T <300 MeV;
•
at least six SCT hits for tracks with p
T >300 MeV;
•
Prob(χ
2,Ndof)
>0.01 for tracks with p
T >10 GeV/c;
•
transverse and longitudinal impact parameters
|d0|<1.5 mm and
|z0·sin(θ)|
<1.5 mm evaluated with respect to the reconstructed primary vertex if one exists or with respect to the beam line otherwise.
The number of such tracks is denoted as n
trkPV. The o
ffline event selection requires at least two “loose”
tracks and an additional requirement to select “in-time” collisions. To avoid any possible bias from the timing measurement, collision events for MBTS trigger performance studies are selected requiring a time di
fference measured from the two sides of the calorimeter to be consistent with a collision bunch
4Innormalconfiguration, the ID tracking trigger processes only hits belonging to a limited size of the ID detector (Region of Interest). Infull scanmode the whole ID tracking detector is processed.
5ATLAS runs are subdivided into smaller time intervals of approximately one minute over which it is approximated that the delivered luminosity is constant.
[mm]
zvtx
-200 0 200
Events
1 10 102
103
104
105
106
107
1 vertex, width 67.1mm 2 vertices
p+Pb
ATLAS Preliminary
=5.02 TeV sNN
[mm]
2
-zvtx 1
zvtx
-200 0 200
Events
1 10 102
103 width of wide Gaussian 93.1mm
p+Pb
ATLAS Preliminary
=5.02 TeV sNN
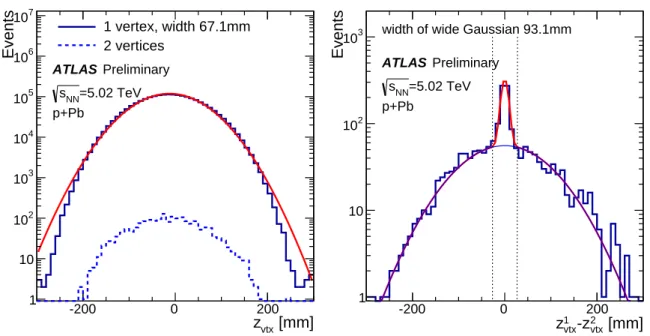
Figure 2: (left) Distribution of z-vertex for events with one vertex (solid) and two vertices (dashed), the latter are required to have
PP
T >5000 MeV. (right) The distribution of vertex di
fference for events containing two z vertices.
crossing,
|tLAr A−t
LAr C| <10 ns. For the other trigger based performance studies the request is based on MBTS timing,
|tMBT S A−t
MBT S C|<10 ns.
In the 2013 data taking conditions, the expected pile up amounts to
µ∼10
−1which is not completely negligible. Pile Up events can be identified as those with more than one “good” reconstructed vertex [1]
with
Pp
T >5000 MeV; however there is a small probability that a genuine single vertex is artificially split into two distinct ones because of the tracking resolution. In Fig. 2 we show the z position of the primary vertex respectively for events with a single and with two reconstructed vertices. For events with two reconstructed primary vertices we report the distribution of z
1,Vtx−z
2,Vtxbetween the two reconstructed vertices. A clear double Gaussian structure is visible, the wider one is compatible with the spread of z positions of vertexes (as it is
√2 times larger than the width of the distribution in the left panel), while the narrow one has a
σ∼7.5 mm and is due to single vertex splitting. Therefore, the pile up suppression requirement is to have exactly one “good” primary vertex reconstructed or
|z1,Vtx−z
2,Vtx|<15 mm in case two vertices are reconstructed.
4 Trigger Menu for the 2013 p + Pb Runs
The trigger selection is implemented by trigger chains that consist of sequences of L1 trigger items and L2 and EF trigger algorithms. Some chains run in pass-through mode, that is, the reconstruction and hypothesis algorithms run and produce trigger decisions but the event is recorded irrespective of them.
Those triggers are used for e
fficiency measurements. Some other chains run in active mode where events are actively selected based on their reconstructed quantities passing the thresholds. To reduce the total recording rate, a prescale factor (PS) can be applied to select randomly only a requested fraction
6of the events passing the trigger chain. The list of all trigger chains, their configurations and PS factors make
6The fraction of events selected is the reciprocal of the prescale factor.
up the trigger menu. The trigger menu for p+Pb 2013 runs is substantially different than the one used for proton-proton collisions [3].
The primary chains used to select MB p+Pb events have evolved during the 2013 data taking due to the varying conditions. However, a majority of event statistics for physics measurements have been collected with the following triggers:
•
L1MBTS 2 NoAlg where only a L1 MBTS 2 selection is applied requesting at least two hits above the threshold in the MBTS detectors irrespectively of their side;
•
L1MBTS 1 1 NoAlg with a L1 MBTS 1 1 selection where at least one hit in the MBTS detector on both sides is required at L1;
•
mbMbts 2 where on top of the L1MBTS 2 NoAlg selection, a L2 selection requiring that at least two hits in the MBTS detector with charge collected larger than 0.18 pC and time difference with respect to bunch crossing is smaller than 12 ns is imposed;
•
mbMbts 1 1 where on top of the L1MBTS 1 1 NoAlg selection, a L2 selection requiring that at least one hit in the MBTS detector on both sides with charge collected larger than 0.18 pC and time difference with respect to bunch crossing is smaller than 12 ns is imposed;
•
L1ZDC A NoAlg with a L1 ZDC A selection which requires at least one signal above the threshold on side A;
•
L1ZDC C NoAlg with a L1 ZDC C selection which requires at least one signal above the threshold on side C;
•
L1TEx NoAlg with a L1 TEx selection with x
=65, 90 GeV thresholds;
•
mbSpTrkVtxMh hip trkY L1TEx with a L1 TEx selection at L1 and a track multiplicity require- ment Y at EF. The x and Y
7. thresholds have been optimized to allow the HMT trigger to run unprescaled.
The ATLAS detector records a L1 trigger decision for all events. Therefore, many more triggers are available for performance studies in this note.
Data for events selected by the trigger system are written to inclusive data streams based on the trigger type. There are four primary physics streams:
•
MinBias with a collection of MB and HMT events; A majority of these triggers were prescaled down to fit into the allocated bandwidth of 250 Hz.
•
HardProbes with events associated with jets, electrons, photons, muons and missing E
T; A ma- jority of these triggers were optimized to run unprescaled at the nominal data taking conditions at
∼
150 Hz.
•
UPC
8with low track multiplicity events produced by photo-nuclear processes; They were running at 10 Hz throughout the run.
•
MinBiasOverlay with MB events to be used for overlay with PYTHIA Monte Carlo samples. This stream was kept at
∼5 Hz by means of the PS value.
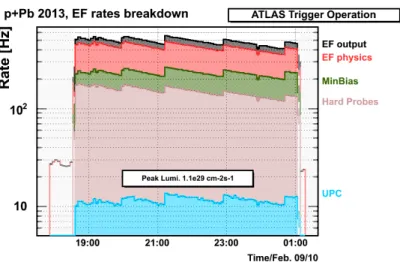
ATLAS uses several additional calibration streams. Figure 3 shows rates for physics streams as a function of time for an example run collected at the nominal conditions.
7High Track Multiplicity chains used were issued byL1 TExwithx=65,90 GeV.
8UPC stands for ultra-peripheral collisions.
Figure 3: p
+Pb run with a peak luminosity 1.1
×10
29cm
−2s
−1, integrated luminosity 1.5 nb
−1. Output rates for EF and EF physics and MinBias, HardProbes and UPC data are shown as a function of time. The EF physics rate is a sum of MinBias, HardProbes, UPC and MinBiasOverlay data. The individual rate of MinBiasOverlay is not shown in the plot. The EF output rate on top of the EF physics rate includes calibration triggers. The EF physics rate is kept constant throughout the run at the level of 400 Hz. The time interval with stable-beam conditions is indicated by the solid histograms.
This note focuses on performance of triggers which belong to the MinBias stream. In particular e
fficiency (1) and purity (2) for the di
fferent triggers are reported.
E
fficiency for a given trigger selection is defined as:
trig=
# events passing(o
ffline selection
∧trigger selection)
# events passing (o
ffline selection) ; (1) In order to obtain fully unbiased estimates of e
fficiency an event sample from a random trigger should be used, and this method is applied in the case of the mbSpTrk trigger e
fficiency. For other triggers the relatively small sample of random events is not the best choice, as it contains low number of events passing the o
ffline selection. Instead, we can use much larger sample of events fulfilling the mbSpTrk requirements, as this trigger is 100% e
fficient for the limited data sample on which it can be run.
Purity indicates the rejection power of a specific trigger selection and is defined as:
Purity
=# events passing(o
ffline selection
∧trigger selection X)
# events passing(trigger selection X)
.(2) where the o
ffline selection denotes more restrictive requirements of two reconstructed tracks and consistency of time measured by MBTS detector, as discussed in Section 3.
5 Performance Measurements
5.1 mbSpTrk Performance
The mbSpTrk trigger is a supporting trigger designed to select events with the smallest possible bias.
In 2013 it triggered events at a constant rate of a few Hz, adjusted by means of PS values. MB events
triggered by mbSpTrk are used to assess the e
fficiencies of various triggers in the subsequent sections of
this note.
PV
ntrk
10 102
Efficiency
0.9 0.92 0.94 0.96 0.98 1
mbSpTrk
ATLAS Preliminary p+Pb Data 2013
=5.02 TeV
sNN 2 4 6 8 10
0.992 0.994 0.996 0.998 1
[TeV]
FCal,Pb
ET
Σ
-0.02 0 0.02 0.04 0.06 0.08 0.1 0.12 0.14 0.16 0.18
Efficiency
0.92 0.94 0.96 0.98 1
mbSpTrk
ATLAS Preliminary p+Pb Data 2013
=5.02 TeV
sNN -0.02 -0.01 0 0.01
0.975 0.98 0.985 0.99 0.995 1
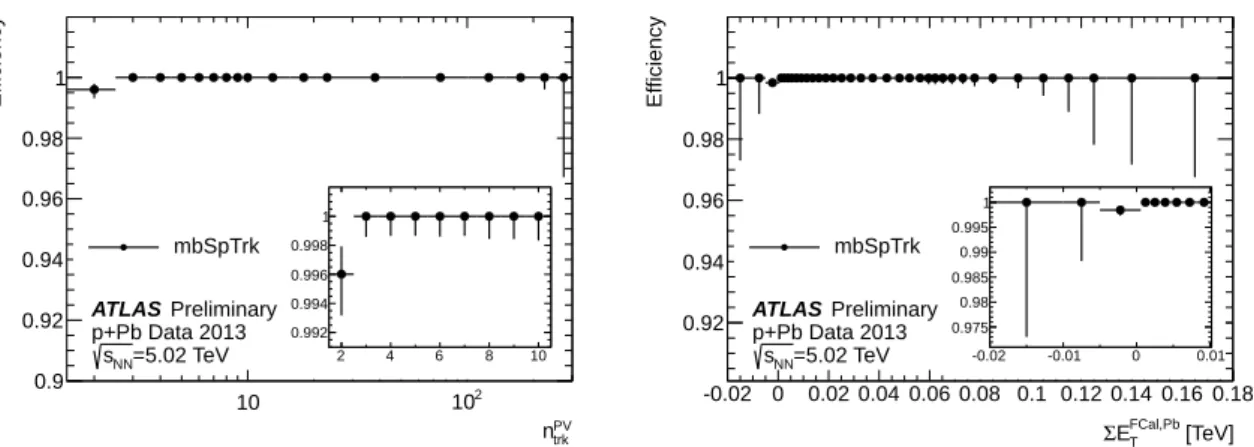
Figure 4: mbSpTrk e
fficiency as a function of the number of reconstructed tracks (left) and
ΣE
PbT(right).
The insets show a zoom either into a low-track multiplicity or low-Σ E
TPbregion.
Trigger Collision type Purity [%]
mpSpTrk p+Pb (period A) 86.79
±0.04 mpSpTrk Pb
+p (period B) 87.50
±0.04 mpSpTrk p+Pb and Pb+p (period A+B) 87.14
±0.03
Table 3: Purity of the mbSpTrk trigger averaged over all runs in different data taking periods.
The mbSpTrk trigger e
fficiency is itself quantified based on a fully unbiased data sample selected by a random trigger at L1 selecting p+Pb bunch crossings with no subsequent rejection of events at the HLT. The space-point counting algorithm still runs at L2 and full scan tracking at EF which extract the quantities which are used in the hypothesis algorithms of mbSpTrk. This information is used to impose the trigger selection offline and hence derive the total efficiency of mbSpTrk. About 95% events in this sample consists of so called empty events in which no interaction occurred, therefore the statistics of non-empty events are limited.
The o
ffline selection for the mbSpTrk efficiency and purity measurements uses the LAr timing re- quirement.
Figure 4 presents the mbSpTrk e
fficiency as a function of the number of reconstructed tracks per event and
ΣE
TPb. The trigger is 100% efficient for track multiplicity values above two. There is some small inefficiency in the first two-track bin which leads to the overall mbSpTrk efficiency of (99.995± 0.005)%.
The event losses occur at L2 and EF. This tiny ine
fficiency can be recovered imposing the MBTS timing requirement instead of the loser LAr timing , which brings the efficiency to 100% in all track multiplicity bins.
Unlike in 2011 [4], during 2013 p
+Pb data taking, high voltages trips in ID modules were never observed leaving the noNoise version of the mbSpTrk chains disabled.
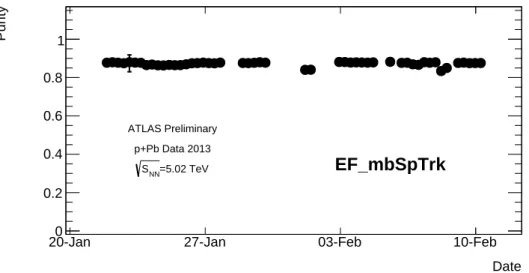
Purity of mbSpTrk trigger is shown in Table 3 averaged for the whole 2013 p+Pb data taking period.
Only marginal di
fferences were found between the p
+Pb and Pb
+p data taking periods. The purity of
mbSpTrk trigger as a function of the data taking time is shown in Fig. 5. Also the purity for a L1 random
trigger has been measured to be
∼3%.
Date
20-Jan 27-Jan 03-Feb 10-Feb
Purity
0 0.2 0.4 0.6 0.8 1
EF_mbSpTrk
ATLAS Preliminary p+Pb Data 2013
=5.02 TeV SNN
Figure 5: mbSpTrk purity as a function of data taking time.
5.2 L1 TEX Performance
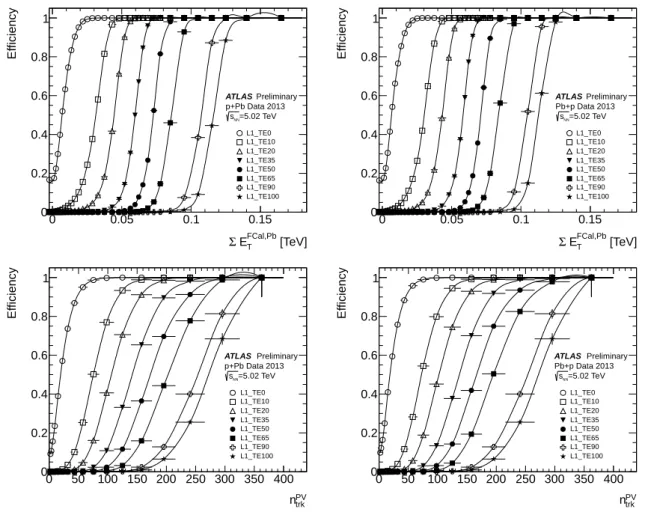
The L1 TEx triggers are used to select event candidates at L1 with subsequent dedicated selections for various final states at the HLT. The trigger efficiency of a generic trigger L1 TEx has been mea- sured in the MB event sample obtained by applying cuts on MBTS time for the events from the data collected using mbSpTrk trigger. Figure 6 shows trigger efficiencies for all L1 TEx triggers where x
=0, 10, 20, 35, 50, 65, 90 and 100 GeV. They are studied as a function of
ΣE
PbTand track multiplicity.
As these triggers are selecting events by applying a cut on an estimate of the
ΣE
PbTvalue available at L1, we observe sharp turn-on curves in the upper plots in Fig. 6, which start near the nominal threshold and reach
∼100% for
ΣE
TPbvalues larger by about 30 GeV. This turn-on is slightly faster for the Pb+p data than for p
+Pb data. This indicates a marginal asymmetry between the two sides of the Forward Calorimeters caused by the calibrations used at L1.
The increase of trigger efficiency with the number of tracks is more gradual,
∼100% efficiency is reached by the trigger with lowest threshold, L1 TE0, for events with at least 80 tracks, while for the triggers with the highest thresholds full e
fficiency is observed for events with extreme multiplicities only - the number of tracks has to be larger than 300. No asymmetry between the two data taking periods is observed.
The purities for the L1 TEx triggers for all available thresholds are reported in Table 4. Purity as a function of the data taking time is shown in Fig. 7. No substantial differences are observed for the di
fferent time periods.
5.3 High Multiplicity Track Trigger Performance
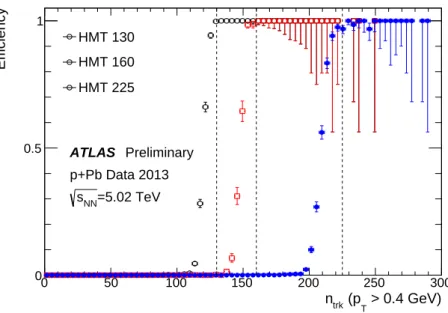
High Multiplicity Track (HMT) triggers are HLT used to collect events with very large track multiplicity.
They are seeded by a L1 TEx trigger, passing a threshold on number of space points at L2 and track multiplicity at EF level (examples are shown in Table 2). The collision vertices are also reconstructed at EF level, and the multiplicity threshold is applied on the vertex with largest track multiplicity. The HMTs are designed such that the input rate is less than 10 KHz at L2 and 500 Hz at the EF. However, the prescale factors for these HMT triggers are dependent on the run number, and some of these triggers are only enabled at the end of the running period.
Figure 8 shows the trigger efficiency for three HMTs as a function of track multiplicity. Here the
[TeV]
FCal,Pb
ET
Σ
0 0.05 0.1 0.15
Efficiency
0 0.2 0.4 0.6 0.8 1
ATLAS Preliminary p+Pb Data 2013
=5.02 TeV sNN
L1_TE0 L1_TE10 L1_TE20 L1_TE35 L1_TE50 L1_TE65 L1_TE90 L1_TE100
[TeV]
FCal,Pb
ET
Σ
0 0.05 0.1 0.15
Efficiency
0 0.2 0.4 0.6 0.8 1
ATLAS Preliminary Pb+p Data 2013
=5.02 TeV sNN
L1_TE0 L1_TE10 L1_TE20 L1_TE35 L1_TE50 L1_TE65 L1_TE90 L1_TE100
PVtrk
n 0 50 100 150 200 250 300 350 400
Efficiency
0 0.2 0.4 0.6 0.8 1
ATLAS Preliminary p+Pb Data 2013
=5.02 TeV sNN
L1_TE0 L1_TE10 L1_TE20 L1_TE35 L1_TE50 L1_TE65 L1_TE90 L1_TE100
PVtrk
n 0 50 100 150 200 250 300 350 400
Efficiency
0 0.2 0.4 0.6 0.8 1
ATLAS Preliminary Pb+p Data 2013
=5.02 TeV sNN
L1_TE0 L1_TE10 L1_TE20 L1_TE35 L1_TE50 L1_TE65 L1_TE90 L1_TE100
Figure 6: L1 TEx trigger e
fficiency as a function of
ΣE
TPb(upper panels) and the number of reconstructed tracks (lower panels) for p+Pb (left column) and Pb+p collisions. The lines joining the points for each trigger are drawn to guide the eyes only.
Trigger Purity [%]
L1 TE0 96.25
±0.4 L1 TE10 99.57
±0.02 L1 TE20 99.82
±0.02 L1 TE35 100
+−0.0080L1 TE50 100
+−0.020L1 TE65 100
+−0.030L1 TE90 100
+−0.10L1 TE100 100
+−0.20Table 4: Purity of TE seeded triggers.
Date
20-Jan 27-Jan 03-Feb 10-Feb
Purity
0 0.2 0.4 0.6 0.8 1
ATLAS Preliminary p+Pb Data 2013
=5.02 TeV SNN
TE
L1_TE0 L1_TE10 L1_TE20
Figure 7: Purity of TE seeded triggers as a function of time represented by the LHC fill number. L1 TEx triggers with x
≥35 always have purity equal unity and are not shown .
tracks are all offline good tracks selected with criteria listed in Section 3 but requiring p
T >400 MeV.
The e
fficiency is defined as ratio of the number of events passing the HMT trigger selection to the number of MB events. The trigger turn on is quite sharp as expected due to similarity between the o
ffline and online algorithms. In general, the trigger efficiency reaches 100% for 10 tracks above the designed threshold.
5.4 L1 ZDC Performance
The ZDC based triggers were extensively used in selections of Pb
+Pb collisions, in which numerous spectator neutrons are usually emitted from the colliding nuclei. However, in p+Pb collisions there are no neutron spectators in the proton direction and the ZDC detector registers photons or neutral particles produced in the collision. This detector may also detect events with charge exchange process in which the proton is transformed into a neutron without significant particle production. Also in the Pb direc- tion few neutral particles are expected, as most of the spectator neutrons are bound in heavier, charged nuclei fragments, which are deflected by the magnetic field and miss the ZDC. In consequence ZDC triggers were not used for event selection in p+Pb runs, but this detector can provide information on Pb fragmentation for the data analysis.
The lack of spectator neutrons on the proton side means that the trigger from the detector placed at this side is less efficient than that at the Pb fragmentation side. This is shown in Fig. 9 where the efficiency of single side triggers for proton side and Pb side are shown as open circles and open squares, respectively. The e
fficiency on the proton side is small, about 30% at most, and decreases with the centrality of the collisions. This last e
ffect can be explained by multiple interactions of the proton in the Pb nuclei, which cause increasing particle production at large angles and a decreasing probability of emission of neutral particles near zero degrees.
In the Pb fragmentation side the ZDC trigger is much more e
fficient and most importantly the e
ffi- ciency increases with centrality reaching 100% for the events with more than 100 tracks. There is no trigger ine
fficiency at the largest multiplicity, which was observed in Pb
+Pb collisions[4]. This is a natu- ral consequence of the fact that in p
+Pb collisions large numbers of spectators are always present, unlike the most central Pb+Pb events in which sometimes the ZDC does not register any signal.
A detailed inspection of the e
fficiency plots in Fig. 9 reveals some di
fference between the ZDC
performance at A and C sides. To see this L1 ZDC A and L1 ZDC C triggers for di
fferent types of
> 0.4 GeV) (pT
ntrk
0 50 100 150 200 250 300
Efficiency
0 0.5 1
HMT 130 HMT 160 HMT 225
ATLAS Preliminary p+Pb Data 2013
=5.02 TeV sNN
Figure 8: E
fficiency of HMT triggers for three typical setups listed in Table 2 as a function of o
ffline multiplicity for tracks with p
T>400 MeV.
collisions (p+Pb and Pb+p) have to be compared. The L1 ZDC A trigger is always slightly more efficient than L1 ZDC C when both of them are measuring particles from either proton or Pb fragmentation.
The purity of the ZDC triggers is shown in Table 5. To spot variations in time, the purity has been evaluated as a function of the LHC fill number in Fig. 10. No significant variations are observed.
5.5 L1 MBTS X Performance
The MBTS detector provides the primary trigger for MB events in p+Pb collisions. Adapting to the varying data taking conditions, several triggers were used as defined in Sec. 4.
During the LHC operation the MBTS has been exposed to radiation produced in the p
+p collisions of approximately
∼30 fb
−1of integrated luminosity. This cumulative radiative dose received has modified the properties of the polystyrene scintillator causing a deterioration of the light yield. The intensity of the light reaching the MBTS photomultipliers decreased and the performance of this detector was degraded.
This was clearly seen in the comparison of the signals from MBTS in the Pb+Pb collisions collected in 2010 and 2011 [4]. Before the 2013 p
+Pb run, in order to compensate for the reduction of light, the high voltage of the MBTS photomultiplier was increased from 920 V to 930 V (very close to the maximal accessible value). As the dependence of photomultiplier gain on the voltage is highly non-linear even a small increase of the voltage introduces significant improvements.
The signal outputs in single modules of the MBTS before and after the change of the high voltage
were analyzed. Typical signal distributions obtained from the 2012 and 2013 data for a single counter are
shown in Fig. 11. The logarithmic drop of the signals at large values reflects the multiplicity distribution
in the events with p
+Pb collisions. The similarity of the slopes indicates that performance of the trigger
did not significantly worsen between September 2012 and January 2013, even if the detector has obtained
a large radiation dose. More quantitative comparison is presented in Fig. 12. The distribution of the signal
can be approximated by e
−αx, where x denotes the signal magnitude and
αrepresents the slope observed
in Fig. 11 left panel. We can see in Fig. 12 that the MBTS modules have very different properties leading
to widely varying slope parameters, while the difference between values observed in 2012 and 2013 is a
few times smaller.
[TeV]
FCal,Pb
ET
Σ
0 0.05 0.1 0.15
Efficiency
0 0.2 0.4 0.6 0.8 1
ATLAS Preliminary p+Pb Data 2013
=5.02 TeV sNN
L1_ZDC_C (p) L1_ZDC_A (Pb) L1_ZDC L1_ZDC_A_C
[TeV]
FCal,Pb
ET
Σ
0 0.05 0.1 0.15
Efficiency
0 0.2 0.4 0.6 0.8 1
ATLAS Preliminary Pb+p Data 2013
=5.02 TeV sNN
L1_ZDC_A (p) L1_ZDC_C (Pb) L1_ZDC L1_ZDC_A_C
PVtrk
n 0 50 100 150 200 250 300 350 400
Efficiency
0 0.2 0.4 0.6 0.8 1
ATLAS Preliminary p+Pb Data 2013
=5.02 TeV sNN
L1_ZDC_C (p) L1_ZDC_A (Pb) L1_ZDC L1_ZDC_A_C
PVtrk
n 0 50 100 150 200 250 300 350 400
Efficiency
0 0.2 0.4 0.6 0.8 1
ATLAS Preliminary Pb+p Data 2013
=5.02 TeV sNN
L1_ZDC_A (p) L1_ZDC_C (Pb) L1_ZDC L1_ZDC_A_C
Figure 9: E
fficiency of L1 trigger based on ZDC signals as a function of
ΣE
TPb(upper panels) and the number of reconstructed tracks (lower panels) for p
+Pb (left column) and Pb
+p collisions. In the case of single side triggers (L1 ZDC A and L1 ZDC C) the same symbols are used to denote a detector registering fragmentation of protons (p) or lead nuclei (Pb) rather than the device on the side A or C.
Trigger Collision type Purity [%]
L1 ZDC A p+Pb (period A) 85.9
±0.2 L1 ZDC A Pb
+p (period B) 37.0
±0.4 L1 ZDC C p+Pb (period A) 36.8
±0.4 L1 ZDC C Pb
+p (period B) 85.8
±0.2 L1 ZDC A C p+Pb (period A) 75.7
±0.5 L1 ZDC A C Pb+p (period B) 76.8
±0.5 L1 ZDC p
+Pb (period A) 76.2
±0.2 L1 ZDC Pb+p (period B) 74.3
±0.2
Table 5: Purity of ZDC seeded triggers, averaged over all runs in a data taking period. The dependence
on proton and Pb beam directions is clearly visible.
Date
20-Jan 27-Jan 03-Feb 10-Feb
Purity
0.2 0.4 0.6 0.8 1
ATLAS Preliminary p+Pb Data 2013
=5.02 TeV SNN
L1_ZDC L1_ZDC_A L1_ZDC_C
Date
20-Jan 27-Jan 03-Feb 10-Feb
Purity
0 0.2 0.4 0.6 0.8 1
ATLAS Preliminary p+Pb Data 2013
=5.02 TeV SNN
L1_ZDC L1_ZDC L1_ZDC_A_C
Figure 10: Purity of ZDC seeded triggers as a function of time.
MBTS signal [pC]
0 10 20 30 40 50 60 70 80 90
eventsN
1 10 102
103
104
105
ATLAS Preliminary p+Pb Data
=5.02 TeV sNN
module A00
2012 2013
MBTS signal [pC]
-0.1 0 0.1 0.2 0.3 0.4 0.5 0.6 0.7 0.8 0.9
eventsN
102
103
104
ATLAS Preliminary p+Pb Data
=5.02 TeV sNN
module A00
2012 2013
Figure 11: The distributions of the full range (left) of the signal for MBTS module A00 and of its low region (right) for events accepted by mbSpTrk trigger obtained in p+Pb collisions in the years 2012 (black) and 2013 (red). The distribution from the year 2013 was normalized to the same number of events as the 2012 reference data.
MBTS module
C00 C01 C02 C03 C04 C05 C06 C07 C08 C09 C10 C11 C12 C13 C14 C15 A00 A01 A02 A03 A04 A05 A06 A07 A08 A09 A10 A11 A12 A13 A14 A15
α
0.05 0.1 0.15 0.2 0.25 0.3 0.35
ATLAS Preliminary p+Pb Data
=5.02 TeV sNN
2012 2013
Figure 12: The slope parameter
αfrom the exponential parameterization (e
−αx) of the MBTS signal
distribution for all MBTS modules for events accepted by mbSpTrk trigger obtained in p+Pb collisions
in the years 2012 (black) and 2013 (red).
MBTS module
C00 C01 C02 C03 C04 C05 C06 C07 C08 C09 C10 C11 C12 C13 C14 C15 A00 A01 A02 A03 A04 A05 A06 A07 A08 A09 A10 A11 A12 A13 A14 A15
> [pC]MBTSnoise<E
-0.01 -0.005 0 0.005 0.01 0.015 0.02
ATLAS Preliminary p+Pb Data
=5.02 TeV sNN
2012 2013
MBTS module
C00 C01 C02 C03 C04 C05 C06 C07 C08 C09 C10 C11 C12 C13 C14 C15 A00 A01 A02 A03 A04 A05 A06 A07 A08 A09 A10 A11 A12 A13 A14 A15
) [pC]noise MBTS(Eσ
0 0.005 0.01 0.015 0.02 0.025 0.03
ATLAS Preliminary p+Pb Data
=5.02 TeV sNN
2012 2013
Figure 13: Noise parametrization in MBTS counters obtained from the fit of a Gaussian function: the mean position of the noise peak (left) and the width of the noise peak (right). Black and red points were obtained for p+Pb data taken in 2012 and 2013 respectively.
In the right panel of Fig. 11 details of the signal distribution at very low values are shown. The approximately Gaussian peak is due to events without a single charged particle hitting this module and reflects the noise in the electronics. Properties of the noise can be characterized by the parameters of a Gaussian fit shown in Fig. 13. The mean position of the maximum is very close to zero, however deviations from zero are not fully random. The noise parameters in modules are strongly correlated in 2012 and 2013 data, even if there is a small systematic shift of the mean and a slight increase of the width.
In Fig. 14 trigger e
fficiencies are shown for all MBTS based triggers available in the p
+Pb run:
L1 MBTS 1, L1 MBTS 2, L1 MBTS 1 1, L1 MBTS 2 2, L1 MBTS 3 3 and L1 MBTS 4 4 as a function of the
ΣE
PbTtransverse energy and the number of reconstructed tracks. The first two of them are almost 100% ef- ficient starting from very peripheral events, while all of them reach a plateau region for
ΣE
TPb>0.03 TeV.
The L1 MBTS 1 1 trigger which collected a majority of the MB events in the p
+Pb run is 100% e
fficient starting from 20 tracks. Efficiency of triggers shown in the bottom panels of Fig. 14 can not be directly compared with those presented in a previous note [4], as a di
fferent selection of reconstructed track was used in the previous studies.
In p+Pb collisions we do not observe trigger inefficiency at larger
ΣE
TPbvalues, which was seen in Pb
+Pb collisions [4]. That ine
fficiency was explained as a by-product of large signals in the MBTS which lead to the pulse stretching and time not lining up with the LHC clock. With much lower total multiplicities in p+Pb collisions this effect is not present.
The trigger e
fficiencies presented in this Note were always obtained for event samples collected in all runs and were divided according to the collision type only. However, a change of MBTS detector perfor- mance could affect basic MBTS triggers used to select interesting events: L1 MBTS 1 1 and mbMbts 1 1.
The first is an L1 trigger used as a seed for the majority of the physics trigger chains while in the second a cut on the MBTS time di
fference is additionally applied in order to select a cleaner MB event sample.
This timing cut at the higher level allows to reject empty events accepted by L1 MBTS 1 1. In Fig. 15 we present efficiency of these two triggers as a function of time for two periods with different collision type. The e
fficiency of the mbMbts 1 1 trigger was calculated in four runs with p
+Pb collisions, as only in these runs was the mbMbts 1 1 trigger decision available for all events accepted by mbSpTrk trigger.
In this case the selection criteria are much more restrictive than in Fig. 14, as we want to reproduce the
cuts applied in the typical analysis of MB data. We request thus at least 2 tracks in the event, a recon-
structed vertex and an offline MBTS timing cut. The efficiency of L1 MBTS 1 1 is for such selection of
events 99.35%. The efficiency of the mbMbts 1 1 trigger is practically the same, in the runs for which
comparison was possible only 20 events out of over 200 000 fulfilling the o
ffline cuts were lost at the EF
[TeV]
FCal,Pb
ET
Σ
0 0.05 0.1 0.15
Efficiency
0 0.2 0.4 0.6 0.8 1
ATLAS Preliminary p+Pb Data 2013
=5.02 TeV sNN
L1_MBTS_1 L1_MBTS_2 L1_MBTS_1_1 L1_MBTS_2_2 L1_MBTS_3_3 L1_MBTS_4_4
[TeV]
FCal,Pb
ET
Σ
0 0.05 0.1 0.15
Efficiency
0 0.2 0.4 0.6 0.8 1
ATLAS Preliminary Pb+p Data 2112
=5.02 TeV sNN
L1_MBTS_1 L1_MBTS_2 L1_MBTS_1_1 L1_MBTS_2_2 L1_MBTS_3_3 L1_MBTS_4_4
PVtrk
n
2 4 6 8 10 12 14 16 18 20
Efficiency
0 0.2 0.4 0.6 0.8 1
ATLAS Preliminary p+Pb Data 2013
=5.02 TeV sNN
L1_MBTS_1 L1_MBTS_2 L1_MBTS_1_1 L1_MBTS_2_2 L1_MBTS_3_3 L1_MBTS_4_4
PVtrk
n
2 4 6 8 10 12 14 16 18 20
Efficiency
0 0.2 0.4 0.6 0.8 1
ATLAS Preliminary Pb+p Data 2013
=5.02 TeV sNN
L1_MBTS_1 L1_MBTS_2 L1_MBTS_1_1 L1_MBTS_2_2 L1_MBTS_3_3 L1_MBTS_4_4
Figure 14: L1 MBTS X trigger e
fficiency as a function of
ΣE
TPb(upper panels) and the number of re- constructed tracks (lower panels) for p+Pb (left column) and Pb+p collisions. In this case in place of cuts on MBTS time, a small difference of the time registered by the Liquid Argon Calorimeter,
|tLAr,C−
t
LAr,A|<10 ns, was requested.Date
Jan 21 Jan 22 Jan 23 Jan 24 Jan 25 Jan 26 Jan 27 Jan 28 Jan 29 Jan 30 Jan 31 Feb 01
Efficiency
0.98 0.985 0.99 0.995 1
ATLAS Preliminary p+Pb Data 2013
=5.02 TeV sNN
> 1
PV
ntrk
| < 10 ns
MBTS,A MBTS,C - t
| t L1_MBTS_1_1 mbMbts_1_1
Date
Feb 02 Feb 03 Feb 04 Feb 05 Feb 06 Feb 07 Feb 08 Feb 09 Feb 10
Efficiency
0.98 0.985 0.99 0.995 1
ATLAS Preliminary Pb+p Data 2013
=5.02 TeV sNN
> 1
PV
ntrk
| < 10 ns
MBTS,A MBTS,C - t
| t L1_MBTS_1_1
Figure 15: Total L1 MBTS 1 1 and mbMbts 1 1 trigger e
fficiency as a function of time for p
+Pb (left) and Pb+p (right) collisions. The events were selected by the mbSpTrk trigger, they were required to fulfill standard requirements applied in the MB analysis at least 2 tracks, reconstructed vertex and a small di
fference of the time registered in MBTS,
|tMBT S,C−t
MBT S,A|<10 ns. Efficiency of mbMbts 1 1 trigger was calculated in four runs with p+Pb collisions only.
Trigger Purity [%]
L1 MBTS 1 22.91
±0.04 L1 MBTS 2 34.79
±0.06 L1 MBTS 1 1 38.51
±0.07 L1 MBTS 2 2 42.15
±0.07 L1 MBTS 3 3 44.58
±0.07 L1 MBTS 4 4 46.70
±0.07
Table 6: Purity of L1 MBTS seeded triggers. See text for definitions of triggers.
trigger level. In these events the MBTS time estimate at EF was obviously different than in the offline reconstruction, these events have lower than the average track multiplicity and larger o
ffline MBTS time di
fference
|tMBT S,C−t
MBT S,A|.Purity has also been measured for the MBTS triggers. The values for several triggers are shown in
Table 6. In addition to the previously discussed triggers, the purity of L1 MBTS 3 3 and L1 MBTS 4 4
(triggers which require on each side hits in at least three and in at least four modules, respectively) is
included. It is observed that the purity of the triggers is low, even for the most restrictive L1 MBTS 4 4
trigger whose purity of 46.7% is much smaller than the purity of the L1 ZDC A C trigger which was shown
to be
∼76%. As expected, the timing requirement required at L2 for mbMbts 1 1 selection, increases
the purity. The dependencies as a function of the data taking time have been found to be insignificant
(see Fig. 16).
Date
20-Jan 27-Jan 03-Feb 10-Feb
Purity
0.2 0.4 0.6 0.8
1 ATLAS Preliminary p+Pb Data 2013
=5.02 TeV SNN
L1_MBTS L1_MBTS_1 L1_MBTS_2 L1_MBTS_1_1
Date
20-Jan 27-Jan 03-Feb 10-Feb
Purity
0 0.2 0.4 0.6 0.8
1 ATLAS Preliminary p+Pb Data 2013
=5.02 TeV SNN
MBTS L1_MBTS_2_2 L1_MBTS_3_3 L1_MBTS_4_4