ATLAS-CONF-2010-021 13July2010
ATLAS NOTE
April 10, 2010
Performance of the ATLAS tau trigger in p-p collisions at √ s = 900 GeV
1
The ATLAS Collaboration
2
Abstract
3
This note describes the analysis of quantities used for the hadronic tau trigger, using
4
data collected with the ATLAS detector at √ s = 900 GeV. A comparison of the level 1 and
5
the high level trigger performance for data and Monte Carlo is done. During 2009 data
6
taking, only the level 1 conditions were required online while the high level trigger was run
7
in monitoring mode. A comparison of tau trigger rates between cosmic ray and collision
8
data has also been performed.
9
1 Introduction
10
The tau lepton, being the heaviest of all known leptons (m
τ= 1776 . 84 ± 0 . 17 MeV), is of special impor-
11
tance. Triggering on tau events will not only help in understanding Standard Model (SM) processes dur-
12
ing early running but will also increase the discovery potential of the ATLAS detector through searches
13
for the Higgs boson and supersymmetric particles at high luminosities. Due to its short lifetime, with
14
(cτ = 87 . 11µ m), taus decay inside the beam pipe. The identification of tau is, therefore, done through
15
its decay products inside the detector.
16
The tau lepton decays into electrons or muons 35% of the time, while 65% of its decays include
17
hadrons, mostly pions. The events where taus decay into leptons can be triggered by low transverse-
18
energy-threshold electron triggers and low transverse-momentum-threshold muon triggers. A dedicated
19
tau trigger has been designed and implemented at the ATLAS experiment [1] to select events where a tau
20
lepton decays into one or more hadrons. A tau jet can be identified by the presence of a well collimated
21
calorimeter cluster with a small number of associated tracks.
22
The ATLAS trigger system [2] is divided into a hardware-based component, level 1 (L1), and
23
software-based parts level 2 (L2) and event filter (EF). L2 and EF are referred to together as the high level
24
trigger (HLT). The L1 trigger identifies regions-of-interest (RoI) using the information from calorimeter
25
and muon systems. The decision time at L1 is ∼ 2 . 5 µ s. L2 takes these RoIs as input and refines the
26
object identification using the information from all the subsystems. The latency at L2 is ∼ 40 ms. In
27
the EF algorithms similar to the offline reconstruction are run to select interesting events. The allowed
28
processing time at EF is approximately 4 s.
29
The tau trigger is designed to select hadronic decays of the tau, which are characterized by the
30
presence of one or three charged pions accompanied by a neutrino and possibly neutral pions. At L1,
31
the tau trigger uses the electromagnetic (EM) and hadronic (HAD) calorimeter trigger towers of size
32
∆η × ∆φ = 0 . 1 × 0 . 1 to calculate the energy in a core and an isolation region. At L2, selection criteria are
33
applied using tracking and calorimeter based information. This takes advantage of narrowness and low
34
track multiplicity to discriminate taus from the multi-jet background. Exploiting the same characteristics,
35
the EF uses different selection criteria for 1-prong and multiprong decays in more refined algorithms
36
which are similar to the reconstruction algorithms. It is challenging to keep the rates for these triggers
37
low due to the high production rate of multi-jet events. Nevertheless it is advantageous to implement tau
38
triggers to increase the sensitivity of searches for new physics. The details of the ATLAS tau trigger are
39
described in [2, 3].
40
A clean sample of real hadronic tau decays will not be available in the early data. It is therefore im-
41
portant to consider whether some useful information can be extracted from fake taus which are copiously
42
produced in multijet events. The goal is to collect a large enough data sample to check the performance
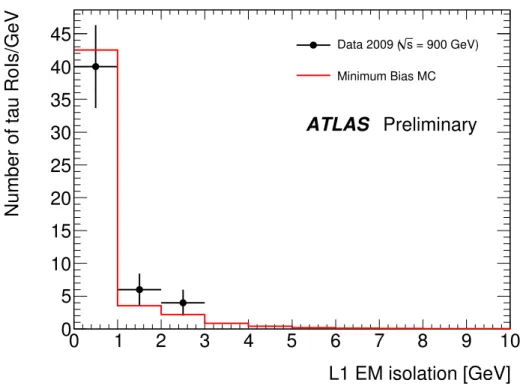
43
of the hadronic tau trigger. The collision and cosmic ray data at ATLAS have provided valuable handles
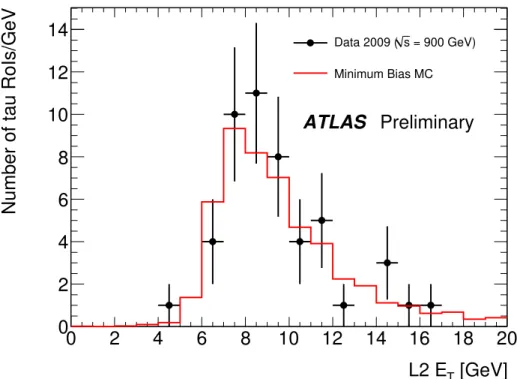
44
to optimize and commission the ATLAS detector. In this process the ATLAS tau trigger algorithms have
45
been exercised and the hardware-based first level rates studied.
46
The following sections describe an analysis of the variables related to the tau trigger in cosmic ray and
47
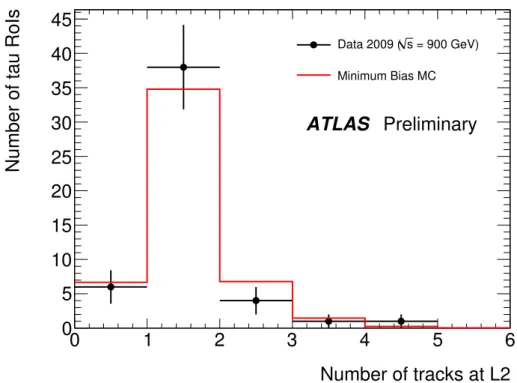
900 GeV collision data.
48
2 Analysis
49
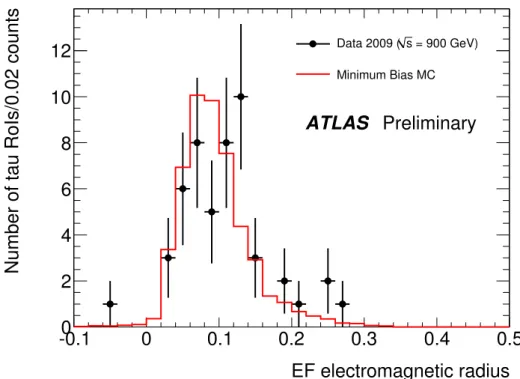
2.1 Data and MC samples
50
The collision data used in the analysis described in this and the following two sections consist of 12 runs
51
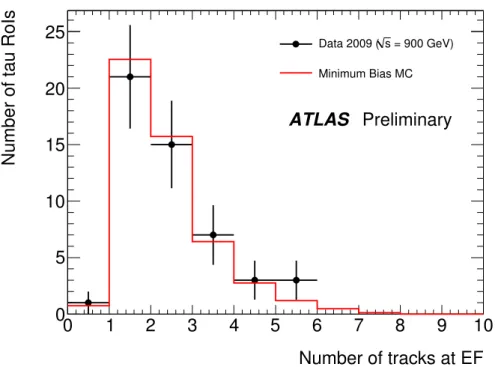
recorded in December 2009 at a center of mass energy of 900 GeV. Two different datasets using data
52
streams based on the L1 calorimeter and the Minimum Bias Trigger Scintillators (MBTS) decisions were
53
produced. To reject beam backgrounds, coincident signals from the MBTS were selected by requiring
54
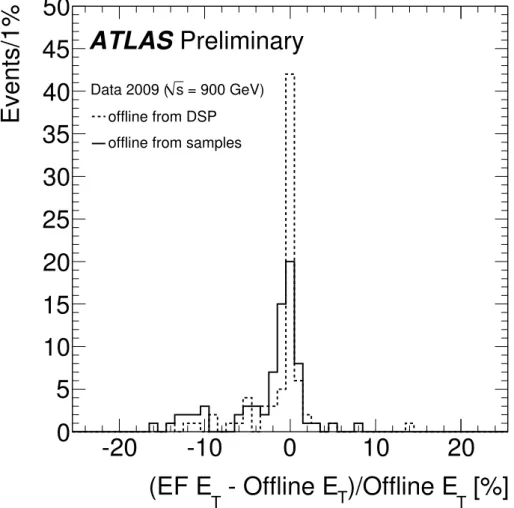
the difference in time measured by the two MBTS systems to be less than 10 ns in both data and MC. To
55
ensure the quality of data, a “good run” selection was applied. This requires stable beam conditions, run
56
declared good by the calorimeter
1and the inner detector to be on.
57
The minimum bias (MB) Monte Carlo (MC) sample used in this analysis was produced using
58
PYTHIA [4] and processed through a GEANT4 [5] based simulation of the ATLAS detector. The trigger
59
menu consistent with the one that ran online to collect data was used to simulate the trigger in MC.
60
2.2 Event selection
61
In order to reduce the presence of non-collision events in data, the events were required to have fired the
62
MBTS trigger [6]. Furthermore, to optimize the analysis procedure, data were filtered by requiring the
63
following selection criteria:
64
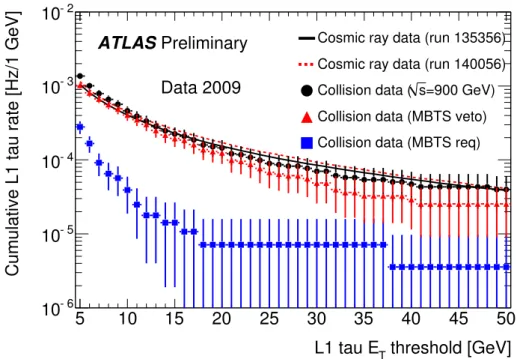
• at least one offline tau candidate reconstructed using the tauRec algorithm [2], with
65
– |η| < 2 . 5
66
– at least one track associated to it. The track should have
267
∗ P
T> 1 GeV
68
∗ a minimum of one hit in the pixel detector and six hits in the Semi-Conductor Tracker
69
(SCT).
70
In a data sample of 2247 events, 1249 events had at least one offline tau candidate satisfying the
71
above mentioned requirements. A total of 1407 offline tau candidates were found in the selected events
72
in data.
73
3 Tau trigger plots
74
The tau trigger quantities analyzed in this section are documented in [2, 3].
75
In Figs. 1-9 we compare 900 GeV data with MB MC for relevant variables of the tau RoIs at the
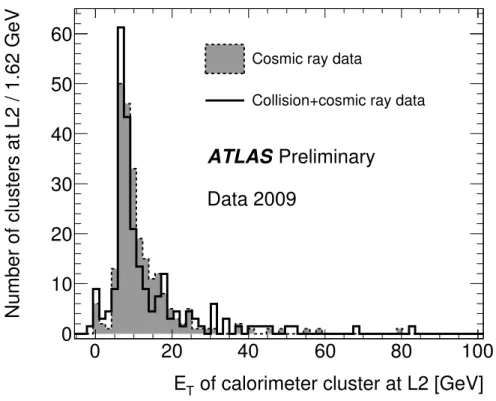
76
different trigger levels, where the MC distributions have been normalized to the number of entries in
77
the data distributions. In all of these plots the L1 trigger object with transverse energy above 5 GeV
78
(L1 TAU5) is required to match to an offline tau candidate. The requirements for offline tau candidates
79
were described in the previous section. The matching between the L1 and offline object is done by
80
requiring ∆R < 0 . 3 where ∆R =
q (∆η )
2+ (∆φ )
2. A total of 50, out of 1407, offline tau candidates
81
satisfied the matching requirement. The number of matched tau candidates is MC sample was found to
82
be 3762.
83
• Fig. 1 shows the L1 transverse energy (E
T) distribution, obtained around the L1 position
3adding
84
the contributions from the following two regions in the EM and HAD calorimeters respectively:
85
(i) a two-tower region (with granularity 0 . 1 × 0 . 1 in η × φ ) and (ii) a 0 . 2 × 0 . 2 region in η × φ . In
86
this and following figures, when no data points are present in some of the bins, this indicates the
87
absence of data entries in that interval.
88
1A green flag assigned by the Liquid Argon calorimeter means that there are no errors seen in the front end boards, no unmasked noisy or dead channels, and the shape of the signal is as expected. For the Tile calorimeter, a green flag means that the data, calibration and detector description are in agreement with current understanding of the detector.
2PTis the momentum measured in the plane transverse to the beam direction.
3The L1 position is the center of the 4×4 towers inη×φ(with granularity 0.1×0.1) of the L1 tau RoI determined by the L1 readout.
• Fig. 2 shows the L1 EM isolation quantity, obtained for the EM towers between 0 . 2 × 0 . 2 and
89
0 . 4 × 0 . 4 in η × φ around the previous L1 position.
90
• Fig. 3 shows the L2 E
Tdistribution, calculated in a region of ∆R < 0 . 1 around the L2 position.
491
• Fig. 4 shows the L2 EM fraction, which is the fraction of EM energy compared to the total L2
92
E
Tin a region of ∆R < 0 . 1 around the L2 position. The values below zero and above one appear
93
because the EM and HAD energies can be negative due to noise fluctuations. Due to the relative
94
volume of the EM and HAD calorimeters, cosmic ray events are more likely to deposit energy
95
in the HAD calorimeter than in the EM calorimeter. This explains the peak seen at 0. The peak
96
observed at 1 is due to the collision events which have large energy deposits in the EM calorimeter.
97
• Fig. 5 shows the number of tracks obtained with the L2 tracking algorithm IdScan [2] with a P
T>
98
1.5 GeV in a cone of ∆R < 0 . 1 about the L2 direction.
99
• Fig. 6 shows the EF E
Tdistribution, calculated from cells associated with the tau trigger candidate
100
in a region of ∆R < 0 . 4 around the EF direction.
101
• Fig. 7 shows the EF EM radius, a measure of the shower size in η -φ obtained from an energy
102
weighted ∆R of the cells associated with the tau trigger candidate around the EF position.
103
• Fig. 8 shows the EF HAD radius, calculated in a similar way to the EF EM radius but for the HAD
104
cells associated to the tau trigger candidate.
105
• Fig. 9 shows the number of tracks at the EF using the offline tau reconstruction algorithm [7], in
106
a region of ∆R < 0 . 3 around the tauJet seed direction as calculated from topological clusters.
5107
• Fig. 10 shows the fraction of the offline tau candidates that satisfy the selection criteria described
108
in Section 2.2 which match to a L1 trigger object with E
T> 5 GeV. The fraction is shown as a
109
function of the E
Tof the offline tau candidate. The dashed (solid) line represents fit to the data
110
(MC) points.
111
• Fig. 11 shows the relative energy difference between EF and offline using two different methods
112
for calculating E
Tduring the offline reconstruction. The first method uses the energy obtained in
113
the detector using digital signal processors (DSPs). This approach is more similar to the one used
114
by the HLT algorithms. The second method recalculates the E
Tusing the analog signal coming
115
from samples of cells which is less similar to the one used by the HLT, however more precise than
116
the former method. More details about calculating the offline E
Tare given in [8].
117
The selection criteria for Figure 11 require at least one offline tau candidate with |η | < 2 . 5 and
118
no track requirements imposed. A matching between the offline and EF tau candidate is required
119
(∆R < 0 . 3). There were 75 EF tau candidates in data that passed the event selection and the
120
matching criteria. The raw uncalibrated energy was used for both EF and offline tau candidates
121
to make the plot. One can see that a better comparison between the offline and EF energies is
122
observed when offline energy is calculated from DSPs.
123
4The L2 position is obtained after weighting the position of each cell by its energy. The cells in a region of∆R<0.15, around the L1 position are considered and energy is calculated using all of the calorimeter layers.
5Topological clusters are obtained with a topological algorithm which clusters together neighboring cells, as long as the signal in the cells is significant compared to noise. More information on this algorithm can be found in [2].
[GeV]
L1 E
T0 2 4 6 8 10 12 14 16 18 20
Number of tau RoIs/GeV
0 2 4 6 8 10 12 14 16 18 20
22
Data 2009 ( s = 900 GeV)Minimum Bias MC
ATLAS Preliminary
Figure 1: Comparison of the L1 tau candidate E
Tdistribution for 900 GeV data and MB MC. The cut off at 6 GeV corresponds to the L1 TAU5 threshold.
L1 EM isolation [GeV]
0 1 2 3 4 5 6 7 8 9 10
Number of tau RoIs/GeV
0 5 10 15 20 25 30 35 40
45
Data 2009 ( s = 900 GeV)Minimum Bias MC
ATLAS Preliminary
Figure 2: Comparison of the L1 tau candidate EM isolation distribution for 900 GeV data and MB MC.
[GeV]
L2 E
T0 2 4 6 8 10 12 14 16 18 20
Number of tau RoIs/GeV
0 2 4 6 8 10 12
14
Data 2009 ( s = 900 GeV)Minimum Bias MC
ATLAS Preliminary
Figure 3: Comparison of the tau candidate E
Tdistribution at L2 for 900 GeV data and MB MC.
L2 EM fraction
-0.2 0 0.2 0.4 0.6 0.8 1 1.2
Number of tau RoIs/0.05 counts
0 2 4 6 8 10 12 14 16 18
= 900 GeV) s
Data 2009 ( Minimum Bias MC
ATLAS Preliminary
Figure 4: Comparison of the tau candidate EM fraction distribution at L2 for 900 GeV data and MB MC.
The values below zero and above one appear because the EM and HAD energies can be negative due to
noise fluctuations.
Number of tracks at L2
0 1 2 3 4 5 6
Number of tau RoIs
0 5 10 15 20 25 30 35 40 45
= 900 GeV) s
Data 2009 ( Minimum Bias MC
ATLAS Preliminary
Figure 5: Comparison of the tau candidate number of tracks distribution at L2 for 900 GeV data and MB MC.
[GeV]
EF E
T0 5 10 15 20 25 30 35 40
Number of tau RoIs/2 GeV
0 2 4 6 8
10
Data 2009 ( s = 900 GeV)Minimum Bias MC
ATLAS Preliminary
Figure 6: Comparison of the tau candidate E
Tdistribution at EF for 900 GeV data and MB MC.
EF electromagnetic radius
-0.1 0 0.1 0.2 0.3 0.4 0.5
Number of tau RoIs/0.02 counts
0 2 4 6 8 10
12
Data 2009 ( s = 900 GeV)Minimum Bias MC
ATLAS Preliminary
Figure 7: Comparison of the tau candidate EM radius distribution at EF for 900 GeV data and MB MC.
EF hadronic radius
-0.1 0 0.1 0.2 0.3 0.4 0.5
Number of tau RoIs/0.02 counts
0 2 4 6 8 10
12
Data 2009 ( s = 900 GeV)Minimum Bias MC
ATLAS Preliminary
Figure 8: Distribution for the tau candidate HAD radius at EF for 900 GeV data and MB MC.
Number of tracks at EF
0 1 2 3 4 5 6 7 8 9 10
Number of tau RoIs
0 5 10 15 20
25
Data 2009 (s = 900 GeV)Minimum Bias MC
ATLAS Preliminary
Figure 9: Distribution for number of tracks associated to the tau candidate at EF for 900 GeV data and MB MC. The difference between the number of tracks distribution at L2 (Fig. 5) and that at EF (Fig. 9) is due to the difference in the requirement for the minimum p
Tof the track. At L2 the minimum p
Trequirement is 1.5 GeV, while at the EF it is 1 GeV.
of offline tau [GeV]
E
T0 5 10 15 20 25 30 35 40 45 50
Fraction of offline taus passing L1
0 0.2 0.4 0.6 0.8 1
=900 GeV) s
Data 2009 ( Minimum Bias MC
ATLAS Preliminary
Figure 10: Fraction of the offline tau candidates matched to a L1 trigger object with E
T> 5 GeV as a
function of the E
Tof the offline tau candidate. The dashed (solid) line represents fit to the data (MC)
points.
T [%]
)/Offline E - Offline E T
(EF E T
-20 -10 0 10 20
Events/1%
0 5 10 15 20 25 30 35 40 45 50
= 900 GeV) s
Data 2009 ( offline from DSP offline from samples
ATLAS Preliminary
Figure 11: Relative difference between EF and reconstructed transverse energy, when offline energy is
calculated using DSPs (dashed line) and digital signals from samples of cells (solid line).
4 Cosmic ray and collision data comparison
124
In this section a comparison between cosmic ray and collision data taken during 2009 is shown.
125
4.1 Data samples
126
For the cosmic ray reference samples, runs 135356 and 140056 from October and November 2009 have
127
been selected with 362,886 and 43,213 recorded events, respectively. The definition of the tau trigger
128
item with the lowest threshold was slightly different in both runs, but is accounted for in the normal-
129
ization. In the case of collision data, a list of good runs and luminosity blocks has been assembled in a
130
similar way to that described in Section 2.1. All data events are selected from the L1 calorimeter stream
131
by requiring at least one L1 tau RoI with E
T> 5 GeV.
132
4.2 Cumulative L1 tau rate vs. L1 tau E
Tthreshold
133
In Figure 12, the cumulative L1 tau object rate is plotted as a function of different E
Tthresholds for
134
cosmic ray and collision data. For a given threshold value, only tau objects with E
Tlarger than the
135
threshold are taken into account.
136
The histograms for the runs containing cosmic ray data are normalized to the number of bunches that
137
were used in the trigger item configuration for cosmic ray data taking. An additional correction for the
138
trigger dead-time has been applied which is shown as the average efficiency in Table 1.
139
The normalization of the collision data histograms is derived from the overall lifetime of the L1 TAU5
140
trigger item which is about 93577 seconds. This is very close to the integrated length of all luminosity
141
blocks considered (about 94160 seconds). Each entry in those histograms has been weighted by the
142
number of paired bunches in the corresponding luminosity block.
143
The black points represent all L1 tau trigger objects taken from the L1 calorimeter stream without
144
imposing any requirement on the MBTS trigger. From this distribution two subsets have been selected
145
by requiring the same MBTS trigger and timing constraints as described in Section 2.1 (blue boxes) and
146
vetoing on the MBTS trigger decision (red triangles). The former distribution should therefore consist
147
mostly of the tau trigger objects from collision events whereas the latter should be dominated by cosmic
148
ray events. A good agreement is observed between cosmic ray and non-MBTS collision data.
149
Run # bunches Avg. efficiency Overall scale factor
135356 3492 0.90 3 . 18 · 10
−4140056 3543 0.89 3 . 17 · 10
−4Table 1: Normalization for histograms from dedicated cosmic ray runs in Fig. 12. The last column contains the final normalization factor for the histograms.
5 Tau trigger data quality
150
The task of the ATLAS Tier-0 system [9] is to perform the prompt reconstruction of the raw data com-
151
ing from the online data acquisition system. The monitoring setup at Tier-0 provides an efficient way
152
of monitoring trigger related variables, to assure not only the expected performance of the trigger but
153
also the quality of data. The plots made during Tier-0 processing are a quick way to look at different
154
distributions and decide whether there are problems with the data before starting the bulk reprocessing
155
of the data.
156
threshold [GeV]
L1 tau E
T5 10 15 20 25 30 35 40 45 50
Cumulative L1 tau rate [Hz/1 GeV]
10
-610
-510
-410
-310
-2ATLAS Preliminary Data 2009
Cosmic ray data (run 135356) Cosmic ray data (run 140056)
=900 GeV) s
Collision data (
Collision data (MBTS veto) Collision data (MBTS req)
Figure 12: Cumulative L1 tau trigger rate as a function of the L1 tau object E
Tthreshold, normalized to one colliding bunch pair. For a given threshold value, the objects considered have a transverse energy greater than this value.
Monitoring of variables related to the tau trigger at Tier-0 not only assures the quality of data but also
157
provides a way to see the difference in the properties of cosmic ray and collision events. Two example
158
plots are shown in Figs. 13 and 14. These plots are made using the data that are promptly reconstructed
159
at Tier-0 without applying any data quality or offline selection criteria. Figure 13 demonstrates that the
160
energy variable alone does not discriminate between cosmic ray and collision events at 900 GeV. From
161
the data quality point of view, an exponentially falling distribution will show that the software and the
162
hardware related to the trigger are performing as expected. Fig. 14 shows that very few (or no) tracks
163
are expected in cosmic ray events selected by the tau trigger, while collision events occasionally contain
164
some tracks. This is important to monitor both online and offline as the absence of tracks in case of
165
collision events will be an indication of a hardware or software based problem.
166
6 Conclusions
167
We have shown an analysis of the cosmic ray and 900 GeV collision data collected with the ATLAS de-
168
tector in 2009. The distributions observed in data are compared with the expectations from MC samples.
169
Figures in Section 3 show that there is a reasonable agreement between data and MC expectations for
170
the variables used in the tau trigger selection.
171
The L1 turn-on curve is also shown and its behavior matches the MC expectation. The L1 rate plot
172
described in Section 4 demonstrates a good agreement in the rate for L1 TAU5 between cosmic ray and
173
non-MBTS collision data. Finally, Section 5 is an example of how to efficiently identify some problems
174
relevant to the tau trigger.
175
of calorimeter cluster at L2 [GeV]
E
T0 20 40 60 80 100
Number of clusters at L2 / 1.62 GeV
0 10 20 30 40 50 60
Cosmic ray data
Collision+cosmic ray data
ATLAS Preliminary Data 2009
Figure 13: E
Tof the calorimeter cluster found at L2. The solid histogram represents a run with cosmic ray and collisions events while the dashed filled histogram represents a cosmic ray run only. The data used in this plot have no data quality requirements or offline selection criteria applied.
Number of tracks associated with a cluster at L2
0 1 2 3 4 5
Number of clusters
0 50 100 150 200 250
Cosmic ray data
Collision+cosmic ray data
ATLAS Preliminary Data 2009
Figure 14: Number of tracks associated with a cluster at L2. The solid histogram represents a run with
cosmic ray and collisions events while the dashed filled histogram represents a cosmic ray run only. The
data used in this plot have no data quality requirements or offline selection criteria applied.
References
176
[1] The ATLAS Collaboration, G. Aad et al., The ATLAS Experiment at the CERN Large Hadron
177
Collider, JINST 3 (2008) S08003.
178
[2] The ATLAS Collaboration, G. Aad et al., Performance of the ATLAS Experiment-Detector, Trigger
179
and Physics, CERN-OPEN-2008-020; arXiv: 0901.0512[hep-ex]; 3 Volumes; ISBN:978-92-9083-
180
321-5 (2009).
181
[3] M. P. Casado et al., The ATLAS Tau Trigger, Proceedings of the Xth International workshop on tau
182
lepton Physics (Tau-08), Nucl.Phys.B, Proc.Suppl.189:291-298 (2009).
183
[4] T. Sjostrand, S. Mrenna, P. Skands, PYTHIA 6.4 physics and manual, JHEP 05 (2006) 026.
184
[5] S. Agostinelli, et al., GEANT4 Collaboration, GEANT4: A simulation toolkit, Nucl. Instr. Meth.
185
A506 (2003) 250-303.
186
[6] The ATLAS Collaboration, G. Aad et al., Performance of the ATLAS Minimum Bias Trigger in p-p
187
Collisions at √ s = 900 GeV, ATL-COM-DAQ-2010-017.
188
[7] The ATLAS Collaboration, G. Aad et al., Performance of the ATLAS Inner Detector Trigger algo-
189
rithms in p-p collisions at √ s = 900 GeV, ATL-COM-DAQ-2010-014.
190
[8] The ATLAS Collaboration, G. Aad et al., ATLAS High Level Calorimeter Trigger Software Perfor-
191
mance for First LHC Collision Events, ATL-COM-DAQ-2010-012.
192
[9] The ATLAS Collaboration, G. Aad et al., The ATLAS Computing Model, ATL-SOFT-2004-007,
193
CERN-LHCC-2004-037-G-085.
194