A TLAS-CONF-2010-022 13/07/2010
ATLAS NOTE
ATLAS-CONF-2010-022
May 20, 2010
Performance of the Electron and Photon Trigger in p-p Collisions at √ s = 900 GeV
The ATLAS Collaboration
Abstract
This note summarises the performance of the electron and photon triggers which were
run online during the ATLAS data-taking period at the end of 2009. Approximately 20 µ b
−1of data have been collected at a centre-of-mass energy of 900 GeV with around half of the
data taken under stable beam conditions. During this period the Level-1 calorimeter trigger
was working reliably and a good agreement has been found between the energy calculated
at the trigger level compared to the offline. At Level-2 and Event Filter the quantities used
in the trigger selections have been compared to the corresponding offline quantities and also
here, a good agreement has been found. Furthermore, the Monte Carlo predictions appear
to model the data reasonably well.
1 Introduction
In December 2009 ATLAS recorded approximately 20 µ b
−1of proton-proton collision data at a centre- of-mass energy of 900 GeV with around 9 µb
−1of the 900 GeV data taken under stable beam conditions.
The ATLAS trigger system is divided into three levels: the hardware-based first level trigger (L1), and the software-based second level trigger (L2) and Event Filter (EF), collectively referred to as the High Level Trigger (HLT). During the whole of the 2009 data taking period, the L1 trigger was running online.
The L2 and Event Filter algorithms were commissioned shortly after and the HLT was run but without rejecting any events during the stable beam data-taking periods. The objects passing the L1 electromag- netic calorimeter (EM) trigger arise mainly from photons (γ) from π
0decays, electrons (e) from photon conversions and hadrons faking electrons and photons. The transverse energy spectrum after the selec- tion by the least energetic L1 EM trigger lies between 4 and 10 GeV, which is the energy range of the lowest electron trigger foreseen for the first physics run set up to select J /Ψ → ee events.
The following section gives a short overview of the trigger algorithms to select electron and photon can- didates. The datasets and event selection cuts are explained in section 3 and section 4 shows some results of the L1 electromagnetic calorimeter performance. In section 5 results are shown of the performance of the e/γ HLT algorithms.
2 Electron and photon trigger algorithms
Electrons and photons are reconstructed in the trigger in |η | < 2.5. In this region the EM calorimeter has a fine segmentation in both the lateral (η × φ space) and longitudinal directions of the shower. At high energy most of the shower energy is collected in the second layer which has a lateral granularity of 0.025 × 0.025 in η × φ space. The first layer consists of finer-grained strips in the η-direction (with a coarser granularity in φ ), which offer excellent γ − π
0discrimination. These two layers are comple- mented by a presampler layer placed in front with coarse granularity to correct for energy lost in the material before the calorimeter, and by a third EM layer, which enables a correction to be made for the tail of very highly energetic EM showers. The electron trigger also uses the information of the ATLAS inner detector, which provides precise track reconstruction over | η | < 2.5. It consists of three layers of pixel detectors close to the beam-pipe, four layers of silicon microstrip detectors (SCT) providing eight hits per track at intermediate radii, and a transition radiation tracker (TRT) at the outer radii, providing about 35 hits per track (in the range | η | < 2.0). More information on the detector layout can be found in [1]. At L1, photons and electrons are selected within |η| < 2.5 using calorimeter information with the re- duced granularity of so-called trigger towers (TT) which have a dimension of ∆η × ∆φ ≈ 0.1 × 0.1. In each trigger tower all the cells of the electromagnetic or hadron calorimeter are summed, with the ex- ception of the fourth layer of the hadronic endcap and the barrel-endcap gap scintillators. Clustering is done by looking for local maxima with a sliding window algorithm using 4 × 4 trigger towers. The most energetic of the four 1 × 2 or 2 × 1 combinations of the 2 × 2 core has to pass the electromagnetic cluster threshold.
Seeded by the position of the L1 cluster, the L2 photon and electron selection deploys a fast calorimeter reconstruction algorithm and in the case of electrons also fast track reconstruction. The default calorime- ter reconstruction works in a similar way to the offline algorithms. Compared to the offline, the following differences arise:
• at L2 cells in a region of ∆η × ∆φ = 0.4 × 0.4 around the L1 seed position are retrieved. Cluster seed finding is done using the hottest cell in the second EM layer in the smaller region of ∆η ×
∆φ = 0.2 × 0.2. In the offline cluster reconstruction there is an additional step to do cluster finding
using a sliding window algorithm.
• the cluster size at L2 is ∆η × ∆φ = 3 × 7, where one unit refers to the cell size in the second layer of the EM calorimeter which has a size of 0 . 025 × 0 . 025. This needs to be compared to the cluster sizes in the offline which for electrons are 3 × 7 clusters in the barrel region and 5 × 5 clusters in the endcap. For photons the cluster sizes are 3 × 5 (3 × 7) in the barrel for reconstructed unconverted (converted) photons and 5 × 5 in the endcap
• the trigger uses as input the cell energies provided by the calorimeter Read-out Driver Boards (ROD) which reconstruct the deposited energy and the arrival time using an optimal filtering al- gorithm. In the offline the optimal filtering is re-done in order to allow studies and adjustments of the readout timing and to provide the best possible estimate of the offline cell energies. This is a feature in the start-up period and once all cells are propertly timed in, this iteration will no longer be needed.
• at L2, compared to the offline, a slightly older version of the cluster corrections (e.g. leakage of the EM cluster out of the 3 × 7 window) is used.
For the track reconstruction three different tracking algorithms are available which are currently being explored: SiTrack, IdScan and TRTSegFinder. In the studies shown here only results from IdScan are presented. IdScan uses fast pattern recognition by first determining the z-position of the interaction point along the beam axis and then performing combinatorial tracking only inside groups of space points that point back to that determined position. After the calorimeter and tracking reconstruction, so-called hypothesis algorithms are run to identify good electron and photon candidates and reject fakes coming predominantly from jets. The selections are based on analysing the cluster shower shapes, the tracking information and cluster-track matching quantities.
The EF uses the same reconstruction algorithms as are used offline. Due to timing constraints brems- Trigger
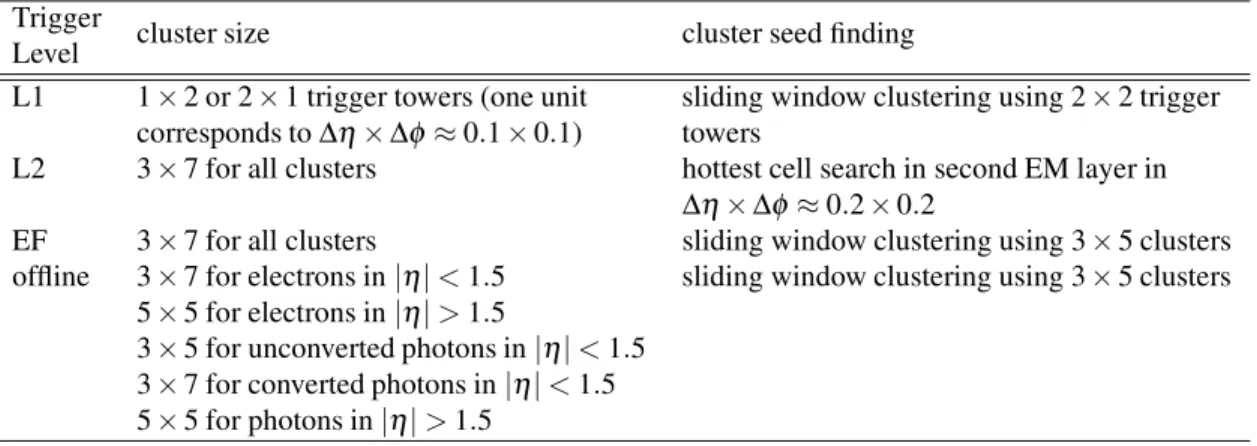
Level cluster size cluster seed finding
L1 1 × 2 or 2 × 1 trigger towers (one unit sliding window clustering using 2 × 2 trigger corresponds to ∆ η × ∆ φ ≈ 0.1 × 0.1) towers
L2 3 × 7 for all clusters hottest cell search in second EM layer in
∆ η × ∆ φ ≈ 0.2 × 0.2
EF 3 × 7 for all clusters sliding window clustering using 3 × 5 clusters offline 3 ×7 for electrons in | η | < 1.5 sliding window clustering using 3 × 5 clusters
5 × 5 for electrons in | η | > 1.5
3 × 5 for unconverted photons in | η | < 1.5 3 × 7 for converted photons in | η | < 1.5 5 × 5 for photons in | η | > 1.5
Table 1: Overview of cluster sizes and cluster finding algorithms used in the trigger and the offline. Note, unless stated differently the cluster sizes are expressed in units corresponding to one cell in the second EM layer (∆η × ∆φ ≈ 0.025 × 0.025).
strahlung recovery is not applied. As in the offline, cluster reconstruction is done using a sliding window algorithm acting on towers containing the energy summed in depth by regions. After this seed-finding step, fixed window clusters of size 3 × 7 are built starting from the second EM layer. New energy- weighted η and φ positions are calculated and subsequently cluster building is extended to the other layers of the EM calorimeter. As at L2 the cell energies used are those retrieved from the ROD’s.
Table 1 summarises the cluster sizes and cluster-finding algorithms used at the different trigger levels and
in the offline. More details on the L1 calorimeter trigger and the electron and photon HLT trigger can be
found in [2]. Track reconstruction is done as in the offline by a combination of tracking starting from hits
in the Silicon detectors and TRT standalone tracking. More results on the tracking performance in the first 900 GeV collisions can be found in [3]. An overview of the electron and photon offline performance in data is given in [4].
3 Datasets, trigger menu and selection cuts
The following analysis is based on a data sample collected at √ s = 900 GeV. The events are triggered by the minimum bias triggers or by the electromagnetic L1 calorimeter trigger. The Minimum Bias Trigger Scintillators (MBTS) cover the region 2.09 < | η | < 3.84 and are mounted at | z | = 3.6 m between the inner tracking detector and the EM endcap calorimeter. The events were required to fulfill the criteria for good collision candidates. To reject beam related background and cosmic muon event signals, the time differences between signals in the two sides of the minimum bias scintillators or the endcap electromag- netic calorimeters must be within 10 ns and 5 ns, respectively. Only runs passing the EM calorimeter data quality criteria were used. For studies of the electron tracking performance there is the additional requirement that the Inner Detector was fully functional and was at nominal high voltage.
The so-called EM3 trigger is the lowest L1 electromagnetic trigger implemented. It accepts electron and photon candidates if the cluster signal is above three trigger counts, where one count corresponds to approximately 1 GeV. This trigger subsequently seeds the HLT electron and photon selection chain e5 NoCut IdScan, which executes the electron and photon reconstruction and selection algorithms, but does not apply any selection cuts. This trigger was not run in the very first days of data taking but was commissioned shortly afterwards and switched on during stable beam conditions up to the end of the data taking period.
To avoid problems in the cluster building step due to too-small energy deposits in the second EM sam- pling, the offline cluster matched to the trigger one is required to have at least 30% of its energy in this layer. Note that electron and photon candidates selected by the offline with E
T> 2.5 GeV deposit on average 50 − 60 % of the energy in this layer (see [4]), a real electron or photon would deposit on average even more.
Most of the particles produced in 900 GeV collision events are low-momentum particles. The p
Tspec- trum falls exponentially and thus, out of about 400000 collision events selected by the MBTS triggers under stable beam conditions, only around 500 e/γ candidates pass the EM3 trigger. For the HLT-based studies, the same coverage in rapidity is used as in [4]. Trigger clusters are considered if the matched offline one is within |η| < 2.37 ( |η | < 2.47) for photons (electrons). In addition, electron and photon can- didates in the complicated barrel/endcap transition region 1 . 37 < |η| < 1 . 52 are excluded. As the HLT was not running at the beginning of the data taking only approximately 150 clusters at trigger level were matched to an offline photon candidate after the event and cluster selection cuts and are thus available for calorimeter studies. To study the tracking performance around 100 electron-like objects are available.
For Monte Carlo (MC) comparisons a sample of 10 million events of 900 GeV non-diffractive minimum bias events generated with Pythia, using the ATLAS tuning [5] has been used. The generated events were processed by the full ATLAS simulation and reconstruction software. For the comparisons pre- sented here, the Monte Carlo distributions are normalised to the number of events in the data sample.
4 L1 electromagnetic calorimeter trigger performance
The L1 calorimeter trigger was operational during the whole collision data taking period. Looking at
the collision events triggered by the minimum bias scintillators one can determine the fraction of events
which were also selected by the EM3 trigger which found at least one EM cluster above 3 trigger counts.
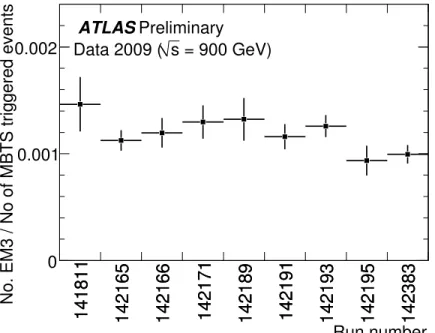
Figure 1 shows this fraction as a function of the run number. In this figure only runs with at least 20000
Run number
141811 142165 142166 142171 142189 142191 142193 142195 142383
141811 142165 142166 142171 142189 142191 142193 142195 142383
No. EM3 / No of MBTS triggered events
0 0.001
0.002 Data 2009 ( ATLAS Preliminary s = 900 GeV)
Figure 1: Fraction of events in which the L1 EM3 trigger found at least one cluster above 3 trigger counts within the data selected by the minimum bias scintillators (MBTS) as a function of the run number. This fraction is given with respect to the number of events selected by the minimum bias trigger. Only runs which contained more than 20000 collision candidates were taken into account.
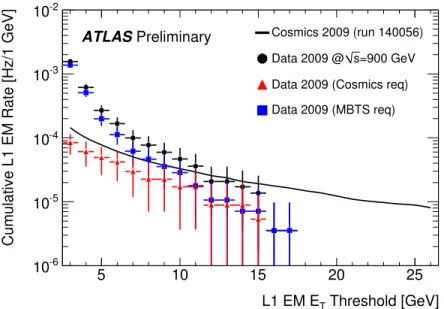
collision candidates have been considered. It can be seen that during most of the data taking period the fraction of events selected by EM3 was relatively stable. Figure 2 shows the L1 EM rate, normalised to correspond to one pair of colliding bunches, as a function of the E
Tthreshold cut applied for events selected by the EM3 trigger. The rate is also shown separately for collision candidates selected by the timing difference in the two sides of the minimum bias scintillators and for muons from cosmic ray events most of which fail the MBTS trigger selection. The latter rate can be compared to the rate found in a cosmic muon data-taking run, corrected for the trigger deadtime, and a reasonable agreement between these two rates is seen. As expected for events from 900 GeV collisions, the rate is higher than for muons from cosmic rays which only very occasionally deposit a significant amount of energy in the EM calorimeter.
Using the data selected by the minimum bias triggers the turn-on of the EM3 trigger has been extracted.
For this purpose the event and offline cluster selection criteria described in section 3 were applied and it was required that stable beam conditions were established. Reconstructed offline clusters in the rapidity regions | η | < 0.15 and 1.35 < | η | < 1.55 were removed as in the first region there have been known L1 timing problems in the third EM layer and in the second region only the endcap calorimeter was connected to the trigger towers. Both of these issues are fixed now. After this selection around 2500 clusters are retained, approximately 500 of them have been matched to a L1 cluster. The matching criterion is that the L1 and offline cluster positions has to be within ∆R = p
(∆η )
2+ (∆φ )
2< 0.15. It should be noted that the vast majority of reconstructed clusters arise from fakes. Due to the limited statistics no tighter offline criteria have been applied to select more electron and photon-like objects.
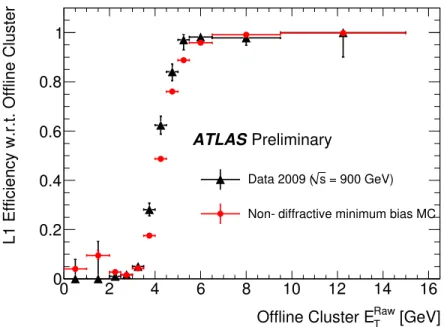
Figure 3 shows the L1 efficiency for the EM3 trigger as a function of the raw offline cluster transverse
Threshold [GeV]
L1 EM E
T5 10 15 20 25
Cumulative L1 EM Rate [Hz/1 GeV]
10
-610
-510
-410
-310
-2ATLAS Preliminary
Cosmics 2009 (run 140056)=900 GeV s
Data 2009 @
Data 2009 (Cosmics req) Data 2009 (MBTS req)
Figure 2: L1 EM trigger rate as a function of the threshold for cosmic and collision candidates. Overall rates are shown for all events passing the EM3 trigger as well as for collision candidates for which the timing difference in the two sides of the minimum scintillators is required to be within 10 ns (MBTS req). In addition, the event rate passing the requirement for muons from cosmic ray events (cosmic req) are shown These muons are selected by EM3 but not the MBTS trigger. Furthermore, the rate for one run taken during cosmic ray data taking is given. This is evidence that the events failing the MBTS selection arise predominantly from cosmic muons. The rates are normalised to correspond to one pair of colliding bunches.
energy. For the offline clusters no cluster corrections are applied. Thus, as at L1 no dead material effects are taken into account. This choice also avoids the feature of occasional cluster energy overcorrections for losses upstream and downstream of the EM calorimeter, which can happen for some of the clusters from fakes. The calibration is based on simulated electrons and photons and more details can be found in [2]. Figure 3 shows that the L1 efficiency is above 95% for an offline cluster E
T> 6 GeV. For high transverse energies the efficiency is statistically consistent with one. A good agreement between data and simulation is found for the turn-on behaviour. For offline E
Tvalues below 3 GeV a small bump is visible which arises from clusters with nearby energy deposits which affects around 20 of the 10 million simulated events. At L1 the energy of the cluster and the nearby deposits are summed due to the larger region used for calculating the cluster-E
T(0.1 × 0.2). Thus this additional nearby energy might be just enough to pass the L1 threshold. Looking at the origin of these clusters in the simulation has revealed that nearly all of these clusters are from fakes coming from hadrons. This effect is not present in the data due to the limited statistics.
5 Performance of the HLT e/γ trigger algorithms
During most of the data-taking period the HLT was running online during stable beam conditions. In
this section performance results from the analysis of these data are shown which demonstrate the correct
functioning of the e/γ trigger. Similar to the offline identification, at L2 and the EF the shower shape
quantities and the leakage into the hadronic calorimeter are examined to decide if they are compatible
with signals from electrons and photons. In addition, for clusters matched with a track cluster-track
[GeV]
Raw
Offline Cluster E
T0 2 4 6 8 10 12 14 16
L1 Efficiency w.r.t. Offline Cluster
0 0.2 0.4 0.6 0.8 1
= 900 GeV) s
Data 2009 (
ATLAS Preliminary
= 900 GeV) s
Data 2009 (
Non-diffractive minimum bias MC
Figure 3: L1 efficiency for the trigger selecting electromagnetic clusters above 3 counts ( ≈ 3 GeV) as a function of the raw offline cluster transverse energy. The turn-on is shown for data (black triangles) and MC simulation (red points).
matching variables at L2 and EF are compared to the distributions found by the offline. This is done for matching tracks reconstructed by first looking for track segments in the pixel and Silicon-strip detectors which are then extrapolated into the TRT. In the following a comparison of these quantites with results from the offline and with simulations will be shown. The analysis is based on clusters reconstructed in the HLT in regions around a L1 EM3 seed. These clusters were required to match to an offline photon or electron cluster. To match offline with a trigger cluster it was required that ∆R = p
(∆η)
2+ (∆φ )
2<
0.15. In addition, clusters had to pass the event and cluster selection cuts discussed in section 3. After all cuts around 150 clusters selected by the offline photon selection and 100 electron candidates are left for further analysis.
5.1 Calorimeter-based selection criteria
In the following, distributions of the calorimeter-based electron and photon identification cuts are com- pared with the shapes coming from simulation and the offline reconstruction. These studies are done for trigger objects matched to an offline photon candidate.
5.1.1 Comparison of data and Monte Carlo
In this section distributions of the calorimeter-based electron and photon identification cuts are compared
with the shapes coming from simulations. For the comparisons presented here, the Monte Carlo distri-
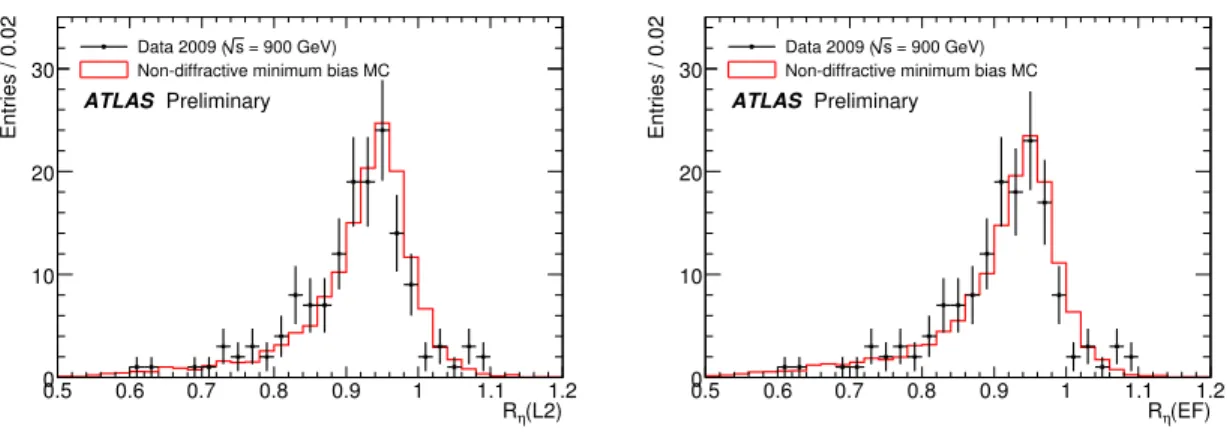
butions are always normalised to the sample of data events. One of the selection cuts, calculated based
on the information in the second EM layer, is called R
ηand is shown in Figure 4 for L2 and EF. This
quantity is the ratio of the energy deposited in the central ∆η × ∆φ = 3 × 7 cells divided by the energy
found in 7 × 7 cells. This quantity peaks towards one for electrons and photons which are well con-
tained within 3 × 7 cells. Note, the value of R
ηcan be above one due to the electronic shaping function
which is set up in such a way that noise contributions will fluctuate around zero instead of producing
η(L2)
0.5 0.6 0.7 0.8 0.9 1 1.1R 1.2
Entries / 0.02
0 10 20
30 Data 2009 (s = 900 GeV) Non-diffractive minimum bias MC ATLAS Preliminary
η(EF)
0.5 0.6 0.7 0.8 0.9 1 1.1R 1.2
Entries / 0.02
0 10 20
30 Data 2009 (s = 900 GeV) Non-diffractive minimum bias MC ATLAS Preliminary
Figure 4: Comparison of the distributions of the shower shape R
ηcalculated at L2 (left) and at EF (right) for data and simulation.
an offset. Thus cell energies can obtain negative values which might result in the total energy deposit in
∆η × ∆φ = 3 × 7 cells being larger than the one in 7 × 7 cells in case of small signals. Figure 4 shows a reasonable agreement between data and simulations.
Electron and photon triggers which select low E
Tobjects need to apply tighter selection than the ones
(L2) [GeV]
max1
0 0.5 1 1.5 2 2.5 E3 3.5 4
Entries / 0.1 GeV
0 5 10 15 20 25
= 900 GeV) s Data 2009 (
Non-diffractive minimum bias MC ATLAS Preliminary
(EF) [GeV]
max1
0 0.5 1 1.5 2 2.5 E3 3.5 4
Entries / 0.1 GeV
0 5 10 15 20 25
= 900 GeV) s Data 2009 (
Non-diffractive minimum bias MC ATLAS Preliminary
Figure 5: Comparison of the distributions of the energy found in the strip with maximal energy deposit in the first EM layer found at L2 (left) and at EF (right) for data and simulation.
at higher E
Tdue to rate constraints. Therefore, more selection criteria are used which rely on the shower shapes calculated in the first EM sampling. Due to the very fine granularity in rapidity, photons and π
0’s can be distinguished by looking for substructure within one cluster. This is done by looking at the so-called strips. Strips are formed using the cells belonging to a cluster. Depending on the cluster size and the position of the shower within a cell in this layer the energy of one or two cells in phi are summed. Figure 5 shows the comparison of the energy found in the strip with maximal energy (E max
1
)
in the first layer at L2 and EF for data and simulation. For this plot only clusters depositing at least 300 MeV of energy in this layer are considered. Again a reasonable agreement between data and simulation is found. E max
1
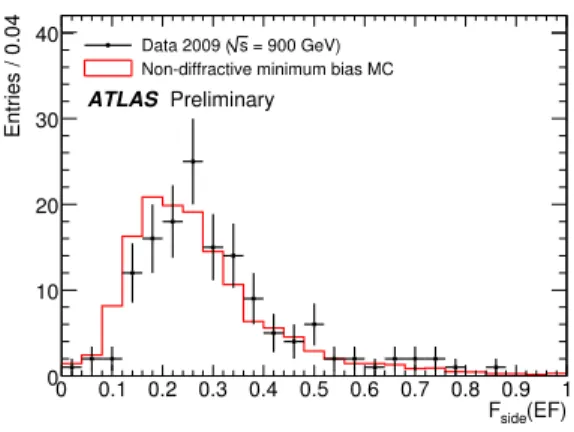
is the input to other selection variables used for e/γ identification such as F side, which
is the fraction of energy outside the shower core in the first EM layer. This quantity is defined as the
difference of the energy in ±3 and ±1 strips around the strip with highest energy divided by the energy in
side(EF) 0 0.1 0.2 0.3 0.4 0.5 0.6 0.7 0.8 0.9F 1
Entries / 0.04
0 10 20 30
40 Data 2009 (s = 900 GeV) Non-diffractive minimum bias MC ATLAS Preliminary
Figure 6: Distribution of F side calculated at the EF level for data and simulation.
±1 strips. This selection variable is used by the EF and the offline e/gamma selections, but currently not at L2 as this variable is less powerful in rejecting jets if applied in addition to other selection criteria. A data-simulation comparison is shown Figure 6. This distribution is shifted slightly towards higher values in the data than in the simulation, an effect which has also been observed in the offline [4].
All the electron and photon selection distributions shown here demonstrate a reasonable agreement be- tween data and simulation. The e/γ triggers foreseen for the first physics run at √ s = 7 TeV have been optimised in a robust and safe way using simulations. These results give a first indication that these triggers will be selecting electrons and photons according to the expectations.
5.1.2 Comparison of trigger and offline e/γ selection criteria
One of the steps of the commissioning of the e/γ triggers is the comparison of the identification criteria used at trigger level with those used in the offline. The EF and offline use the same selection quantities
(Event Filter) Rη
0.6 0.8 1 1.2
(Level-2)ηR
0.6 0.8 1 1.2
Entries
0 2 4 6 8 10 12 ATLAS Preliminary
= 900 GeV) s
Data 2009 (
,OFF
-Rη ,HLT
Rη
-0.04 -0.03 -0.02 -0.01 0 0.01 0.02 0.03 0.04
Entries / 0.001
1 10
102 Level-2 - offline Event Filter - offline
= 900 GeV) s
Data 2009 ( ATLAS Preliminary
Figure 7: Distribution of the shower shape variable R
ηfound at L2 versus the same quantity calculated at the EF level (left). On the right the difference in R
ηis shown between the values found by the trigger and the offline reconstruction.
whereas L2 only uses a subset. This will ensure minimal trigger biases when the trigger starts running
in active rejection mode. In the following, some of the quantities used in the trigger are compared to the
offline ones and also compared between L2 and EF. As an example the left plot in Figure 7 shows the
correlation between the shower shape variable R
ηcalculated in the second EM layer at L2 and EF and the right plot the difference of the R
ηvalues found in the HLT compared to the offline. For very few clusters different values for R
ηare found at L2 and EF. This is caused by clusters with nearby energy deposits.
In this case, it might happen that at L2 and EF slightly different cluster positions are reconstructed due to the differences in the cluster finding step (see Table 1). For isolated electrons and photons, which have a narrow transverse shower distribution, this problem will not arise.
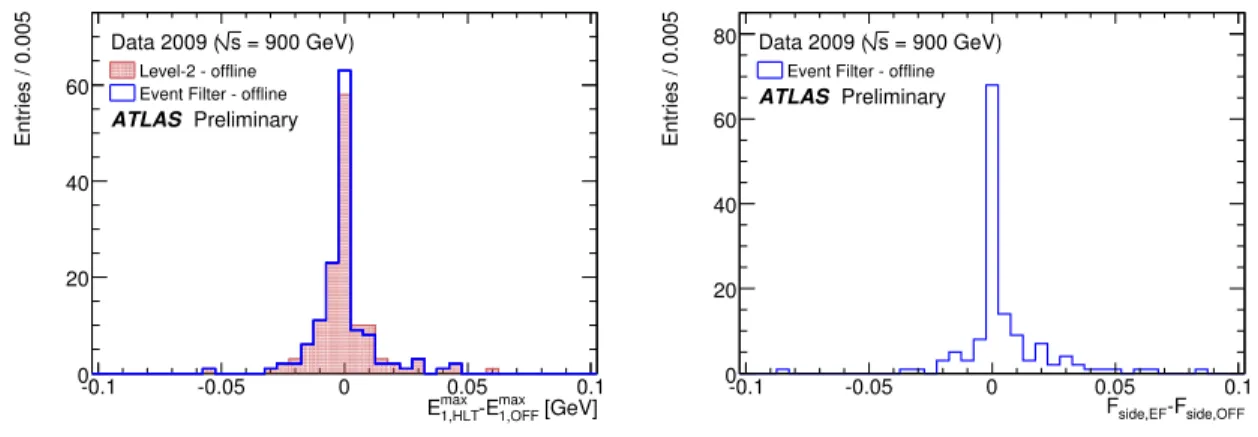
The left plot in Figure 8 shows the difference between the values of the energy of the strip in the first EM
[GeV]
max1,OFF max -E
1,HLT
-0.1 -0.05 0 E0.05 0.1
Entries / 0.005
0 20 40
60 Level-2 - offline Event Filter - offline
= 900 GeV) s
Data 2009 ( ATLAS Preliminary
side,OFF side,EF-F
-0.1 -0.05 0 0.05F 0.1
Entries / 0.005
0 20 40 60 80
Event Filter - offline = 900 GeV) s
Data 2009 ( ATLAS Preliminary
Figure 8: Difference between the energy of the strips with maximal energy in the first EM layer E max (left) found by L2 and EF respectively and the offline. On the right side, the difference between F
1side reconstructed by the EF and the offline is shown.
layer with maximal energy E max
1
. The values found at the trigger and offline level are very similar with small deviations due to the differences in cluster sizes and calibrations. As a last example, the right plot in Figure 8 shows the differences seen for F side between EF and offline showing once more the good agreement between the quantities calculated at trigger level with the corresponding offline ones.
All the figures in this section show a good agreement of the selection variables reconstructed in the trigger and the offline. The differences are understood and can be traced back mainly to different cluster sizes used.
5.2 Track-cluster based selection criteria
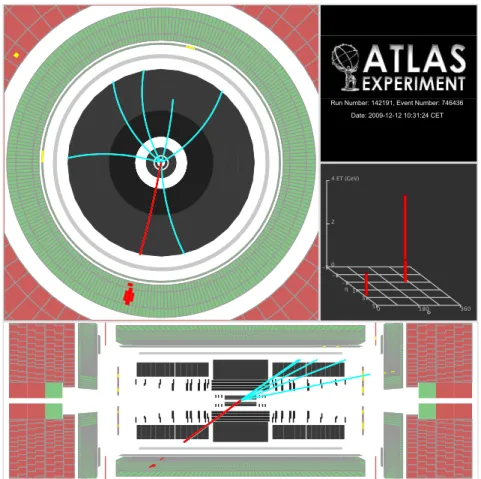
In the following, distributions of the cluster-track matching-based electron identification cuts are com- pared with the shapes coming from simulations and the offline reconstruction. These studies are done for trigger objects matched to an offline electron candidate for which the matched track has been recon- structed in the complete inner tracking detector. For the L2 studies only tracks reconstructed by IdScan, which relies on the information in the Si detectors have been considered here. As noted in section 2 this is one of the three tracking algorithms executed at L2. For compatibility reasons, offline electron candidates used in the following as reference are selected to have tracks using Si information. These objects arise mainly from hadron fakes, and electrons from conversions are largely suppressed as they often fail the minimum requirement on the number of hits in the pixel and Silicon-strip detector. Figure 9 shows an example of one of the electron candidates passing the medium offline selections as seen by L2 algorithms.
At the trigger and offline level, track-cluster matching quantites can be exploited to separate electrons
from jets: the difference in η between the track extrapolated to the first EM layer and the barycentre of
the cell energies in this layer (∆η (cluster-track)), the difference in φ between the track extrapolated to
Figure 9: Example of an electron candidate passing the medium offline selections as seen by the L2 algorithms. The particle deposits its energy in the first and second EM layer and the reconstructed IdScan track points straight at the cluster. In addition on the right side, the transverse energy of the L1 trigger towers are shown.
(cluster-track,L2) η
-0.2 -0.15 -0.1 -0.05 0 0.05∆ 0.1 0.15 0.2
Entries / 0.02
0 20 40 60
= 900 GeV) s Data 2009 (
Non-diffractive minimum bias MC Electrons from conversions ATLASPreliminary
(cluster-track,EF) η
-0.2 -0.15 -0.1 -0.05 0 0.05∆ 0.1 0.15 0.2
Entries / 0.02
0 20 40 60
= 900 GeV) s Data 2009 (
Non-diffractive minimum bias MC Electrons from conversions ATLAS Preliminary
Figure 10: Comparison of the η difference between the track extrapolated into the first EM layer and
the barycentre of the cell energies in this layer calculated at L2 (left) and at EF (right) for data and
simulation. The contribution of electrons from conversions is shown separately.
the calorimeter surface and the barycentre of the cell energies in the second EM layer (∆φ (cluster-track)) and the ratio of the cluster energy to the track momentum (E/p). Initially in the trigger only a cut on the difference in η is applied as the other two quantities are affected by bremsstrahlung effects and will only be used when luminosity goes up and the effects are understood from data. Figure 10 shows the
∆η (cluster-track) distribution in data and Monte Carlo separately for L2 and EF. The two main compo- nents of the electron candidate sample, namely hadrons and electrons from conversions, are also shown.
The distributions are reasonably well modelled. The ∆η(cluster-track) spectrum is broader at L2 com- pared to the EF. This can be explained by the differences in track reconstruction which due to the time constraints at L2 is less sophisticated. Selection cuts to be used in the electron selections are therefore foreseen to be looser at this level. Finally Figure 11 contains the distributions for the quantity E/p. As
E/p (L2)
0 0.5 1 1.5 2 2.5 3 3.5 4 4.5 5
Entries / 0.2
0 10 20
= 900 GeV) s Data 2009 (
Non-diffractive minimum bias MC Electrons from conversions
ATLAS Preliminary
E/p (EF)
0 0.5 1 1.5 2 2.5 3 3.5 4 4.5 5
Entries / 0.2
0 5 10 15 20 25
= 900 GeV) s Data 2009 (
Non-diffractive minimum bias MC Electrons from conversions
ATLASPreliminary
Figure 11: Comparison of the E/p distributions calculated at L2 (left) and at EF (right) for data and simulation. The contribution of electrons from conversions is shown separately.
most of the electron candidates arise from hadrons, E/p peaks at low values. Also here due to the sim- plified tracking algorithm used, the distribution is broader at L2 compared to the EF and the peak in E/p peaks at lower values as no corrections for the momentum due to bremsstrahlung losses are applied.
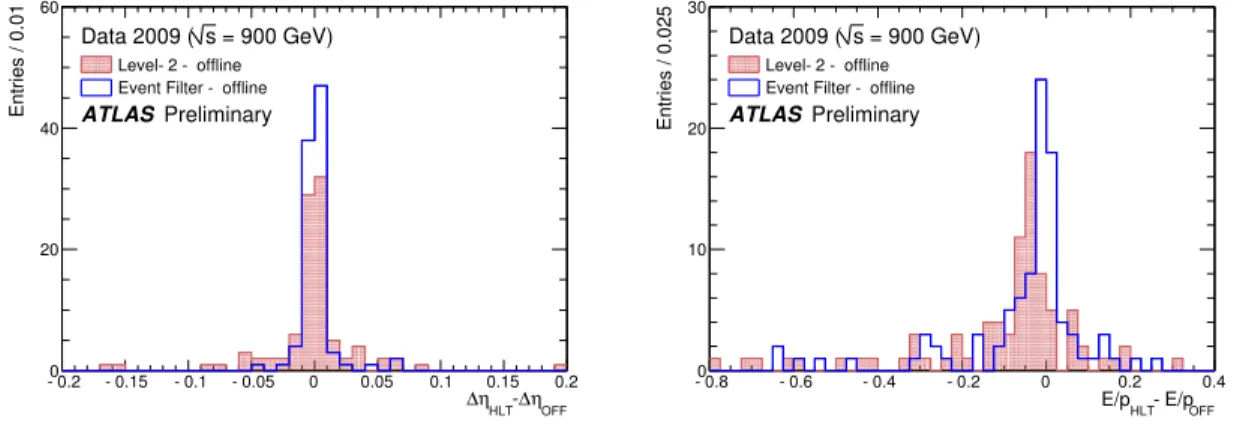
In the following the cluster-track matching quantities found at the trigger level are compared to those found by the offline. Figure 12 displays the differences in ∆η(cluster-track) and E/p between L2 or EF
ηOFF
-∆ ηHLT
-0.2 -0.15 -0.1 -0.05 0 0.05 0.1 ∆0.15 0.2
Entries / 0.01
0 20 40 60
Level-2 - offline Event Filter - offline
= 900 GeV) s
Data 2009 ( ATLAS Preliminary
-E/pOFF
E/pHLT
-0.8 -0.6 -0.4 -0.2 0 0.2 0.4
Entries / 0.025
0 10 20 30
Level-2 - offline Event Filter - offline
= 900 GeV) s
Data 2009 ( ATLAS Preliminary