ATLAS-CONF-2012-048 21May2012
ATLAS NOTE
ATLAS-CONF-2012-048
May 20, 2012
Performance of the ATLAS Electron and Photon Trigger in p-p Collisions at √
s = 7 TeV in 2011
The ATLAS Collaboration
Abstract
Electron and photon triggers are used for signal selection in a wide variety of ATLAS physics analyses. Further dedicated triggers are provided for the collection of J/ψ
→e+e−, W
→ eνand QCD background samples for calibration, efficiency and fake rate measure- ments. In the 2011 proton-proton data-taking period, the increasing luminosity and pile- up conditions at the LHC demanded the use of progressively higher energy thresholds and tighter selections to control the trigger rates. This note summarizes the evolution and per- formance of ATLAS electron and photon triggers used in 2011 data-taking.
c Copyright 2012 CERN for the benefit of the ATLAS Collaboration.
Reproduction of this article or parts of it is allowed as specified in the CC-BY-3.0 license.
1 Introduction
The ATLAS physics programme is reliant on the efficient performance of the trigger system to select events of potential interest from the QCD background processes dominant at the LHC. Events with electrons and photons in the final state are important for many physics studies including Standard Model (SM) precision physics such as top and W cross-section and mass measurements, Higgs boson searches and searches for new physics. This note presents the performance of the ATLAS electron and photon (e/γ) triggers in the 2011 proton-proton (pp) collision run.
The ATLAS trigger system [1, 2] comprises a hardware-based Level-1 (L1) trigger and a software- based High Level Trigger (HLT), subdivided into the Level-2 (L2) and Event Filter (EF). During 2011 the L1 output rate was kept below 60 kHz, L2 below 5 kHz and the EF output rate at around 400 Hz averaged over the LHC fills. The bandwidth allocated to the (e/γ) triggers was approximately 30% of the total EF output rate. The full list of signatures that would trigger the acquisition of an event is defined in the trigger menu which evolved as the instantaneous luminosity delivered by the LHC increased. In March 2011 the peak luminosity rapidly reached 5
×10
32cm
−2s
−1per fill, then steadily increased up to 3.7
×10
33cm
−2s
−1by the end of the pp run in November 2011. The trigger menu and the (e/γ) triggers within it therefore evolved during the year to maintain the trigger output rates within the limit of each trigger level.
The outline of this note is as follows: in Section 2 a short introduction to the online (trigger) and offline identification of electrons and photons is given. In Section 3 the evolution of the e/γ triggers in 2011 is described, in particular the strategy for keeping the trigger rates within their limits as the instantaneous luminosity of the LHC increased. Section 4 presents the performance of the e/γ triggers in terms of their efficiencies to select offline reconstructed electrons or photons, including the single and di- electron triggers and photon triggers for signal events. In section 5 examples for supplementary triggers are presented. Some of these triggers are used to select J/ψ
→e
+e
−and W
→eν candidate events used for offline reconstruction and identification efficiency measurements. Others, the supporting triggers, are designed to collect control samples for background estimates in physics analyses.
2 Electron and photon reconstruction and identification in the trigger and offline
2.1 Level 1 EM trigger
L1 utilizes reduced granularity signals covering ∆η
×∆φ
≈0.1
×0.1 (trigger towers) from the calorimeters to identify the positions of Regions of Interest (RoIs) and compute the transverse energy E
Tof electro- magnetic clusters with a precision of 1 GeV. For each trigger tower, the cells of the EM or hadronic calorimeter are summed, with the exception of the fourth layer of the hadronic endcap and barrel-endcap gap scintillators. EM-clusters are formed by identifying local maxima using a sliding window algorithm based on a 4
×4 group of trigger towers. A trigger is satisfied if the window’s core-region, which is the central 2
×2 trigger towers, contains one pair of neighbouring towers with a combined energy that passes the threshold [3].
2.2 HLT selection
2.2.1 Calorimeter clustering at L2 and EF
At L2, the e/γ calorimeter algorithms build cell clusters within the RoI (∆η
×∆φ = 0.4
×0.4) identified
by the L1. Due to latency constraints, the L2 algorithm uses only the second layer of the EM calorimeter
to find the cell with the largest deposited transverse energy in the RoI close to the L1 position. This cell is
called the pre-seed. The final cluster position is obtained by calculating the energy weighted average cell positions on a 3
×7 grid centred on the pre-seed. In order to accumulate the energy, two cluster sizes are used, following the same policy used by the offline electron reconstruction: 3
×7 (∆η
×∆φ = 0.075
×0.175) cells grid when the cluster is the barrel (
|η|<1.4) and 5
×5 (∆η
×∆φ = 0.125
×0.125) when the cluster is in the end-cap (1.4
< |η| <2.47). Several corrections which are exclusively based on the offline reconstruction algorithms are used at L2 in order to improve the resolution of the cluster position and energy.
At the EF, offline-like algorithms are used for the reconstruction of calorimeter quantities. After retrieving the cell information from a region slightly larger than the RoI, the EF uses the offline sliding window algorithm [4] to build the cluster and apply all the offline based corrections.
2.2.2 Tracking at L2 and EF
Information from the Inner Detector is first made available at L2, where strict timing requirements man- date fast and specialized tracking algorithms. These algorithms first process signals from the inner silicon detectors and later extend any tracks found into the Transition Radiation Tracker (TRT) volume. The on- line track reconstruction is confined to the RoI centred around the L1 seed. The L2 employs a set of algorithms called IDScan for fast pattern recognition and track reconstruction from space points. IDScan first determines the z-position of the primary interaction point along the beam axis and subsequently performs combinatorial tracking only inside groups of space points with the same
ηand
φcoordinates and matching the interaction point [5].
As significantly more time is available at the EF level, the EF track reconstruction can afford to make use of an adapted version of the offline reconstruction software, constrained to the data available in the RoI.
2.3 Offline reconstruction
The offline reconstruction of electrons and photons both rely on cluster-finding in the electromagnetic (EM) calorimeter and track reconstruction in the silicon detectors and Transition Radiation Tracker (TRT) of the inner tracker. The cluster-finding algorithm forms seeds from clusters of towers (each tower covering 0.025
×0.025 in
η×φspace) in the EM calorimeter [6, 7, 8] using a sliding window al- gorithm with a window size of 3
×7 (η
×φ). If a seed matches an inner-detector track withp
T>5 GeV,an electron candidate is formed. A converted photon candidate is created if the associated track is also associated with a secondary vertex. If no match is found to an inner detector track, an unconverted pho- ton candidate is created. The offline algorithms define an electron cluster as 3
×7, for
|η| <1.5 and 5
×5 for 1.5
<|η|<2.5. The offline algorithms also have differing cluster sizes for unconverted and converted photons, using 3
×5 and 3
×7, respectively, for
|η|<1.5 and 5
×5 up to
|η|= 2.5 for both unconverted and converted photons. Since no trigger selects photon or electron candidates in the region
|η| >2.47, they are not described here.
2.4 Identification of electrons and photons online and offline
In the offline reconstruction, a number of identification variables are calculated for the electron and pho- ton candidates corresponding to the properties of the EM showers (longitudinal shower depth, lateral shower width) and the track quality and track-cluster matching (see Table 1). Electron and photon identi- fication is accomplished by a set of
η- andE
T-dependent rectangular cuts on these identification variables.
The variables used are described in detail in references [6, 7]. Identification is aimed at rejecting electron
or photon backgrounds (heavy flavour, neutral and charged mesons in jets) while maintaining high signal
efficiencies.
The standard offline selection defines three operating points for electrons (loose, medium, tight) and two for photons (loose, tight) at increasing levels of background rejection. Table 1 shows the variables used with a brief description for offline photon and electron identification at each identification operating point. Cut values defined at the loose operating point are common for both electrons and photons.
For tighter operating points cuts on additional variables are added. A re-optimised menu was defined for electron selection, referred to as the plus-plus menu, providing three additional operating points (loose
++, medium
++, tight
++) with improved performance over the standard menu for a higher pileup environment. In the plus-plus re-optimized identification, more variables are used and the cut values of each operating point are varied.
The identification of electrons and photons at the HLT is performed using similar variables to those used offline. At L2, electrons and photons are identified by applying requirements on the deposit of energy in the hadronic calorimeter within the RoI, and on the R
ηshower shape variable. A cut on E
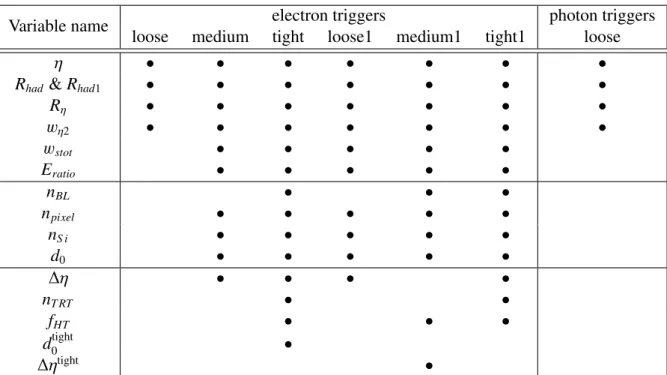
ratiois applied at L2 only for electron identification. At the EF, the identification of electrons and photons is performed using the offline-identification variables. Table 2 shows the variables used to identify electrons and photons at the EF for the different operating points. In the trigger menu, the electron identifications loose1, medium1 and tight1 were implemented to trigger on plus-plus offline electrons.
3 Trigger Menu and rates evolution
As the instantaneous luminosity of the LHC increased, numerous measures were taken to control the overall output rate of the e/γ triggers. The rates of the single electron triggers at a fixed reference luminosity were reduced by raising thresholds and tightening cuts as detailed below. The photon trigger selection was unchanged throughout 2011, however the threshold of the unprescaled single photon trigger was raised from 60 GeV to 80 GeV at a luminosity of 1
×10
33cm
−2s
−1.
Table 3 shows the names and rates of the single electron, di-electron and main photon triggers and how they evolved during the 2011 pp collision run. The convention used for the trigger signature naming indicates that for example 2e12 medium is a two-electron trigger with E
T >12 GeV at EF and medium identification requirements applied on both electrons, while g80 loose is a single photon trigger with a threshold of 80 GeVand loose identification criteria.
L1 optimisation
Until summer 2011, when the LHC instantaneous luminosity was less than 2.3
×10
33cm
−2s
−1, the following eight L1 electromagnetic trigger thresholds were used either singly or com-
bined to seed HLT triggers: EM3, EM5, EM7, EM10, EM12, EM14, EM16, EM30. From September
2011, in preparation for instantaneous luminosities above 3
×10
33cm
−2s
−1, some of these thresholds
were adjusted in order to keep the overall L1 accept rate at or below 60 kHz. Instead of significantly
increasing the trigger thresholds at the expense of reduced acceptance for physics analyses, an optimiza-
tion of thresholds and an hadronic leakage requirement were applied on EM10 and EM16 which were
subsequently re-named EM10VH and EM16VH. Threshold settings were modified following the coarse
L1 calorimeter cluster processor granularity in
η, i.e.∆η = 0.4, by discretely increasing the EM threshold
in the
ηregions where the L1 cluster energy response with respect to the offline reconstructed cluster en-
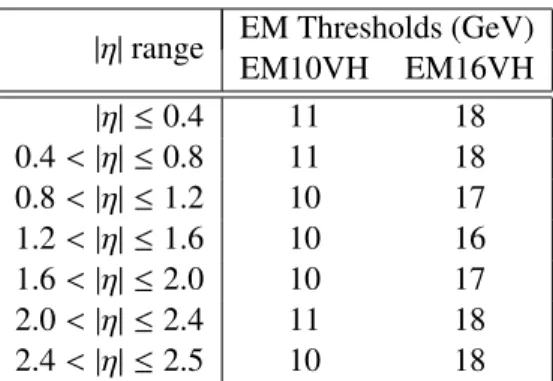
ergy was sufficiently good to cause minimal additional efficiency losses. Table 4 shows the
η-dependentEM thresholds implemented on EM10VH and EM16VH. The hadronic leakage requirement consisted
of a veto on hadronic energy of more than or equal to 1 GeV deposited in the hadronic layers of the
calorimeter, within a region of 0.2
×0.2 in
η×φbehind the EM cluster. The letters
vhwere added to the
HLT signature names for those triggers seeded by L1 items with
η-dependent thresholds and a hadronicleakage requirement, e.g. e22vh medium1.
Type Description Name Loose electron and photon cuts
Acceptance of the detector |η|<2.47 for electrons,|η|<2.37 for photons (1.37<|η|<1.52 excluded) -
Hadronic leakage
Ratio ofETin the 1st sampling of the hadronic calorimeter toETof the
Rhad1
EM cluster (used over the range|η|<0.8 and|η|>1.37) Ratio ofETin the hadronic calorimeter toETof the EM cluster
Rhad
(used over the range|η|>0.8 and|η|<1.37)
Middle layer of the Ratio inηof cell energies in 3×7 versus 7×7 cells. Rη
EM calorimeter Lateral width of the shower wη2
Medium electron cuts (in addition to theloosecuts) Strip layer of the EM
calorimeter
Total lateral shower width (20 strips) wstot
Ratio of the energy difference between the largest and second largest
Eratio
energy deposits over the sum of these energies Track quality
Number of hits in the pixel detector (at least one) npixel
Number of hits in the pixels and SCT (at least seven) nS i
Transverse impact parameter (<5 mm) d0
Track matching ∆ηbetween the cluster and the track in the strip layer of the EM calorimeter ∆η Tight electron cuts (in addition to the medium electron cuts)
B-layer Number of hits in the B-layer (at least one) nBL
Track matching ∆φbetween the cluster and the track in the middle layer of the EM calorimeter ∆φ2
Ratio of the cluster energy to the track momentum E/p
TRT
Total number of hits in the TRT nT RT
(used over the acceptance of the TRT,|η|<2.0)
Ratio of the number of high-threshold hits to the total number of TRT hits fHT
(used over the acceptance of the TRT,|η|<2.0)
Tight photon cuts (in addition to theloosecuts, applied with stricter thresholds) Middle layer of the Ratio inφof cell energies
Rφ EM calorimeter in 3×3 and 3×7 cells
Strip layer of the EM calorimeter
Shower width for three strips around maximum strip ws3
Total lateral shower width wstot
Fraction of energy outside core of three central strips but within seven strips Fside
Difference between the energy of the strip with the second largest
∆E energy deposit and the energy of the strip with the smallest energy deposit between the two leading strips
Ratio of the energy difference associated with the largest and second largest
Eratio
energy deposits over the sum of these energies
Table 1: Definition of variables used for electron and photon offline and trigger identification [6].
L1-HLT threshold separation
The differences between the HLT and L1 thresholds were reduced for some triggers in order to keep the L1 rates within the allowed bandwidth without raising the threshold at the HLT and hence the offline analysis. For example, the seed of the 2e12 medium trigger was changed from 2EM7 to 2EM10 when the luminiosity reached 1.5
×10
33cm
−2s
−1. To reflect this change in the L1 seed the letter ’T ’ (for tighter L1 requirement) was added to the HLT trigger name, i.e. 2e12T medium.
HLT optimisation
At the HLT the energy thresholds were raised and the identification cuts tightened
to reduce the L2 rate and maintain the EF output rate at about 400 Hz on average per LHC fill. The
EF threshold for the single electron trigger was raised from 20 GeV to 22 GeV in August 2011 (when
the luminosity exceeded 2
×10
33cm
−2s
−1). At L2, the medium and tight electron identification criteria
were brought closer to the EF level selections and for luminosities
≥3
×10
33cm
−2s
−1(September),
the re-optimised electron identification criteria were deployed, moving from the medium to medium1
selections, in order to avoid raising the threshold further. The medium1 requirements include tighter cuts
Variable name electron triggers photon triggers loose medium tight loose1 medium1 tight1 loose
η • • • • • • •
R
had& R
had1• • • • • • •
R
η• • • • • • •
w
η2• • • • • • •
w
stot• • • • •
E
ratio• • • • •
n
BL• • •
n
pixel• • • • •
n
S i• • • • •
d
0• • • • •
∆η • • • •
n
T RT• •
f
HT• • •
d
0tight•
∆η
tight•
Table 2: Variables used for different groups of triggers. The first column gives the names of the variables, as defined in Table 1, the other columns show which variables are used at each operating point of the EF electron and photon identification.
Trigger L1 Lumi Range L1 Rate L2 Rate EF Rate
Signature Seed of Validity (cm−2s−1) (Hz) (Hz) (Hz) Single electron triggers
e20 medium EM14 up to 2×1033 7300 273 50
e22 medium EM16 2−2.3×1033 5700 273 45
e22vh medium1 EM16VH from 2.3×1033 3600 150 22
Di-electron triggers
2e10 medium 2EM5 up to 0.7×1033 13600 83 1.6
2e12 medium 2EM7 0.7−1.5×1033 5900 36 0.9
2e12T medium 2EM10 1.5−2.3×1033 2100 36 0.9
2e12Tvh medium 2EM10VH from 2.3×1033 800 36 0.9
Single and di-photon triggers
g60 loose EM30 up to 0.7×1033 760 17 8
g80 loose EM30 from 0.7×1033 760 9 3.4
2g20 loose 2EM14 (2EM12) all year 2011 780 (1450) 5 2.5
Table 3: Lowest threshold, unprescaled, electron and photon triggers, with their L1 seeds and their corresponding EF rates in 2011 in a given ’Luminosity Range of Validity’ (i.e. luminosity range when they were used as main triggers for physics analysis), at reference luminosity of L=1.0
×10
33cm
−2s
−1.
on shower shapes and additional requirements on the track (see Section 2) and was defined to trigger on
electrons satisfying the offline medium
++identification.
|η|
range EM Thresholds (GeV)
EM10VH EM16VH
|η| ≤
0.4 11 18 0.4
<|η| ≤0.8 11 18 0.8
<|η| ≤1.2 10 17 1.2
<|η| ≤1.6 10 16 1.6
<|η| ≤2.0 10 17 2.0
<|η| ≤2.4 11 18 2.4
<|η| ≤2.5 10 18
Table 4:
η-dependent EM thresholds implemented on L1 EM10VH and EM16VH triggers.1032
×
-1]
-2s Instantaneous luminosity [cm
0 5 10 15 20 25 30 35 40
Rate [Hz]
0 20 40 60 80 100
e20_medium e22_medium e22vh_medium1 ATLASPreliminary
(a)
1032
×
-1]
-2s Instantaneous luminosity [cm
0 5 10 15 20 25 30 35 40
Rate [Hz]
0 0.5 1 1.5 2 2.5
3 2e10_medium 2e12_medium 2e12T_medium 2e12Tvh_medium
ATLASPreliminary
(b)
1032
×
-1]
-2s Instantaneous luminosity [cm
0 5 10 15 20 25 30 35 40
Rate [Hz]
0 2 4 6 8 10 12
g60_loose g80_loose 2g20_loose
ATLASPreliminary
(c)
Figure 1: EF trigger rates as function of instantaneous luminosity for single electron (a) and di-electron (b) and photon (c) triggers. Vertical dashed lines mark instantaneous luminosity ranges of validity, as defined in Table 3.
The EF rates of the single electron, di-electron and photon triggers are shown in Figures 1(a), 1(b)
and 1(c), respectively, as a function of instantaneous luminosity. The rates of all triggers varied linearly
with luminosity, and Fig 1(a) illustrates how the strategy described above was used to keep the single
electron trigger rate (the dominant source of the total e/γ trigger rate) below 70 Hz during 2011. Vertical
dashed lines mark the instantaneous luminosity ranges of validity of e/γ main triggers as shown in Table
3.
[GeV]
pT
20 30 40 50 60 70
Efficiency
0.7 0.75 0.8 0.85 0.9 0.95 1 1.05
L1 EM16 L1 EM16VH
ATLASPreliminary
L dt = 2.4 fb-1
∫
(a)
η
-2 -1 0 1 2
Efficiency
0.98 0.985 0.99 0.995 1 1.005
L1 EM16 L1 EM16VH
ATLASPreliminary
L dt = 2.4 fb-1
∫
(b)
Number of primary vertices
2 4 6 8 10 12 14 16 18 20
Efficiency
0.98 0.985 0.99 0.995 1 1.005
L1 EM16 L1 EM16VH
ATLASPreliminary
L dt = 2.4 fb
∫
-1(c)
Figure 2: Efficiencies of L1 EM16 and EM16VH triggers as a function of offline electron p
T(a),
η(b) and the number of primary vertices (c) using the Tag
&Probe method on Z
→ee events. The offline electron is required to satisfy medium
++identification. (b) and (c) show the efficiency for electrons with
p
T>25 GeV.
4 Electron and Photon Trigger Performance
4.1 L1 EM triggers
The performance of L1 EM triggers was evaluated with a data-driven Tag
&Probe method on Z
→ee events [6]. In this method reconstructed electrons passing the lowest unprescaled single electron trigger are identified as tags. A second reconstructed electron is identified as a probe if the invariant mass computed from the Tag
&Probe pair is close to the Z boson mass (80 GeV< m
ee <100 GeV). The efficiencies of L1 EM triggers can be estimated for probe electrons that are associated to a L1 EM RoI and pass a given transverse energy threshold. The efficiencies are calculated with respect to offline electrons passing the medium
++identification selection. Electrons reconstructed in the transition region between the barrel and the endcap (1.37
< η <1.52) are neglected.
Figure 2 shows the efficiencies of the L1 EM16 and EM16VH triggers as a function of the elec-
tron p
Tand
ηand of the number of primary vertices in the event. The implementation of the
η-dependentthresholds on EM16VH resulted in a shift of the efficiency curve towards higher p
Tvalues in comparison
with EM16 as shown in Figure 2 (a). The hadronic core veto has a negligible effect on the L1 efficiency
of offline-identified electrons up to p
T≈200 GeV since an hadronic leakage cut is applied offline relative
to the electron p
Tvalue.
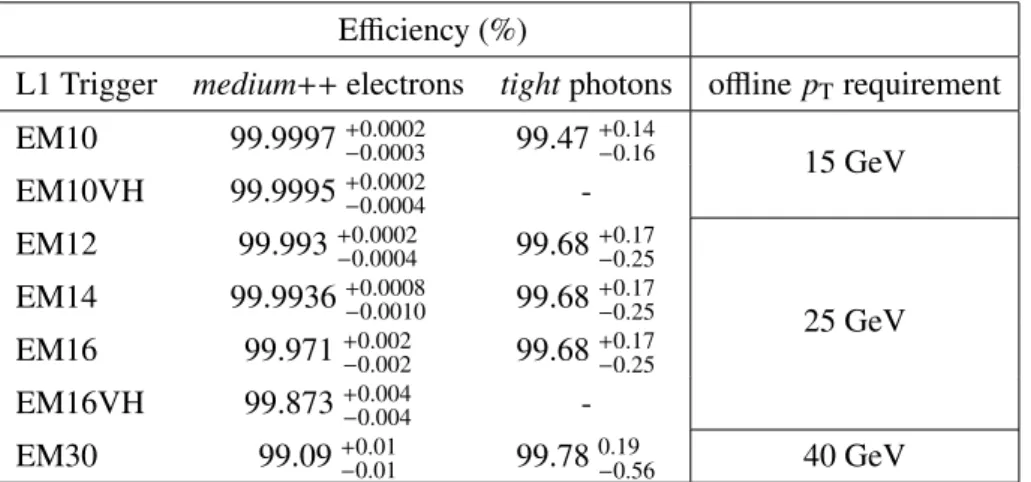
The efficiencies of the EM triggers for photons were computed using photons passing the offline tight identification in events triggered by Minimum Bias triggers. Table 5 presents a set of efficiencies for the L1 EM triggers, for offline tight photons and for offline medium
++electrons from the Z
→ee sample using the Tag
&Probe method, for offline p
Tgreater than 15, 25 or 40 GeV depending on the L1 trigger threshold. The table shows that the plateau efficiencies of both electron and photon triggers are well above 99 %.
Efficiency (%)
L1 Trigger medium
++electrons tight photons offline p
Trequirement EM10 99.9997
+0.0002−0.000399.47
+0.14−0.1615 GeV EM10VH 99.9995
+0.0002−0.0004-
EM12 99.993
+0.0002−0.000499.68
+0.17−0.2525 GeV EM14 99.9936
+0.0008−0.001099.68
+0.17−0.25EM16 99.971
+0.002−0.00299.68
+0.17−0.25EM16VH 99.873
+0.004−0.004-
EM30 99.09
+0.01−0.01
99.78
0.19−0.56
40 GeV
Table 5: Efficiencies of L1 EM triggers measured on data for offline medium
++electrons and offline tight photons. The fourth column shows the offline p
Trequirement. Uncertainties shown are statistical only.
4.2 HLT tracking
At the EF the track reconstruction is performed with an adapted version of the offline reconstruction software using data constrained to the RoI. At the L2 the track reconstruction is performed by special- ized tracking algorithms optimized for minimal execution time. The performance of the HLT tracking algorithms was measured on data using events selected by HLT tracking monitoring triggers. In these triggers, electron candidates are selected only with calorimeter information to avoid any bias from the tracking identification. Figure 3 shows the efficiency of the L2 and EF tracking as a function of the p
Tand
ηof the offline electron satisfying the tight identification. The EF tracking, which uses algorithms closer to the ones used offline, shows very high efficiency, close to 100% from about 4 GeV offline electron p
Tand very small dependences on the electron
η, number of primary vertices and tracks. TheL2 tracking, which uses less sophisticated algorithms due to timing constraints, shows a slower turn-on curve and dependences of the order of 2% on the electron
η, number of primary vertices and tracks.Since the HLT tracking monitoring triggers do not select pure electron samples, these results must be interpreted as tracking efficiencies relative to a reference offline track which is considered by the offline reconstruction as an electron candidate within the region of interest. Despite the constant increase in the number of pile-up interactions per bunch crossing over the course of 2011, the HLT tracking performance was found to remain stable and robust throughout the data-taking period [9].
4.3 Single electron triggers
The efficiencies of the HLT electron selection were measured with respect to offline electrons on Z
→ee
events using a Tag
&Probe method. For measuring the HLT efficiencies, the tag is defined as the offline
of offline track [GeV]
pT
0 20 40 60 80 100
Track Efficiency in Electron RoIs
0.86 0.88 0.9 0.92 0.94 0.96 0.98 1
Event Filter
Level 2 ATLASPreliminary
= 7 TeV s Data 2011,
L dt= 2.4 fb-1
∫
(a)
of offline track η
-3 -2 -1 0 1 2 3
Track Efficiency in Electron RoIs
0.86 0.88 0.9 0.92 0.94 0.96 0.98 1
Event Filter
Level 2 ATLASPreliminary
= 7 TeV s Data 2011,
L dt= 2.4 fb-1
∫
(b)
Number of primary vertices
0 2 4 6 8 10 12 14 16 18 20 22
Track Efficiency in Electron RoIs
0.86 0.88 0.9 0.92 0.94 0.96 0.98 1
Event Filter
Level 2 ATLASPreliminary
= 7 TeV s Data 2011,
L dt= 2.4 fb-1
∫
(c)
Number of offline tracks
0 100 200 300 400 500
Track Efficiency in Electron RoIs
0.86 0.88 0.9 0.92 0.94 0.96 0.98 1
Event Filter
Level 2 ATLASPreliminary
= 7 TeV s Data 2011,
L dt= 2.4 fb-1
∫
(d)
Figure 3: The efficiency of the L2 and EF tracking as a function of the p
T(a) and
η(b) of offline tight electron track selected by a dedicated tracking monitoring trigger that applies calorimeter selection only.
The efficiency is also shown as a function of the number of offline primary vertices (c) and number of offline tracks (d).
electron matching
1an online electron passing the lowest unprescaled single electron trigger. The tag electron is also required to have p
T >25 GeV, to satisfy the tight
++offline electron identification and to lie within
|η| <2.47, excluding the transition region between the barrel and the endcaps. A second electron with opposite charge to the tag is considered as a probe if the invariant mass of the electron pair lies in the range 80 GeV< m
ee <100 GeV. The trigger efficiency is the fraction of probes matching an online electron passing the trigger selection at the EF.
1An offline electron is considered to match an online electron if the distance between them in the (η, φ) space∆R = p(∆η2+ ∆φ2) satisfies∆R<0.15
tr ig g er o
fflin e
pT[G eV ] se le ctio n (2 1 , 2 3 ) (2 3 , 2 5 ) (2 5 , 3 0 ) (3 0 , 3 5 ) (3 5 , 4 0 ) (4 0 ,
∞) e2 0 me d iu m
loose++8 1
.7 2
±0
.9 3 8 5
.9 6
±0
.6 4 8 9
.7 7
±0
.5 3 9 3
.0 3
±0
.3 1 9 4
.4 4
±0
.1 2 9 6
.2 3
±0
.0 4
medium++9 2
.1 5
±0
.5 2 9 4
.7 6
±0
.2 5 9 6
.1 8
±0
.1 9 9 6
.9 3
±0
.1 9 9 7
.1 9
±0
.1 5 9 7
.6 1
±0
.0 8
tight++9 3
.5 2
±0
.7 0 9 5
.4 5
±0
.2 5 9 6
.8 2
±0
.3 8 9 7
.4 8
±0
.2 8 9 7
.6 9
±0
.1 0 9 8
.0 2
±0
.2 2 e2 2 me d iu m
loose++- 8 5
.4 2
±1
.5 9 9 0
.6 9
±0
.9 6 9 3
.8 1
±0
.5 9 9 5
.0 6
±0
.2 2 9 6
.5 5
±0
.0 9
medium++- 9 0
.6 1
±1
.1 8 9 4
.1 3
±0
.6 8 9 5
.9 2
±0
.4 4 9 6
.6 6
±0
.1 6 9 7
.3 2
±0
.0 7
tight++- 9 1
.3 7
±1
.0 8 9 4
.9 0
±0
.5 4 9 6
.5 8
±0
.5 0 9 7
.1 9
±0
.1 6 9 7
.7 5
±0
.0 8 e2 2 v h me d iu m1
loose++- 7 2
.9 3
±1
.6 0 8 0
.6 1
±1
.2 5 8 6
.0 7
±0
.6 4 8 8
.7 5
±0
.2 4 9 2
.0 2
±0
.0 9
medium++- 8 6
.5 0
±1
.0 5 9 1
.5 4
±0
.7 2 9 3
.7 1
±0
.4 0 9 4
.5 1
±0
.1 2 9 5
.6 1
±0
.0 4
tight++- 8 8
.0 9
±1
.3 8 9 2
.9 2
±0
.8 3 9 4
.8 6
±0
.6 2 9 5
.6 3
±0
.3 3 9 6
.4 9
±0
.1 0 T ab le 6 : T rig g er e
fficie n cie s (in p er ce n t) in clu d in g sta tis tic al an d sy ste ma tic u n ce rta in tie s as fu n ctio n s o f
loose++,
medium++an d
tight++o
fflin e ele ctr o n s, in d i
ffer en t ele ctr o n
pTra n g es , fo r th e e2 0 me d iu m, e2 2 me d iu m an d e2 2 v h me d iu m1 tr ig g er s. S ta tis tic al an d sy ste ma tic u n ce rta in tie s ar e su mme d in q u ad ra tu re . tr ig g er o
fflin e
pT[G eV ] se le ctio n (2 1 , 2 3 ) (2 3 , 2 5 ) (2 5 , 3 0 ) (3 0 , 3 5 ) (3 5 , 4 0 ) (4 0 ,
∞) e2 0 me d iu m
loose++0
.9 5 7
±0
.0 3 6 0
.9 7 2
±0
.0 2 2 0
.9 7 7
±0
.0 1 9 0
.9 8 3
±0
.0 1 2 0
.9 8 7
±0
.0 0 7 0
.9 9 3
±0
.0 0 2
medium++0
.9 8 3
±0
.0 2 5 0
.9 9 2
±0
.0 1 8 0
.9 8 9
±0
.0 1 5 0
.9 9 0
±0
.0 1 0 0
.9 9 1
±0
.0 0 8 0
.9 9 4
±0
.0 0 4
tight++0
.9 8 5
±0
.0 0 6 0
.9 9 1
±0
.0 0 3 0
.9 8 8
±0
.0 0 2 0
.9 9 2
±0
.0 0 1 0
.9 9 2
±0
.0 0 2 0
.9 9 5
±0
.0 0 1 e2 2 me d iu m
loose++- 0
.9 7 2
±0
.0 2 2 0
.9 7 7
±0
.0 1 9 0
.9 8 3
±0
.0 1 2 0
.9 8 7
±0
.0 0 7 0
.9 9 3
±0
.0 0 2
medium++- 0
.9 8 4
±0
.0 2 2 0
.9 8 4
±0
.0 1 1 0
.9 9 0
±0
.0 0 8 0
.9 9 8
±0
.0 0 3 1
.0 0 2
±0
.0 0 2
tight++- 0
.9 8 1
±0
.0 1 9 0
.9 8 5
±0
.0 0 8 0
.9 9 2
±0
.0 0 7 0
.9 9 8
±0
.0 0 2 1
.0 0 2
±0
.0 0 1 e2 2 v h me d iu m1
loose++- 0
.9 2 3
±0
.0 4 0 0
.9 4 2
±0
.0 3 2 0
.9 5 6
±0
.0 2 1 0
.9 6 7
±0
.0 1 2 0
.9 8 1
±0
.0 0 4
medium++- 0
.9 5 8
±0
.0 2 2 0
.9 6 3
±0
.0 1 3 0
.9 6 9
±0
.0 0 8 0
.9 7 5
±0
.0 0 3 0
.9 8 2
±0
.0 0 1
tight++- 0
.9 5 8
±0
.0 0 7 0
.9 6 6
±0
.0 0 2 0
.9 7 2
±0
.0 0 2 0
.9 7 8
±0
.0 0 5 0
.9 8 5
±0
.0 0 3 T ab le 7 : S ca le fa cto rs (d ata
/M C e
fficie n cy ra tio s) in clu d in g sta tis tic al an d sy ste ma tic u n ce rta in tie s as fu n ctio n s o f
loose++,
medium++an d
tight++o
fflin e ele ctr o n s, in d i
ffer en t ele ctr o n
pTra n g es , fo r th e e2 0 me d iu m, e2 2 me d iu m an d e2 2 v h me d iu m1 tr ig g er s. S ta tis tic al an d sy ste ma tic u n ce rta in tie s ar e su mme d in q u ad ra tu re .
To improve the purity of the sample, probe electrons are required to be isolated from jets: electrons are rejected if a jet with p
T>10 GeV is found in the region of ∆R =
p(∆η)
2+ (∆φ)
2 <0.4 around their directions. The background contamination in the invariant mass region between 80 and 100 GeV is of the order of 1%, therefore no background subtraction is applied.
-2 -1.5 -1 -0.5 0 0.5 1 1.5 2 η
Efficiency
0.7 0.8 0.9 1
ATLASPreliminary
e20_medium e22_medium e22vh_medium1
(a)
[GeV]
pT
30 40 50 60 70 80 90102
Efficiency
0.4 0.6 0.8 1
e20_medium e22_medium e22vh_medium1 ATLASPreliminary
(b)
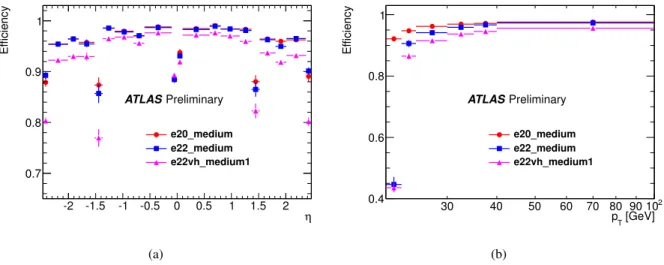
Figure 4: Efficiencies as functions of the offline medium
++electron p
Tand
ηfor the e20 medium, e22 medium and e22vh medium1 triggers. The vertical bars represent statistical and total systematic uncertainties. Integrated luminosities 1.8 f b
−10.6 f b
−1and 2.5 f b
−1were recorded by ATLAS when lowest unprescled triggers were e20 medium, e22 medium and e22vh medium1 respectively.
The sources of systematic uncertainty considered in the calculation of the trigger efficiencies are:
Tag selection:
The offline identification for the tag is changed from medium to tight if triggering with e20 medium or e22 medium, and from medium
++to tight
++if triggering with e22vh medium1.
Invariant mass window:
The invariant mass cut window is changed from 75
<m
ee <105 GeV to 85
<m
ee<95 GeV.
The differences with respect to the central values for each variation are added in quadrature to determine the overall systematic uncertainty.
Figure 4 shows the efficiencies of the e20 medium, e22 medium and e22vh medium1 triggers mea- sured in data relative to medium
++offline electrons. The efficiency of e20 medium is computed relative to offline electrons with p
T >21 GeV and the efficiencies e22 medium and e22vh medium1 are com- puted relative to offline electrons with p
T >23 GeV. Between 25 and 35 GeV the efficiency is slowly increasing before finally reaching the plateau value at about 35 GeV. Inefficiencies of these triggers mainly arise from the resolution of reconstruction and identification variables at the HLT with respect to offline. Due to timing constraints the HLT reconstruction algorithms (especially the L2 tracking) are less refined than the corresponding offline algorithms. In addition, the trigger-offline resolution for the electron identification variables result in some trigger inefficiencies which affect in particular the e22vh medium1 trigger. This trigger has a tighter selection than the medium electron triggers and ap- plies cuts on additional variables as described in Section 2.
Efficiencies measured on data are compared to efficiencies obtained from MC simulations of Z
→ee
events, using
Pythiav6 [10] event generator with GEANT4 [11] simulation of the ATLAS detector,
and data/MC ratios (scale f actors) are also derived. These scale factors are used in physics analyses to
correct the MC to better describe the data efficiency. The efficiencies and scale factors are summarised
in Tables 6 and 7, respectively. The efficiencies of the electron triggers obtained from simulated Z
→ee
events are in good agreement with the efficiencies measured on data. The scale factors for the lower p
Trange show that the simulation overestimates the efficiency in this region.
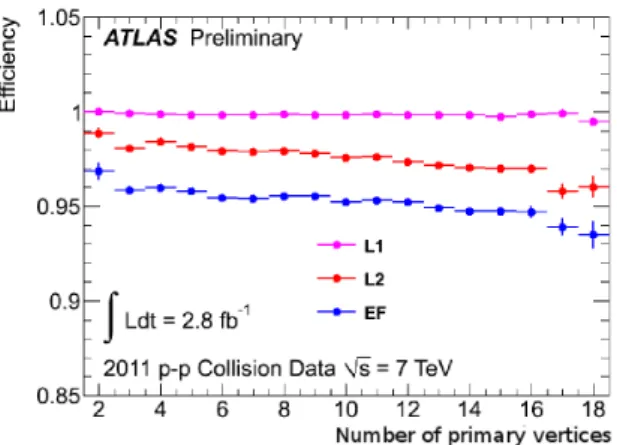
Figure 5 shows the efficiencies of e22vh medium1 as a function of the number of primary vertices reconstructed in the event. The efficiencies are computed relative to offline electrons satisfying the medium
++selection. At 18 interactions, the trigger efficiency of e22vh medium1, relative to the of- fline medium
++identification, drops about 3% in comparison with events with no pile-up and the drop is mostly driven by the L2 selection. The pileup dependence of the trigger efficiency observed in data is in agreement with that computed on simulated Monte Carlo events at the 0.3% level.
Figure 5: Efficiencies of the e22vh medium1 trigger at L1, L2 and EF as a function of the number of primary vertices reconstructed in the event, computed with the Z
→ee Tag
&Probe method on data. The trigger efficiency is relative to the offline medium
++electron identification.
4.4 Di-electron triggers
Di-electron triggers were widely used in ATLAS 2011 physics analyses, often with a logical OR with the single electron trigger, for signatures with at least two electrons in the final state, e.g. SM di-boson measurements, H
→four-leptons searches and di-lepton SUSY searches. The unprescaled di-electron triggers used for the largest part of 2011 applied 12 GeV E
Tthresholds at the HLT on both electrons and medium identification criteria. As discussed in Section 3, the L1 seed of the di-electron triggers evolved during 2011 and this is reflected in the evolution of HLT trigger name used, i.e. 2e12 medium, 2e12T medium and 2e12Tvh medium, depending on the instantaneous luminosity delivered by the LHC (see Table 3).
The efficiency
ǫtrig|e(~ x) of a single electron trigger ‘trig’ relative to the offline electron identification
‘e’ is a function of offline parameters
~x (e.g. p
Tand
η). The efficiencyǫ2trig|2e(~ x
1, ~x
2) of a di-electron trigger selection ‘2trig’ relative to events with two identified electrons ‘2e’ can be computed as the product of each single trigger efficiency
ǫtrig|e(~ x):
ǫ2trig|2e
(~ x
1, ~x
2) =
ǫtrig|e1(~ x
1)
·ǫtrig|e2(~ x
2). (1)
The efficiencies of the single electron triggers are obtained using a Tag
&Probe method on Z
→ee events similarly to section 4.3, in which medium
++offline electrons are considered as tags if they
match an online electron passing the lowest unprescaled single electron trigger selection (e20 medium,
e22 medium or e22vh medium1 depending on the instantaneous luminosity delivered by the LHC). In
contrast to section 4.3, however, a background subtraction of the same-sign background is performed
due to a non-negligible effect on the efficiencies for low p
Tbins. The efficiencies and the data/MC scale factors were computed for probe electrons satisfying either medium
++or tight
++offline identification.
Figure 6 shows the trigger efficiencies of e12 medium, e12T medium and e12Tvh medium as func- tions of the offline electron p
Tand
ηrelative to offline medium
++electrons. Table 8 summarizes the trig- ger efficiencies relative to offline medium
++and tight
++identification and Table 9 summarizes the scale factors. It can be seen that the progressively tighter requirement on the L1 seed, especially its increased threshold, resulted in a slower turn-on from e12 medium to e12T medium and to e12Tvh medium. For e12 medium the efficiency plateau is reached at about 20 GeV, whereas for the other two triggers at about 25 GeV. All three triggers follow a similar efficiency profile as function of
η. At the efficiency plateauthe three triggers show very high efficiencies, 97 - 99%.
In order to estimate the systematic uncertainties, the invariant mass cut in the Tag
&Probe method was changed from 65 GeV
<m
ee <110 GeV to 75 GeV
<m
ee <100 GeV. The identification criteria of the tag electron was changed from medium
++to tight
++offline selection. Furthermore, the matching between the offline and EF electrons was changed from ∆R
<0.15 to ∆R
<0.1 or ∆R
<0.2. The impact of the changing number of pile-up events during the year was studied by separating the data sample into high (> 10 primary vertices) and low pile-up (< 10 primary vertices) and by measuring the efficiencies in the two samples separately. However, the systematic uncertainties due to pile-up events were not included in the results presented here because they have been found to be negligible.
[GeV]
pT
10 15 20 25 30 35 40 45 50 55 60
Efficiency
0.65 0.7 0.75 0.8 0.85 0.9 0.95 1 1.05
e12_medium e12T_medium e12Tvh_medium ATLASPreliminary
η -2.5 -2 -1.5 -1 -0.5 0 0.5 1 1.5 2 2.5
Efficiency
0.9 0.92 0.94 0.96 0.98 1 1.02
1.04 e12_medium
e12T_medium e12Tvh_medium ATLASPreliminary
![Table 1: Definition of variables used for electron and photon offline and trigger identification [6].](https://thumb-eu.123doks.com/thumbv2/1library_info/4026667.1542150/5.892.103.811.106.742/table-definition-variables-electron-photon-offline-trigger-identification.webp)