ATLAS-CONF-2018-043 13September2018
ATLAS CONF Note
ATLAS-CONF-2018-043
11th September 2018
Combination of searches for Higgs boson pairs in p p collisions at 13 TeV with the ATLAS experiment
The ATLAS Collaboration
This note presents a combination of searches for Higgs boson pairs using up to 36.1 fb
−1of proton–proton collision data at a centre-of-mass energy
√s =
13 TeV recorded with the ATLAS detector at the LHC. The combination is performed using three analyses searching for the
HH→bbb¯
b¯ ,
HH→bbτ¯
+τ−and
HH→bbγγ¯ decay channels. Results are presented for both non-resonant and resonant Higgs boson pair production modes. The combined observed (expected) limit on the non-resonant Higgs boson pair cross-section is 0.22 pb (0.35 pb) at 95% confidence level, which corresponds to 6.7 (10.4) times the predicted Standard Model cross-section. The ratio of the Higgs boson self-coupling to its Standard Model expectation
κλ=λH H H/λSMH H H
is observed (expected) to be constrained at 95% confidence level to
−
5
.0
< κλ <12
.1
(−5
.8
< κλ <12
.0
). Exclusion limits are also set on resonant Higgs boson pair production, probing a model with an extended Higgs sector based on two doublets, as well as a Randall–Sundrum bulk graviton model.
© 2018 CERN for the benefit of the ATLAS Collaboration.
Reproduction of this article or parts of it is allowed as specified in the CC-BY-4.0 license.
1 Introduction
The discovery of the Higgs boson (
H) at the Large Hadron Collider (LHC) [1] in 2012 [2, 3], with a measured mass
mH '125 GeV [4] and properties in agreement with Standard Model (SM) predictions within the uncertainties of the measurements [5], has experimentally confirmed the Brout-Englert-Higgs (BEH) mechanism of electroweak symmetry breaking and mass generation [6, 7]. The BEH mechanism not only predicts the existence of a massive scalar particle, but also requires the scalar field to couple to itself. Therefore, observing the production of Higgs boson pairs and measuring the Higgs boson self-coupling
λH H Hwould be another crucial validation of the BEH mechanism, and any deviation from the SM predictions would open a window on new physics.
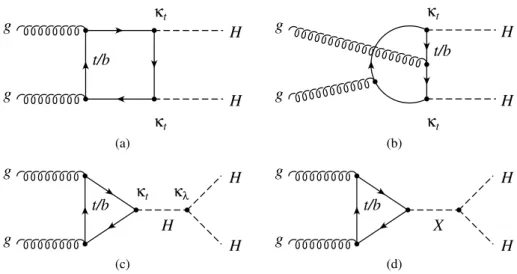
In the SM, gluon–gluon fusion (ggF) accounts for more than 90% of the Higgs boson pair production cross-section, and only this production mode is considered here. It can proceed via loops of heavy- quarks as illustrated in Figure 1. Two of these loop diagrams, namely those depicted in Figure 1(a) and Figure 1(b), are proportional to the square of the heavy-quark Yukawa coupling, while the third one, illustrated in Figure 1(c), is proportional to the product of the heavy-quark Yukawa coupling and the Higgs boson self-coupling. The interference between these three diagrams is destructive and yields an overall cross-section of 33.4 fb at
√s =
13 TeV, calculated at next-to-leading-order (NLO) in QCD, fully accounting for finite top-quark mass effects [8], and corrected at next-to-next-to-leading-order (NNLO) in QCD matched with next-to-next-to-leading logarithmic (NNLL) resummation in the heavy top-quark limit [9]. Hence, the production of a Higgs boson pair in a single proton–proton (
pp) interaction is not expected to be observed with the current dataset, unless its cross-section is enhanced in Beyond-the- Standard-Model (BSM) scenarios. Such enhancements can come from anomalous couplings, e.g. arising from new contact interactions between two top-quarks and two Higgs bosons (which are not considered in this report), or deviations from the SM couplings of the Higgs boson with other particles or itself. In this note, the top-quark Yukawa coupling is set to its SM value, while the effective Higgs boson self-coupling is parameterised by a scale factor
κλ= λH H H/λSMH H H. The theoretical and phenomenological implications of such couplings for complete models are discussed in Refs. [10] and [11].
Several BSM theories also predict the existence of heavy particles decaying into a pair of Higgs bosons.
Figure 1(d) shows the production of such a resonance in the ggF mode. Models with two Higgs doublets (2HDMs) [12, 13] result in the prediction of a second CP-even, heavier, Higgs boson that can decay into two SM-like lighter Higgs bosons. Alternatively, an
HHpair can be produced resonantly through the decay of a spin-2 graviton, as predicted in the Randall–Sundrum model of warped dimensions [14].
This note presents a statistical combination of results from searches for both non-resonant and resonant Higgs boson pair production in
ppcollisions at
√s=
13 TeV. The dataset was collected with the ATLAS experiment [15–17], which is a multi-purpose particle detector with a forward-backward symmetric cylindrical geometry and nearly 4
πcoverage in solid angle.1 It consists of an inner tracking detector surrounded by a thin superconducting solenoid providing a 2 T axial magnetic field, electromagnetic and hadron calorimeters, and a muon spectrometer. A two-level trigger [18, 19] reduces the event rate to a maximum of 1 kHz for offline data storage. The data used in the searches were collected during stable beam conditions and with all ATLAS subsystems fully operational, corresponding to an integrated luminosity
1ATLAS uses a right-handed coordinate system with its origin at the nominal interaction point (IP) in the centre of the detector and thez-axis along the beam pipe. The x-axis points from the IP to the centre of the LHC ring, and the y-axis points upwards. Cylindrical coordinates(r, φ)are used in the transverse plane, φ being the azimuthal angle around thez-axis.
The pseudorapidity is defined in terms of the polar angleθasη=−ln tan(θ/2). Angular distance is measured in units of
∆R≡p
(∆η)2+(∆φ)2.
g
g
κt
κt
H
H t/b
(a)
g
g
κt
κt
H
H t/b
(b)
g
g
κt κλ H
H t/b
H
(c)
g
g
H
H t/b
X
(d)
Figure 1: Examples of leading-order Feynman diagrams for Higgs boson pair production proportional to (a)-(b) the square of the heavy-quark Yukawa coupling, and to (c) the product of the latter with the Higgs boson self-coupling.
Here,κtandκλare the SM coupling multipliers of, respectively, the heavy-quark Yukawa coupling and the Higgs boson self-coupling. The diagram (d) illustrates the production of a Higgs boson pair via the decay of an intermediate resonance (X) produced through a heavy-quark loop.
of up to 36.1 fb
−1(with one exception discussed below), derived following a methodology similar to that detailed in Ref. [20]. The three most sensitive search channels are used:
HH →bbb¯
b¯ ,
HH →bbτ¯
+τ−and
HH→bbbγγ¯ , with analysis strategies detailed in Refs. [21–23] and summarised below.
• In the search for
HH → bbb¯¯
b, two different analyses are performed, referred to as “resolved analysis” and “boosted analysis”. The resolved analysis is based on jets reconstructed using the anti-
ktalgorithm [24] with a radius parameter value of
R=0
.4. Two Higgs boson candidates are formed from the four jets for which the probabilities of containing a
b-hadron (
b-tagging) are highest. During the 2016 data-taking, an inefficiency in the vertex reconstruction affected the trigger-level
b-tagging algorithm, preventing the acquisition of a fraction of the data. Therefore, the resolved analysis is performed with a reduced amount of data, corresponding to an integrated luminosity of 27.5 fb
−1, and the datasets collected in 2015 and 2016 are treated independently. The boosted analysis is based on jets reconstructed using the anti-
ktalgorithm with
R=1
.0, each jet fully contains the decay products of one Higgs boson and is required to have a
b-tagged track-jet associated to it and a jet mass compatible with
mH. The boosted analysis is performed on the full 2015+2016 dataset, corresponding to an integrated luminosity of 36.1 fb
−1. In both analyses, the predominant multi-jet background is estimated with a data-driven method. A data sample containing fewer
b-tagged jets than in the nominal selection is used to estimate the shape of the multi-jet background. This data sample is re-weighted with a set of correction factors, which are derived in dedicated sideband regions and take into account the kinematic differences between events containing the nominal number of
b-tagged jets and those with fewer
b-tagged jets. The normalisations of the multi-jet and
ttbackgrounds are determined simultaneously from fits to sensitive variables in the sideband region and used in a profile-likelihood fit of the invariant mass of the two Higgs boson candidates to extract the signal.
• In the search for
HH →bbτ¯
+τ−, the selected final states consist of either one electron/muon and
a narrow jet coming from a hadronically decaying
τ-lepton (referred to as
τhad-vis) or two
τhad-viscandidates, together with two
b-tagged jets and missing transverse energy (E
missT) coming from the neutrinos produced in the decays of the two
τ-leptons. In the two search channels (referred to as
τlepτhadand
τhadτhad), several kinematic variables providing good separation between signal and SM backgrounds are used as inputs to Boosted Decision Trees (BDTs). In the
τlepτhadchannel, two complementary trigger configurations are employed. Events triggered by a single electron or muon are assigned to the category Single Lepton Trigger (SLT in the following). Events not assigned to the SLT category and with one electron or muon together with one
τhad-visobject at trigger level are assigned to the category Lepton Tau Trigger (LTT). A profile-likelihood fit is applied to the BDT score distributions in three signal regions (SLT
τlepτhad, LTT
τlepτhadand
τhadτhad) and to the event yields in relevant background-enriched control regions to extract the signal and constrain the normalisation factors of two dominant backgrounds:
ttand
Zproduction with heavy-flavor quarks.
• In the search for
HH →bbγγ¯ , events are required to have two isolated photons and two jets with an invariant mass
mj jcompatible with
mH, of which at least one jet is
b-tagged. Events are separated into different signal categories depending on whether one or two
b-tagged jets are found, then two kinematic selections are applied. A first selection is optimised to search for the SM non-resonant
HHproduction and for resonances with masses in the range 500–1000 GeV, while a second, looser, selection is used to search for resonances with masses in the range 260–500 GeV and to probe non-SM values of
λH H H. In the search for non-resonant Higgs boson pair production, the signal is extracted using a fit to the
mγγdistribution of the selected events. When searching for resonant production of
HHpairs,
mγγis required to be compatible with the Higgs boson mass and the signal is extracted from a fit to the
mj jγγdistribution.
A combination of the results of the same three search channels and the less sensitive
HH →W+W−γγchannel was performed using data collected in the Run-1 of LHC at
√s =
8 TeV [25]. For the non-resonant Higgs boson pair production mode, the observed (expected) 95% confidence-level (CL) exclusion limits set by ATLAS on the cross-section for
gg→HHat 8 TeV were 70 (48) times the SM prediction. For the production of Higgs boson pairs via narrow resonances, the Run-1 observed (expected) exclusion limits for a heavy Higgs boson decay range from 2.1 (1.1) pb for a Higgs boson mass of 260 GeV to 0.011 (0.018) pb at 1000 GeV. The CMS Collaboration combined the results of the
HH → bbγγ¯ and
HH → bbτ¯
+τ−searches using data collected in the Run-1 of LHC [26, 27] and, more recently, combined the results of Higgs boson pair searches at 13 TeV based on 35.9 fb
−1of data, using the decay channels into
bbb¯¯
b,
bbVV¯ where
Vis a vector boson,
bbτ¯
+τ−and
bbγγ¯ [28]. The corresponding observed (expected) 95%
CL upper limit on the
HHproduction cross-section was found to be 22.2 (12.8) times the SM value, and resonances with masses in the range 250–3000 GeV were probed, with no evidence of BSM physics.
2 Combination of results on non-resonant Higgs boson pair production
The statistical interpretation of the combined search results is based on a simultaneous fit of the signal cross-section and the nuisance parameters
θthat encode statistical and systematic uncertainties, by means of a negative log-likelihood minimisation. The branching fractions of the Higgs boson are assumed to be equal to the SM predictions [9]. The test statistic ˜
qµ[29] used to test the compatibility of the data with the background-only and signal plus background hypotheses is computed from the profile likelihood ratio. The asymptotic approximation is used for the statistical analysis of all decay channels, and their combination.
The same approach is used in the individual published results of the
HH →bbb¯¯
band
HH →bbττ¯ search
channels, while pseudo-experiments are used in the published results of
HH → bbγγ¯ . The asymptotic
approximation is found to be in agreement with pseudo-experiments at a level of 10% for all results on the individual
HH →bbγγ¯ channel presented here, while an agreement at the level of 5% is obtained for the results on the combination of the three channels.
All the signal regions considered in the simultaneous fit either are orthogonal by construction or have negligible overlap. The instrumental systematic uncertainties, as well as the 2.1% uncertainty on the integrated luminosity [20], are correlated across all search channels. On the other hand, given the different final states, the uncertainties in the modelling of the SM backgrounds and the acceptance of the
HHsignals are treated as uncorrelated across the search channels.
The 95% CL upper limits on the signal strength in units of the SM non-resonant
gg→HHcross-sections are shown in Figure 2, for the individual search channels, as well as their combination. In order to show the impact of the systematic uncertainties, combined expected limits with only statistical uncertainties are also reported. The observed (expected) combined limit with all statistical and systematic uncertainties is, respectively, 0.22 pb (0.35 pb), corresponding to 6.7 (10.4) times the SM prediction, taking into account all correlations between the three individual channels. With respect to the published results of the searches for
HH → bbγγ¯ and
HH → bbτ¯
+τ−, theoretical uncertainties on the total signal cross-section are not considered and, in the case of
HH →bbγγ¯ only, the asymptotic approximation is used instead of pseudo- experiments. The combined observed upper limit on the non-resonant
HHproduction is stronger than expected, but within the 2
σuncertainty band. All three search channels have a deficit of data with respect to the background-only prediction. In particular, in the
HH→bbb¯¯
bsearch, the non-resonant signal shape has its maximum around 400 GeV, with a slowly-falling reconstructed
mH Hspectrum towards high mass and, in several bins, the number of observed events is below the prediction, see Ref. [21] for details.
0 10 20 30 40 50 60 70 80
ggF
σSM
HH) normalized to
→ (pp σggF
95% CL upper limit on Combined
γ γ b
→ b HH
τ-
τ+
b
→ b HH
b b b
→ b
HH 12.9 20.7 18.5
12.6 14.6 11.9
20.4 26.3 25.1
6.7 10.4 9.2
Obs. Exp. Exp. stat.
Observed Expected
σ
± 1 Expected
σ
± 2 Expected
ATLAS Preliminary
= 13 TeV, 27.5 - 36.1 fb-1
s
HH) = 33.4 fb
→ (pp
ggF
σSM
Figure 2: Upper limits at 95% CL on the cross-section of the ggF non-resonant Higgs boson pair production from theHH→bbb¯ b¯,HH→bbτ¯ +τ−andHH→bbγγ¯ searches, and their statistical combination. The column "obs."
represents the observed limits, "exp." the expected limits with all statistical and systematic uncertainties, and "exp.
stat." the expected limits obtained with statistical uncertainties only.
After setting all couplings except the Higgs boson self-coupling
λH H Hto their SM values, a
κλ-scan is
performed. This scale factor affects both the production cross-section and the kinematic distributions of
the Higgs boson pairs, by modifying the amplitude of the interference among the three
HHproduction
diagrams.
For each value of
κλ, kinematic distributions, and in particular the
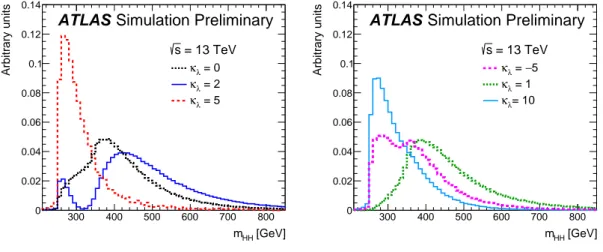
mH Hspectrum, are computed at the generator-level, using the leading-order (LO) version of MadGraph5_aMC@NLO [30] with the NNPDF 2.3 LO [31] parton distribution function (PDF) set, together with Pythia8 [32] for the showering model.
As the amplitude for Higgs boson pair production depends on
κλ, linear combinations of three LO samples are used to make predictions for any value of
κλ. This procedure is illustrated in Figure 3, which shows variations of the
mH Hspectrum with
κλ. Binned ratios of
mH Hdistributions for any given
κλand the SM case (
κλ=1) are computed and then used to re-weight the kinematic distributions of the nominal sample.
The nominal sample of non-resonant
HHproduction was generated using MadGraph5_aMC@NLO at NLO in QCD, with the CT10 NLO [33] PDF set, interfaced to Herwig++ [34] for the parton shower model.
The re-weighting procedure is applied after having corrected the NLO
mH Hspectrum to reproduce the spectrum calculated in Refs. [8, 35], which fully accounts for top-quark mass effects. For that purpose, it is assumed that NLO QCD corrections are independent of
κλ. In turn, the re-weighted NLO sample can be used to compute the signal acceptance for varied values of
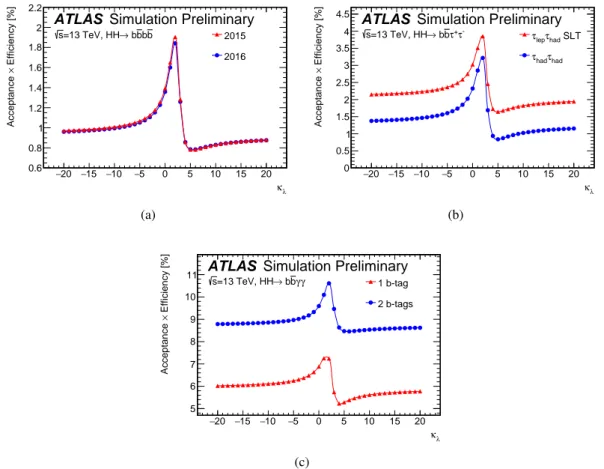
κλ, separately for each search channel, as shown in Figure 4.
300 400 500 600 700 800
[GeV]
mHH
0 0.02 0.04 0.06 0.08 0.1 0.12 0.14
Arbitrary units
ATLAS Simulation Preliminary
= 13 TeV s
λ = 0 κ
λ = 2 κ
λ = 5 κ
300 400 500 600 700 800
[GeV]
mHH
0 0.02 0.04 0.06 0.08 0.1 0.12 0.14
Arbitrary units
ATLAS Simulation Preliminary
= 13 TeV s
−5
λ = κ
λ = 1 κ
λ= 10 κ
Figure 3: Generator-levelmH H distributions computed for various values of κλ by linearly combining three LO samples produced with MadGraph5_aMC@NLO.
• In the
HH → bbb¯¯
bsearch channel, the reconstructed
mH Hdistribution is used as a fit template in the statistical analysis, as in the corresponding search for SM non-resonant
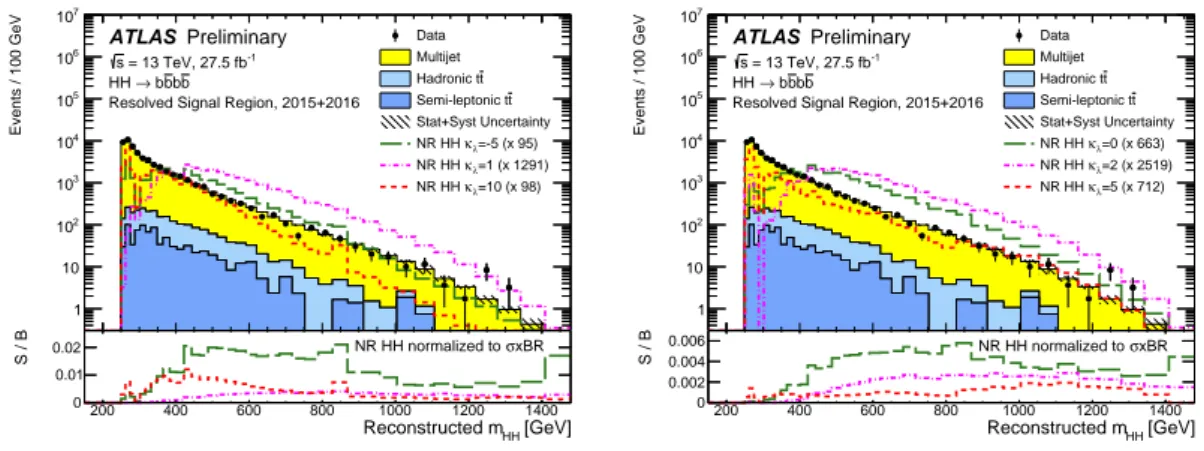
HHproduction. Its shape has a strong dependence on the chosen value of the Higgs boson self-coupling (see Figure 5), and so does the signal acceptance, as shown in Figure 4(a): it varies by a factor 2.5 over the probed range of
κλ-values. Both effects together determine how the exclusion limits on the cross-section of
HH→bbb¯
b¯ vary as a function of
κλ.
• In the
HH → bbτ¯
+τ−search channel, only the SLT
τlepτhadand
τhadτhadsignal regions are used.
Also, the BDTs are trained using the re-weighted NLO signal sample corresponding to
κλ =20, which shows good sensitivity over the whole range of probed
κλ-values. The fit template is the BDT score distribution, which has a dependence on
κλ(see Figure 6) through the shape variations of some BDT input variables, in particular
mH H, with the Higgs boson self-coupling. In addition, the sensitivity of this analysis is also affected by the fact that the signal acceptance varies by a factor of about 3 over the probed range of
κλ-values, as shown in Figure 4(b).
• In the
HH → bbγγ¯ search channel, the kinematic selection used for the
κλ-scan is less stringent
than when setting limits on the SM
HHcross-section, as the average transverse momentum of the Higgs bosons is lower at large values of
κλ. The statistical analysis is performed using the
mγγdistribution as the fit template, as in the corresponding search for SM non-resonant
HHproduction.
While the shape of the discriminant remains independent of
κλ, the signal acceptance varies by about 30% over the probed range of
κλ-values, as illustrated in Figure 4(c). This is the main cause of the variations of the exclusion limits on the cross-section of
HH→bbγγ¯ with
κλ.
−20 −15 −10 −5 0 5 10 15 20
κλ
0.6 0.8 1 1.2 1.4 1.6 1.8 2 2.2
Efficiency [%]× Acceptance
2015 2016
ATLAS Simulation Preliminary
b b b
→ b
=13 TeV, HH s
(a)
−20 −15 −10 −5 0 5 10 15 20
κλ
0 0.5 1 1.5 2 2.5 3 3.5 4 4.5
Efficiency [%]× Acceptance
had SLT
lepτ τ
τhad
τhad
ATLAS Simulation Preliminary
τ-
τ+
b
→ b
=13 TeV, HH s
(b)
−20 −15 −10 −5 0 5 10 15 20
κλ
5 6 7 8 9 10 11
Efficiency [%]× Acceptance
1 b-tag 2 b-tags
ATLAS Simulation Preliminary
γ γ b
→ b
=13 TeV, HH s
(c)
Figure 4: Signal acceptance times efficiency as a function ofκλ for (a) HH → bbb¯ b¯, (b) HH → bbτ¯ +τ− and (c) HH → bbγγ¯ . The acceptances are split by years for the HH → bbb¯ b¯ analysis, due to different trigger configurations, and by event categories for theHH→bbτ¯ +τ−andHH→bbγγ¯ analyses.
The exclusion limits resulting from the
κλ-scan are shown in Figure 7. They follow the features of
the product of the cross-section and the signal acceptance, with e.g. a minimum at
κλ '2
.5 where
the destructive interference is the largest, and a maximum at
κλ '5 where the
mH Hspectrum is the
softest. The variations of the exclusion limits with
κλare less pronounced in the
HH → bbγγ¯ search
channel, as the final discriminant (
mγγ) is not dependent on the shape of the
mH Hspectrum. The
κλvalues that are allowed at 95% CL are reported in Table 1. In order to show the impact of the systematic
uncertainties on this analysis, Table 1 and Figure 7(b) show also results computed without including
systematic uncertainties.
[GeV]
Reconstructed mHH
200 400 600 800 1000 1200 1400
Events / 100 GeV
1 10 102 103 104 105 106 107
Data Multijet
t Hadronic t
t Semi-leptonic t Stat+Syst Uncertainty
=-5 (x 95) κλ NR HH
=1 (x 1291) κλ NR HH
=10 (x 98) κλ NR HH
Preliminary ATLAS
= 13 TeV, 27.5 fb-1 s
b b b
→ b HH
Resolved Signal Region, 2015+2016
[GeV]
Reconstructed mHH
200 400 600 800 1000 1200 1400
S / B
0 0.01
0.02 NR HH normalized to σxBR
[GeV]
Reconstructed mHH
200 400 600 800 1000 1200 1400
Events / 100 GeV
1 10 102 103 104 105 106 107
Data Multijet
t Hadronic t
t Semi-leptonic t Stat+Syst Uncertainty
=0 (x 663) κλ NR HH
=2 (x 2519) κλ NR HH
=5 (x 712) κλ NR HH
Preliminary ATLAS
= 13 TeV, 27.5 fb-1 s
b b b
→ b HH
Resolved Signal Region, 2015+2016
[GeV]
Reconstructed mHH
200 400 600 800 1000 1200 1400
S / B
0 0.002 0.004
0.006 NR HH normalized to σxBR
Figure 5: ReconstructedmH H distribution in the non-resonant (NR)HH→bbb¯ b¯analysis, with overlaid signal for severalκλ-values. In the upper panel, the signal normalisation is scaled to 50% of the overall data yield by the factors shown in the legend, while it is normalised to the expected cross-section for the indicatedκλ-value in the lower panel. The background distributions are shown: the data-driven multi-jet background (Multijet), thett¯→W+W−bb¯ background with bothW bosons decaying hadronically (Hadronictt¯) and the same process with at least one of the W bosons decaying leptonically (Semi-leptonictt¯).
Search channel Allowed
κλinterval at 95% CL
obs. exp. exp. stat.
HH→bbb¯
¯
b−10.9 – 20.1 −11.6 – 18.7 −9.9 – 16.4
HH→bbτ¯
+τ−−7.3 – 15.7 −8.8 – 16.7 −7.8 – 15.4
HH→bbγγ¯ −8.1 – 13.2 −8.2 – 13.2 −7.7 – 12.7 Combination −5.0 – 12.1 −5.8 – 12.0 −5.2 – 11.4
Table 1: Allowed κλ intervals at 95% CL for each search channel and their combination. The column “obs.”
represents the observedκλintervals, “exp.” the expectedκλintervals with all statistical and systematic uncertainties, and “exp. stat.” the expectedκλintervals obtained with statistical uncertainties only.
3 Combination of results on resonant Higgs boson pair production
Following a similar methodology, a statistical combination of the searches for resonant
HHproduction is performed in the mass range 260–1000 GeV. The resonance decaying to a pair of Higgs bosons is assumed to be either a heavy scalar particle
Swith a narrow width or a spin-2 Kaluza–Klein graviton,
GKK, with
k/M¯
Plset to either 1 or 2, where
kis the curvature of the warped extra dimension in the bulk Randall–
Sundrum model and ¯
MPl =2
.4
×10
18GeV is the effective four-dimensional Planck scale. Relative to the graviton mass, the width ranges from 3% (6%) at low mass to 13% (25%) at the highest mass for
k/M¯
Pl =1
(2
). The search for gravitons is performed only in the
HH →bbb¯¯
band the
HH →bbτ¯
+τ−channels. All spin-2 signal samples were generated at LO in QCD using MadGraph5_aMC@NLO with the NNPDF 2.3 LO PDF set, interfaced to Pythia8 for the parton shower model, while different choices were made for the spin-0 signal samples, as described in Refs. [21–23].
No statistically significant excess is observed across the probed mass range of the resonance. For a scalar
resonance, the observed (expected) combined 95% CL upper limits on the
S → HHproduction are
0.83 pb at 260 GeV and 0.02 pb at 1 TeV (0.73 pb and 0.03 pb). For a spin-2
GKK, the observed (expected)
−1 −0.8−0.6−0.4−0.2 0 0.2 0.4 0.6 0.8 1 BDT 1
10 102
103
104
105
106
107
Events / Bin
Data
λ=-5 κ NR HH
λ=1 κ NR HH
λ=10 κ NR HH Top-quark
fakes τhad
→ jet
+(bb,bc,cc) τ τ
→ Z Other SM Higgs Uncertainty Pre-fit background ATLAS Preliminary
= 13 TeV, 36.1 fb-1
s τ-
τ+
b
→ b HH
SLT 2 b-tags τhad
τlep
−1 −0.8−0.6−0.4−0.2 0 0.2 0.4 0.6 0.8 1 BDT 0.8
1 1.2
Data/Pred.
−1 −0.8−0.6−0.4−0.2 0 0.2 0.4 0.6 0.8 1 BDT 1
10 102
103
104
105
106
107
Events / Bin
Data
λ=0 κ NR HH
λ=2 κ NR HH
λ=5 κ NR HH Top-quark
fakes τhad
→ jet
+(bb,bc,cc) τ τ
→ Z Other SM Higgs Uncertainty Pre-fit background ATLAS Preliminary
= 13 TeV, 36.1 fb-1
s τ-
τ+
b
→ b HH
SLT 2 b-tags τhad
τlep
−1 −0.8−0.6−0.4−0.2 0 0.2 0.4 0.6 0.8 1 BDT 0.8
1 1.2
Data/Pred.
−1 −0.8−0.6−0.4−0.2 0 0.2 0.4 0.6 0.8 1 BDT 1
10 102
103
104
105
106
107
Events / Bin
Data
λ=-5 κ NR HH
λ=1 κ NR HH
λ=10 κ NR HH Top-quark
fakes (Multi-jets) τhad
→ jet
+(bb,bc,cc) τ τ
→ Z
) t fakes (t τhad
→ jet Other SM Higgs Uncertainty Pre-fit background ATLAS Preliminary
= 13 TeV, 36.1 fb-1
s τ-
τ+
b
→ b HH
2 b-tags τhad
τhad
−1 −0.8−0.6−0.4−0.2 0 0.2 0.4 0.6 0.8 1 BDT 0.81
1.2
Data/Pred.
−1 −0.8−0.6−0.4−0.2 0 0.2 0.4 0.6 0.8 1 BDT 1
10 102
103
104
105
106
107
Events / Bin
Data
λ=0 κ NR HH
λ=2 κ NR HH
λ=5 κ NR HH Top-quark
fakes (Multi-jets) τhad
→ jet
+(bb,bc,cc) τ τ
→ Z
) t fakes (t τhad
→ jet Other SM Higgs Uncertainty Pre-fit background ATLAS Preliminary
= 13 TeV, 36.1 fb-1
s τ-
τ+
b
→ b HH
2 b-tags τhad
τhad
−1 −0.8−0.6−0.4−0.2 0 0.2 0.4 0.6 0.8 1 BDT 0.81
1.2
Data/Pred.
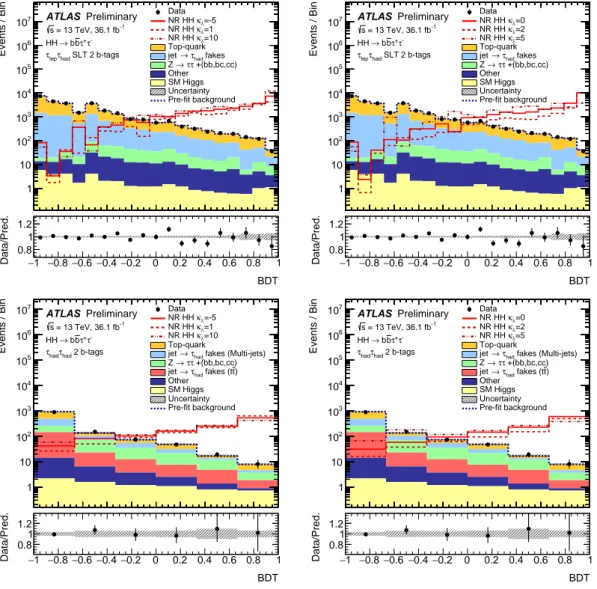
Figure 6: BDT distribution in the non-resonant (NR)HH→bbτ¯ +τ−analysis for theτlepτhad(top) and theτhadτhad (bottom) channels. Signal is overlaid for severalκλ-values and it is normalised to the total expected background.
The main backgrounds arett¯and single-top-quark production (Top-quark), the background arising from jets faking hadronic taus (jet→ τhadfakes),Z → τ+τ−plus two heavy-flavor jets [Z →ττ+(bb,bc,cc)], SM single Higgs boson production (SM Higgs) and other minor backgrounds (Other).
−20 −15 −10 −5 0 5 10 15 20 λSM HHH / λ
λ = κ
−2
10
−1
10 1 10 102
HH) [pb]→ (pp ggFσ95% CL upper limit on
SM
(exp.) b b b b
(obs.) b b b b
(exp.) τ- τ+ b b
(obs.) τ- τ+ b b
(exp.) γ γ b b
(obs.) γ γ b b
Combined (exp.) Combined (obs.)
(Combined) σ
±1 Expected
(Combined) σ
±2 Expected Theory prediction
ATLAS Preliminary 27.5 - 36.1 fb-1
= 13 TeV, s
(a)
−20 −15 −10 −5 0 5 10 15 20 λSM HHH / λ
λ = κ
−2
10
−1
10 1 10 102
HH) [pb]→ (pp ggFσ95% CL upper limit on
SM
(exp.) b b b b
(exp.) τ- τ+ b b
(exp.) γ γ b b
Combined (exp.) Combined (exp.) full syst.
(Combined) σ
±1 Expected
(Combined) σ
±2 Expected Theory prediction
ATLAS Preliminary 27.5 - 36.1 fb-1
= 13 TeV, s
Stat. only
(b)
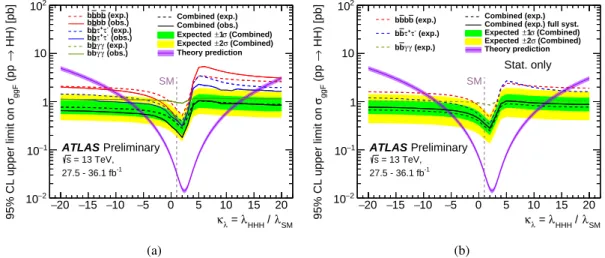
Figure 7: Upper limits at 95% CL on the cross-section of the ggF non-resonant Higgs boson pair production as a function ofκλ, (a) with all systematic and statistical uncertainties and (b) with only statistical uncertainties, except for the combined limits (long-dashed line) that also include the systematic uncertainties. In (a), observed (expected) limits are shown in solid (dashed) lines. In theHH→ bbγγ¯ channel, the observed and expected limits coincide.
In both figures, the±1σand±2σbands are only shown for the combined expected limit. The theory prediction is obtained scaling the NNLO + NNLL SM cross section by theκλdependent factorσκλ(pp→HH)/σκλ=1(pp→HH) computed at LO.
combined 95% CL limits are 1.89 pb at 260 GeV and 0.02 pb at 1 TeV (1.50 pb and 0.02 pb) for
k/M¯
Pl=1, and they become 0.13 pb and 0.04 pb (0.19 pb and 0.03 pb) for
k/M¯
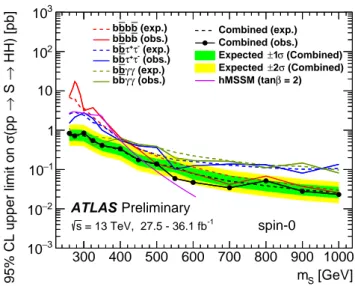
Pl =2. The upper limits are shown as a function of the resonance mass in Figure 8 for the spin-0 hypothesis, and in Figures 9(a) and 9(b) for the spin-2 hypotheses and
k/M¯
Plequal to 1 and 2, respectively.
In a simplified minimal supersymmetric model, known as the hMSSM [36–38], the scalar resonance is the heavier
CP-even Higgs boson, while the lighter
CP-even Higgs boson has its mass fixed to 125 GeV.
In such a scenario, 260 GeV
< mS <462 GeV is excluded at 95% CL for tan
β= 2, where tan
βis
the ratio of the vacuum expectation values of the two scalar doublets. In the case of
k/M¯
Pl =1, the
bulk Randall–Sundrum model is excluded by the combination of
HH → bbb¯¯
band
HH → bbτ¯
+τ−at
95% CL for graviton masses above 307 GeV. Beyond 1 TeV, where no combination is performed, only
HH →bbb¯
b¯ provides significant sensitivity, bringing the exclusion range to 1362 GeV [21]. Within the
probed mass range, the exclusion expands to
mGKKvalues below 1744 GeV if
k/M¯
Pl=2, again set by the
HH →bbb¯¯
bsearch channel.
300 400 500 600 700 800 900 1000 [GeV]
mS
−3
10
−2
10
−1
10 1 10 102
103
HH) [pb]→ S →(pp σ95% CL upper limit on
SM
(exp.) b b b b
(obs.) b b b b
(exp.) τ-
τ+
b b
(obs.) τ-
τ+
b b
(exp.) γ γ b b
(obs.) γ γ b b
Combined (exp.) Combined (obs.)
(Combined) σ
±1 Expected
(Combined) σ
±2 Expected
= 2) β hMSSM (tan
ATLAS Preliminary = 13 TeV, 27.5 - 36.1 fb-1
s spin-0
Figure 8: Upper limits at 95% CL on the cross-section of the spin-0 resonant Higgs boson pair production. The observed (expected) limits are shown in solid (dashed) lines. The±1σ and±2σ bands are only shown for the expected limits of the combination.
300 400 500 600 700 800 900 1000
[GeV]
KK G*
m
−2
10
−1
10 1 10 102
HH) [pb]→KK
* G→(pp σ95% CL upper limit on SM
(exp.) b b b b
(obs.) b b b b
(exp.) τ- τ+ b b
(obs.) τ- τ+ b b
Combined (exp.) Combined (obs.)
(Combined) σ
±1 Expected
(Combined) σ
±2 Expected
= 1.0 MPl Bulk RS, k/
ATLAS Preliminary = 13 TeV, 27.5 - 36.1 fb-1
s spin-2, k/MPl = 1.0
(a)
300 400 500 600 700 800 900 1000
[GeV]
KK G*
m
−3
10
−2
10
−1
10 1 10 102 HH) [pb]→KK
* G→(pp σ95% CL upper limit on SM
(exp.) b b b b
(obs.) b b b b
(exp.) τ- τ+ b b
(obs.) τ- τ+ b b
Combined (exp.) Combined (obs.)
(Combined) σ
±1 Expected
(Combined) σ
±2 Expected
= 2.0 MPl Bulk RS, k/
ATLAS Preliminary = 13 TeV, 27.5 - 36.1 fb-1
s spin-2, k/MPl = 2.0
(b)
Figure 9: Upper limits at 95% CL on the cross-section of the spin-2 resonant Higgs boson pair production, for (a) k/M¯Pl=1 and (b)k/M¯Pl=2. The observed (expected) limits are shown in solid (dashed) lines. The±1σand±2σ bands are only shown for the expected limits of the combination. Only theHH→bbb¯ b¯andHH→bbτ¯ +τ−search results are used in this combination.
4 Conclusion
Using 36.1 fb
−1of
ppcollision data recorded at 13 TeV with the ATLAS experiment at the LHC, a statistical combination of three channels,
HH→bbb¯
b¯ ,
HH→bbτ¯
+τ−and
HH →bbγγ¯ , for the search of non-resonant and resonant production of Higgs boson pairs is presented. For the non-resonant
HHproduction mode, the observed (expected) 95% CL upper limit on the
gg → HHcross-section is 6.7 (10.4) times the SM prediction corresponding to 0.22 pb (0.35 pb). Exclusion limits are also computed as a function of the Higgs boson self-coupling scale factor
κλ=λH H H/λSMH H Hwith the allowed range being
−
5
.0
< κλ <12
.1 (
−5
.8
< κλ <12
.0) at 95% CL. In the resonant
HHproduction mode no statistically
significant excess of events above the SM predictions is found, and upper limits are set on the production
cross-section of heavy spin-0 and spin-2 resonances decaying into a pair of Higgs bosons in the mass
range 260–1000 GeV.
References
[1] L. Evans and P. Bryant, LHC Machine , J. Instrum.
3(2008) S08001.
[2] ATLAS Collaboration, Observation of a new particle in the search for the Standard Model Higgs boson with the ATLAS detector at the LHC , Phys. Lett. B
716(2012) 1,
arXiv: 1207.7214 [hep-ex] . [3] CMS Collaboration,
Observation of a new boson at a mass of 125 GeV with the CMS experiment at the LHC , Phys. Lett. B
716(2012) 30, arXiv: 1207.7235 [hep-ex] .
[4] ATLAS and CMS Collaborations, Combined Measurement of the Higgs Boson Mass in
ppCollisions at
√s=
7 and 8 TeV with the ATLAS and CMS Experiments , Phys. Rev. Lett.
114(2015) 191803, arXiv: 1503.07589 [hep-ex] . [5] ATLAS and CMS Collaborations,
Measurements of the Higgs boson production and decay rates and constraints on its couplings from a combined ATLAS and CMS analysis of the LHC pp collision data at
√s =
7 and 8 TeV , JHEP
08(2016) 045, arXiv: 1606.02266 [hep-ex] .
[6] F. Englert and R. Brout, Broken Symmetry and the Mass of Gauge Vector Mesons , Phys. Rev. Lett.
13(1964) 321.
[7] P. W. Higgs, Broken Symmetries and the Masses of Gauge Bosons , Phys. Rev. Lett.
13(1964) 508.
[8] S. Borowka et al., Higgs Boson Pair Production in Gluon Fusion at Next-to-Leading Order with Full Top-Quark Mass Dependence ,
Phys. Rev. Lett.
117(2016) 012001, [Erratum: Phys. Rev. Lett.
117(2016) 079901], arXiv: 1604.06447 [hep-ph] .
[9] D. de Florian et al.,
Handbook of LHC Higgs Cross Sections: 4. Deciphering the Nature of the Higgs Sector , (2016), arXiv: 1610.07922 [hep-ph] .
[10] L. Di Luzio, R. Gröber and M. Spannowsky,
Maxi-sizing the trilinear Higgs self-coupling: how large could it be? , Eur. Phys. J. C
77(2017) 788, arXiv: 1704.02311 [hep-ph] . [11] G. D. Kribs, A. Maier, H. Rzehak, M. Spannowsky and P. Waite,
Electroweak oblique parameters as a probe of the trilinear Higgs boson self-interaction , Phys. Rev. D
95(2017) 093004, arXiv: 1702.07678 [hep-ph] .
[12] A. Djouadi, The anatomy of electroweak symmetry breaking Tome II: The Higgs bosons in the Minimal Supersymmetric Model , Phys. Rept.
459(2008) 1, arXiv: hep-ph/0503173 [hep-ph] . [13] G. C. Branco et al., Theory and phenomenology of two-Higgs-doublet models ,
Phys. Rept.
516(2012) 1, arXiv: 1106.0034 [hep-ph] .
[14] L. Randall and R. Sundrum, A Large mass hierarchy from a small extra dimension , Phys. Rev. Lett.
83(1999) 3370, arXiv: hep-ph/9905221 [hep-ph] .
[15] ATLAS Collaboration, The ATLAS Experiment at the CERN Large Hadron Collider , JINST
3(2008) S08003.
[16] ATLAS Collaboration, ATLAS Insertable B-Layer Technical Design Report , ATLAS-TDR-19,
2010, url: https://cds.cern.ch/record/1291633 .
[17] ATLAS Collaboration, ATLAS Insertable B-Layer Technical Design Report Addendum , ATLAS-TDR-19-ADD-1, 2012, url: https://cds.cern.ch/record/1451888 . [18] ATLAS Collaboration, Performance of the ATLAS trigger system in 2015 ,
Eur. Phys. J. C
77(2017) 317, arXiv: 1611.09661 [hep-ex] .
[19] ATLAS Collaboration, Trigger Menu in 2016 , ATL-DAQ-PUB-2017-001, 2017, url: https://cds.cern.ch/record/2242069 .
[20] ATLAS Collaboration,
Luminosity determination in pp collisions at
√s
= 8 TeV using the ATLAS detector at the LHC , Eur. Phys. J. C
76(2016) 653, arXiv: 1608.03953 [hep-ex] .
[21] ATLAS Collaboration, Search for pair production of Higgs bosons in the
bbb¯¯
bfinal state using proton-proton collisions at
√s=
13 TeV with the ATLAS detector , (2018), arXiv: 1804.06174 [hep-ex] .
[22] ATLAS Collaboration, A search for resonant and non-resonant Higgs boson pair production in the
bbτ¯
+τ−decay channel in
ppcollisions at
√s=
13 TeV with the ATLAS detector , (2018), arXiv: 1808.00336 [hep-ex] .
[23] ATLAS Collaboration, Search for Higgs boson pair production in the
γγbb¯ final state with 13 TeV
ppcollision data collected by the ATLAS experiment , (2018), arXiv: 1807.04873 [hep-ex] . [24] M. Cacciari, G. P. Salam and G. Soyez, The anti-k
tjet clustering algorithm , JHEP
04(2008) 063,
arXiv: 0802.1189 [hep-ph] .
[25] ATLAS Collaboration, Searches for Higgs boson pair production in the
hh→bbττ, γγWW∗, γγbb,bbbbchannels with the ATLAS detector , Phys. Rev. D
92(2015) 092004, arXiv: 1509.04670 [hep-ex] .
[26] CMS Collaboration, Search for two Higgs bosons in final states containing two photons and two bottom quarks in proton-proton collisions at 8 TeV , Phys. Rev. D
94(2016) 052012,
arXiv: 1603.06896 [hep-ex] .
[27] CMS Collaboration, Search for Higgs boson pair production in the
bbττfinal state in proton-proton collisions at
p(s)=
8 TeV, Phys. Rev. D
96(2017) 072004, arXiv: 1707.00350 [hep-ex] .
[28] CMS Collaboration, Combination of searches for Higgs boson pair production in proton-proton collisions at
√s=