A TLAS-CONF-2015-060 15 December 2015
ATLAS NOTE
ATLAS-CONF-2015-060
December 15, 2015
Measurement of the Higgs boson production cross section at 7, 8 and 13 TeV center-of-mass energies in the H → γγ channel with
the ATLAS detector
The ATLAS Collaboration
Abstract
Measurements of the fiducial cross section performed in the H → γγ decay channel are presented for Higgs boson production in proton–proton collisions at center-of-mass energies of 7, 8 and 13 TeV at the ATLAS experiment. Values for the measured total production cross section for a Standard Model Higgs boson are also given. The signal is extracted using a fit to the diphoton invariant-mass spectrum assuming that the natural width of the resonance is much smaller than the experimental resolution. The signal yield is corrected for the e ff ects of detector efficiency and resolution. The measured cross sections, statistically limited, are in agreement with Standard Model expectation.
c
2015 CERN for the benefit of the ATLAS Collaboration.
Reproduction of this article or parts of it is allowed as specified in the CC-BY-3.0 license.
Contents
1 Introduction 3
2 The ATLAS detector 4
3 Data samples and Monte Carlo simulation 4
3.1 Data samples 4
3.2 Monte Carlo simulation 5
4 Photon and event selection 6
4.1 Photon selection 6
4.2 Event selection 8
5 Extraction of the signal yield 10
5.1 Signal model 10
5.2 Background composition 11
5.3 Background model 11
5.4 Signal extraction 12
6 Correction for detector e ff ects 13
7 Systematic uncertainties 15
7.1 Uncertainties in the signal extraction 15
7.2 Uncertainties in the correction factor 16
7.3 Summary of uncertainties 18
8 Updated signal extraction and fiducial definition for Run-1 measurements 18
8.1 7 TeV correction factors and uncertainties 18
8.2 Updated 8 TeV correction factors and uncertainties 18
9 Theoretical predictions 19
10 Fiducial cross-section measurements 20
11 Summary and conclusions 21
1 Introduction
The ATLAS and CMS experiments discovered a Higgs boson in 2012 [1, 2], consistent with the last missing elementary particle of the Standard Model (SM) of electroweak and strong interactions. Sev- eral properties of this boson were measured with 7 and 8 TeV center-of-mass energy ( √
s) proton–
proton (pp) collision data delivered by the Large Hadron Collider (LHC) in 2011 and 2012, respec- tively. The measurements of production and decay rates, and di ff erential cross-section measurements showed no significant deviations from the SM expectations [3–6]. In particular, the pp → H → γγ fiducial cross section was measured at √
s = 8 TeV pp collisions by the ATLAS experiment to be 43.2 ± 9.4 (stat.)
+−2.93.2(syst.) ± 1.2 (lumi) fb for a Higgs boson of mass 125.4 GeV decaying to two isolated photons with transverse momentum greater than 35% and 25% of the diphoton invariant mass and each with absolute pseudorapidity less than 2.37 [7].
With the re-start of the LHC in 2015, the detailed program of Higgs boson property measurements will be extended to reach a higher precision compared to the 7 and 8 TeV analyses thanks to the expected increase of data statistics and the expected larger Higgs boson production cross section with √
s = 13 TeV. For the main production mode, which is gluon fusion, the production cross section for a Higgs mass (m
H) of 125 GeV is expected to increase by a factor of 2.3 from √
s = 8 to 13 TeV. In the time period of June to November 2015, the LHC delivered more than 4 fb
−1to the ATLAS experiment. While this dataset is not yet large enough to improve on the Higgs boson measurements performed with 7 and 8 TeV data, it gives the opportunity to measure its production cross section at √
s = 13 TeV.
The diphoton decay mode is well suited for the cross-section measurement of the Higgs boson due to the simple signature, the large experimental selection e ffi ciency and the excellent invariant-mass resolution.
The cross section at √
s = 13 TeV is measured in a fiducial region similar to the one used in the 8 TeV analysis (only the photon isolation definition is updated), to be as model independent as possible and allow a comparison to any theoretical prediction. However, the measurement result is also extrapolated to the total phase space under the assumption that the signal corresponds to the SM Higgs boson. The signal yield is extracted using a fit to the corresponding diphoton invariant-mass spectrum. The cross section is determined by correcting these yields for detector ine ffi ciency and resolution, and by accounting for the integrated luminosity of the dataset. The Higgs boson mass assumed in the measurement is 125.09 ±0.21 (stat.)± 0.11 (syst.) GeV, which is the combined ATLAS and CMS mass measurement [8].
While this note is mainly focusing on the results from the 2015 data taking, it also includes the first pp → H → γγ fiducial cross-section measurement at 7 TeV and an updated 8 TeV result using the latest Higgs boson mass measurement and the new photon isolation definition. The measurement with 13 TeV data also profits from several improvements in the diphoton selection procedure. The photon identification and the selection algorithm for the diphoton-production vertex were optimized for the 2015 data taking.
A new isolation definition is introduced, which is, compared to the algorithm used for the 7 and 8 TeV measurements, less sensitive to the energy arising from additional pp interactions occurring in the same or neighboring bunch crossings (called pileup) and which increases the selection efficiency for associated production of Higgs bosons with a top anti-top pair (t¯ tH) by 27%. This note is thus highlighting several ATLAS photon performance aspects from the 2015 data taking as well.
In the next section a brief description of the ATLAS detector is included, focusing on the parts which
are most relevant for this analysis. In the following sections, the photon and event selection, and the
extraction of the signal yield are discussed. In these sections, the emphasis is on the analysis of the 13
TeV data, and the main differences compared to the 7 and 8 TeV analyses are outlined. In Sections 6
and 7, the corrections for detector e ff ects and the systematic uncertainties for the analysis of 2015 data are discussed. In Section 8 the updated signal extraction and fiducial definitions for the 7 and 8 TeV data analysis are described, while theoretical predictions as well as the result of the fiducial and total cross- section measurements for the three di ff erent collision energies are presented in the last two sections.
2 The ATLAS detector
The ATLAS detector [9] is a multi-purpose particle physics detector with approximately forward-backward symmetric cylindrical geometry
1. The inner tracking detector (ID) covers |η| < 2.5 and consists of a sil- icon pixel detector, a silicon micro-strip detector, and a transition radiation tracker. This includes the newly installed innermost pixel layer, the insertable B-Layer (IBL) [10]. The ID is surrounded by a thin superconducting solenoid providing a 2 T axial magnetic field. A high-granularity lead / liquid-argon (LAr) sampling calorimeter measures the energy and the position of electromagnetic showers in the cen- tral (|η| < 1.475) and end-cap (1.375 < |η| < 3.2) regions. It includes a presampler (for |η| < 1.8) and three longitudinal sampling layers up to |η| < 2.5. The first layer has a fine segmentation in the regions
|η| < 1.4 and 1.5 < |η| < 2.4 to facilitate the separation of photons from neutral hadrons and to allow shower directions to be measured, while most of the energy is deposited in the second layer. LAr sam- pling calorimeters are also used to measure hadronic showers in the end-cap (1.5 < |η| < 3.2) and forward (3.1 < |η| < 4.9) regions, while an iron-scintillator / tile calorimeter measures hadronic showers in the cen- tral region ( |η| < 1.7). The muon spectrometer (MS) surrounds the calorimeters and consists of three large superconducting air-core toroid magnets, each with eight coils, a system of precision tracking chambers (|η| < 2.7), and fast tracking chambers for triggering.
In the 2015 data taking, events containing photon candidates are selected by a two-level trigger system.
The first-level trigger is hardware based: using a trigger cell granularity coarser than that of the electro- magnetic (EM) calorimeter, it searches for electromagnetic clusters within a fixed window of size 0.2×0.2 in η × φ and retains only those whose total transverse energy in two adjacent trigger cells is above a pro- grammable threshold. The algorithms of the high-level trigger are implemented in software. They exploit the full granularity and precision of the calorimeter to refine the first-level trigger selection, based on improved energy resolution and detailed information on energy deposition in the calorimeter cells.
3 Data samples and Monte Carlo simulation
3.1 Data samples
The cross-section measurements presented in this note are based on pp collision data collected between 2011 and 2015. During this time, the LHC accelerator operated at three di ff erent center-of-mass energies,
√ s = 7 and 8 TeV (Run-1) and √
s = 13 TeV (Run-2). The average number of inelastic interactions per bunch crossing varied considerably during these data taking periods, with 9, 21 and 14 interactions for the 7, 8 and 13 TeV data respectively.
1ATLAS uses a right-handed coordinate system with its origin at the nominal interaction point (IP) in the center of the detector and thez-axis along the beam pipe. The x-axis points from the IP to the center of the LHC ring, and the yaxis points upward. Cylindrical coordinates (r, φ) are used in the transverse plane,φbeing the azimuthal angle around the beam pipe.
The pseudorapidity is defined in terms of the polar angleθasη=−ln tan(θ/2).
Events from pp collisions were recorded using an unprescaled diphoton trigger with transverse energy (E
T) thresholds of 35 GeV and 25 GeV for the leading and sub-leading photon candidates, respectively. In the 7 TeV data taking period, the threshold was 20 GeV for both photon candidates [11]. In the high-level trigger, clusters of energy in the EM calorimeter were reconstructed and required to satisfy loose criteria according to expectations for EM showers initiated by photons. This trigger has a signal efficiency close to 99% for events fulfilling the o ffl ine event selection. Only events taken in stable beam conditions and in which the trigger system, the tracking devices and the calorimeters were operational and with good data quality are considered. The 7 TeV data sample corresponds to a total integrated luminosity of 4.5 fb
−1, the 8 TeV data sample to 20.3 fb
−1, and the 13 TeV data sample to 3.2 fb
−1.
3.2 Monte Carlo simulation
Simulated samples are used to determine the shapes of the diphoton mass spectra for signal and back- ground processes, and to correct the data for detector inefficiency and resolution. Stable particles, defined as particles with lifetime cτ > 10 mm [12], are passed through a full detector simulation [13] based on Geant4 [14]. The resulting detector signals are passed through the same event reconstruction algorithms as used for the data.
Samples of Higgs bosons decaying into two photons were generated separately for di ff erent production modes. Gluon fusion events are generated with Powheg-box [15, 16] interfaced with Pythia8 [17] for the underlying event, parton showering and hadronization. The overall normalization of the ggF process is taken from a calculation at next-to-next-to-leading order (NNLO) [18–23] in QCD. Next-to-leading- order (NLO) electroweak (EW) corrections are also included [24, 25]. The VBF samples are generated using P owheg - box [26] interfaced with P ythia 8 and normalized to a cross section calculated with full NLO QCD and EW corrections [27–29] with an approximate NNLO QCD correction applied [30]. Higgs bosons produced in association with a Z or W boson (ZH, W H) are generated with Pythia8. These predic- tions are normalized to cross sections calculated at NNLO [31] with NLO EW radiative corrections [32]
applied. The samples for associated production with a top anti-top pair for √
s = 7 and 8 TeV are gen- erated using the Powhel generator, a combination of the Powheg-box and Helac-NLO [33] generators, interfaced with P ythia 8. For the 13 TeV analysis, the a MC@NLO generator [34] is used, interfaced with H erwig [35] for parton shower and hadronization. Full NLO QCD corrections are included [36–39] in the t¯ tH normalization. At √
s = 13 TeV the different Higgs boson production modes contribute with the following fractions: ggF 86.2%, VBF 7.4%, W H 2.7%, ZH 1.7%, t¯ tH and b bH ¯ 1.0%.
Pileup e ff ects are simulated by overlaying each Monte Carlo (MC) event with a variable number of MC inelastic pp collisions generated using Pythia8. The MC events are weighted to reproduce the distribution of the average number of interactions per bunch crossing observed in the data. The AU2 [40] tuning of P ythia 8 is used to simulate the minimum-bias events and the underlying event in the 7 and 8 TeV data taking. For the 13 TeV data taking, the Pythia8 AZNLO tune [41] is used for the gluon fusion (ggF) and vector-boson fusion (VBF) signal and the A14 tune [42] is used for the other signal samples. The CT10 [43] parton distribution function (PDF) set is used for the samples generated with P owheg - box [44–
46] while CTEQ6L1 [47] is used for the samples generated with Pythia8. For the cross section extraction, the relative normalization of the di ff erent production modes follows the recommendations of the LHC Higgs cross-section working group [48] as described below.
The shape and normalization of the diphoton invariant-mass distributions in the three different data sets
are estimated by fits to the data. However, the choices of the functional forms to model the backgrounds
and the uncertainties associated with these choices are determined mostly by MC studies, as described in detail in Section 5.3. Events containing two photons with associated jets are simulated using the Sherpa 2.1.1 [49] generator. In S herpa , matrix elements are calculated at leading-order (LO) with up to 3 partons and merged with the S herpa parton shower [50] using the ME + PS@LO prescription [51]. The CT10 PDF set is used in conjunction with dedicated parton-shower tuning developed by the Sherpa authors. To increase the number of available MC background events, MC samples based on fast, simplified models of the detector response rather than full simulation are used: the resolutions and reconstruction e ffi ciencies for photons and jets are tuned as functions of the transverse momentum and pseudorapidity to reproduce the ones obtained from fully simulated samples. These samples are typically about 1000 times larger than the corresponding collected data samples after analysis selections. The 7 and 8 TeV measurements also
use γ–jet background samples generated using Sherpa [49, 52] and jet–jet background samples generated
by P ythia 8.
4 Photon and event selection
4.1 Photon selection
Photon reconstruction is seeded by energy clusters in the electromagnetic calorimeter with transverse en- ergies exceeding 2.5 GeV in projective towers of size 0.075× 0.125 in ∆ η × ∆ φ, made from the presampler and the three electromagnetic calorimeter layers. The cluster reconstruction e ffi ciency for photons and electrons with E
T> 25 GeV is estimated from simulation to be close to 100% [53]. These energy clus- ters are matched to tracks that are reconstructed in the inner detector and extrapolated to the calorimeter.
Well-reconstructed tracks matched to clusters are classified as electron candidates, while clusters without matching tracks are classified as unconverted photon candidates. Clusters matched to pairs of tracks that are consistent with the hypothesis of a γ → e
+e
−conversion process are classified as converted photon candidates. To maximize the reconstruction e ffi ciency for both electrons and photons, clusters matched to single tracks without hits in an active region of the pixel layer nearest to the beam pipe are also considered as converted photon candidates, as well as electron ones. If no hit on the innermost layer is expected, the pixel layer next to it is considered. In the 2015 data taking, the efficiency to correctly reconstruct photons from the clusters and tracks is 97%, while the remaining 3% are incorrectly reconstructed as electron candidates. The probability for a real electron with E
T> 25 GeV to be reconstructed as a photon ful- filling the tight identification criteria described below is measured in data to vary between 2% and 15%, depending on the pseudorapidity and the conversion class of the candidate.
The energy measurement is made in the electromagnetic calorimeter using a cluster size which depends on the photon classification. In Run-1, a size of ∆ η × ∆ φ = 0.075 × 0.125 is used for unconverted photons and 0.075 × 0.175 for converted photon candidates in the barrel, while in Run-2 the size is
∆ η × ∆ φ = 0.075 × 0.175 for all candidates in order to unify the cluster size for electrons, converted and unconverted photons. In the end-cap, a cluster size of 0.125 × 0.125 is used for all candidates.
A dedicated energy calibration (optimized with boosted regression trees) [54] is applied to account for
upstream energy losses, lateral and longitudinal leakage, separately for converted and unconverted photon
candidates. For Run-2, the response is determined using the updated detector geometry and reconstruction
with respect to Run-1. The final energy calibration is determined from Z → ee decays, resulting in η-
dependent correction factors of the order of ±(1–3)%. The initial Run-2 calibration factors are extracted
from 8 TeV Z → ee decays, reconstructed with Run-2 conditions. An e ff ective constant term for the
calorimeter energy resolution is extracted by adjusting the width of the reconstructed Z mass distribution in simulation to match the distribution in data [55].
Photon identification is based on the lateral and longitudinal energy profiles of the shower in the calorime- ter [56]. The photon candidate is required to deposit at most a small fraction of its energy in the hadronic calorimeter. The transverse shower shape in the second layer of the electromagnetic calorimeter needs to be consistent with that expected for a single electromagnetic shower. Finally, the high-granularity first layer is used to discriminate single photons from overlapping photon pairs from π
0decays produced in jet fragmentation, which are the main background source. Based on these criteria, a set of tight identifica- tion requirements, di ff erent for converted and unconverted candidates, are applied. To take into account small differences in shower shapes between data and simulation, the shape variables are shifted in the simulation before the identification cuts are applied. For the 2015 sample, the shifts are taken from the Run-1 analysis, hence the full shift is also used to estimate the systematic uncertainty. Figure 1 shows the photon identification efficiency for isolated photons in the fiducial region of the analysis selection (as defined below) as a function of their transverse momentum. The identification efficiency for converted (unconverted) photons typically ranges from 90% to 98% (from 85% to 95%) for transverse energies between 25 and 200 GeV, with optimized requirements for the 2015 data sample.
[GeV]
γ
E
T20 40 60 80 100 120 140 160 180 200
Photon identification efficiency
0.84 0.86 0.88 0.9 0.92 0.94 0.96 0.98 1
Converted Unconverted ATLAS Simulation Preliminary
=13 TeV s
= 125 GeV, (ggF), m
Hγ γ H →
γ
E
T< 0.05 ×
track T,iso γ
, E E
T< 0.065 ×
calo T,iso
E
Figure 1: Photon identification e ffi ciency as a function of transverse energy for converted (red circles) and uncon- verted (blue squares) photons in the fiducial region of the analysis selection, determined with photons from Higgs boson decays in the ggF signal sample.
To further increase the background rejection, selection cuts on two complementary isolation variables are applied. The first variable is the sum of the transverse energies of positive-energy topological clusters [57]
deposited in the calorimeter within a cone of ∆ R ≡ p
( ∆ η)
2+ ( ∆ φ)
2around each photon. The energy sum
excludes the contribution due to the photon cluster and an estimate of the energy deposited by the photon
outside its associated cluster. To reduce the effect from the underlying event and pileup, the isolation is
further corrected using a method suggested in Ref. [58]. For each of the two di ff erent pseudorapidity
regions |η| < 1.5 and 1.5 < |η| < 3.0, low-energy jets are used to compute an ambient energy density,
which is then multiplied by the area of the isolation cone and subtracted from the isolation energy. To improve the efficiency of the isolation selection for events with large pileup, the calorimetric isolation is complemented by a track isolation defined as the scalar sum of the transverse momenta of all tracks with p
T> 1 GeV within a cone of size ∆ R = 0.2 around each photon. The pileup dependence on the track isolation efficiency is reduced by selecting only tracks consistent with originating from the diphoton production vertex (defined in Section 4.2) and not associated with converted photon candidates.
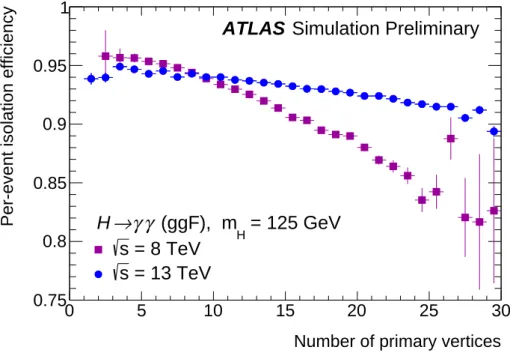
In the 8 TeV (7 TeV) samples, photon candidates are considered as isolated with a calorimeter isolation lower than 6 (5.5) GeV and a track-isolation lower than 2.6 (2.2) GeV. The cone size to measure the calorimeter isolation is ∆ R = 0.4. For the 13 TeV measurement, several changes have been introduced to the isolation requirement, achieving further pileup robustness. Compared to Run-1, the relative tightness of the track isolation cut is increased. The cone size of the calorimeter isolation is reduced to ∆ R = 0.2, which also helps to reduce ine ffi ciencies in busy environments, such as in t¯ tH production. Contrary to the absolute isolation cuts in Run-1, the cuts are now a function of the photon transverse momentum (E
Tγ).
The calorimeter isolation is required to be less than 0.065 × E
Tγand the track isolation is required to be less than 0.05 × E
Tγ. Figure 2 shows the isolation e ffi ciencies as a function of the average number of interactions per bunch crossing.
Number of primary vertices
0 5 10 15 20 25 30
Per-event isolation efficiency
0.75 0.8 0.85 0.9 0.95 1
Simulation Preliminary ATLAS
= 125 GeV (ggF), m
Hγ γ
→ H
= 8 TeV s
= 13 TeV s
Figure 2: E ffi ciency for both photons to fulfill the isolation requirement as a function of the number of primary vertices in each event, determined with a MC sample of Higgs bosons decaying into two photons with m
H= 125 GeV. Events are required to satisfy the kinematic selection described in Section 4.2 for the 8 TeV (violet squares) and 13 TeV (blue circles) dataset.
4.2 Event selection
The cross-section measurement is based on the extraction of the resonant signal in the inclusive dipho-
ton invariant-mass spectrum. At least two photon candidates, satisfying loose identification criteria, are
required to be in a fiducial region of the EM calorimeter defined by |η
γ| < 2.37, excluding the transition
Number of Primary Vertices
0 5 10 15 20 25
PV
ε
0 0.2 0.4 0.6 0.8 1
Preliminary ATLAS
= 13 TeV, 3.2 fb
-1s
ee, ignoring lepton tracks
→ Data Z
ee, ignoring lepton tracks
→ MC Z
=125 GeV (ggF), mH
γ γ
→ MC H
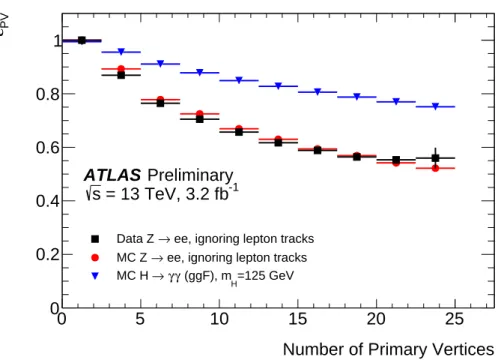
Figure 3: Efficiency
PVto select a diphoton vertex within 0.3 mm of the production vertex as a function of the number of primary vertices in the event in the 2015 dataset. The plot shows
PVfor Z → ee events with the electron tracks removed for the neural network-based identification of the vertex, both in data (black squares) and simulation (red circles).
PVis also shown for simulated ggF events (m
H= 125 GeV) (blue triangles), including the events with converted photons.
region between the barrel and the end-cap calorimeters (1.37 < |η
γ| < 1.52). In the Run-1 analyses, the upper cut is tighter at |η
γ| < 1.56, in order to exclude also a calorimeter region (1.52 < |η| < 1.56) with a poorer resolution. Photon candidates in this fiducial region are ordered according to their E
γTand only the first two are considered: the leading and sub-leading photon candidates are required to fulfill the tight identification and isolation criteria, and they are required to have E
γT/m
γγ> 0.35 and 0.25, respectively, for which m
γγis the invariant-mass of the two selected photons. The typical signal selection efficiency with respect to the full phase space ranges between 37% (for events from gluon-fusion production) and 31% (for events from ZH production) and is nearly identical in Run-1 and Run-2. An exception is t¯ tH production, where the efficiency increased from 30% in Run-1 to 38% in Run-2, mainly due to the new isolation definition.
For the diphoton invariant-mass calculation and the track-based isolation computation, a precise knowl- edge of the position of the diphoton production vertex is required. The diphoton production vertex is selected from the reconstructed collision vertices using a neural network algorithm, which was separately trained for Run-1 and Run-2 conditions. For each vertex the algorithm takes the following as input: the combined z-position of the intersections of the extrapolated photon trajectories with the beam axis; the sum of the squared transverse momenta P
p
2Tand the scalar sum of the transverse momenta P
p
Tof the
tracks associated with the vertex; the di ff erence in azimuthal angle ∆ φ between the direction defined by
the vector sum of the track momenta and that of the diphoton system. The trajectory of each photon is
measured using the longitudinal segmentation of the calorimeter and a constraint from the average col-
lision point of the proton beams. For converted photons, the position of the conversion vertex is also
used if tracks from the conversion have hits in the silicon detectors. The use of the photon trajectories
[GeV]
γ
m
γ105 110 115 120 125 130 135 140
Arbitrary Units
0 0.02 0.04 0.06 0.08 0.1
0.12
ATLAS Simulation Preliminary= 13 TeV s = 125 GeV, , mH
γ γ
→ H
Simulation Model = 1.68 GeV
σ68%
= 3.77 GeV σ95%
Figure 4: Distribution of the reconstructed diphoton invariant mass of a simulated Higgs boson signal generated with a mass of 125 GeV from the 13 TeV sample, after event selection. The line shows the fit of the distribution using the function described in the text.
ensures that the diphoton invariant mass resolution is dominated by the intrinsic calorimeter resolution, while the impact from the vertex determination is negligible. The production vertex selection is studied with Z → ee events in data and simulation by removing the electron tracks from the events. The result of these studies is illustrated in Fig. 3, which shows the e ffi ciency to select a diphoton vertex within 0.3 mm of the production vertex in the above discussed configurations as a function of the number of primary vertices in the event. The MC simulation is found to accurately describe the efficiency measured in data.
The integrated e ffi ciency to locate the diphoton vertex within 0.3 mm of the production vertex for SM ggF production in the 2015 sample is 87%.
A total of 17225, 94566 and 29432 collision events are selected with a diphoton invariant mass between 105 GeV and 160 GeV in the 7, 8 and 13 TeV samples, respectively.
5 Extraction of the signal yield
5.1 Signal model
Figure 4 shows the invariant mass distribution for simulated SM Higgs boson events with m
H= 125 GeV
for the 13 TeV selection. The mass resolution of the signal is modeled by the sum of a Crystal Ball
function (for the bulk of the events which have a narrow Gaussian spectrum in the peak region and tails
toward lower reconstructed mass) and a Gaussian distribution with a wide sigma (to model the far outliers
in the distribution). The non-Gaussian contributions to the mass resolution arise mostly from converted
photons with at least one electron losing a significant fraction of its energy through bremsstrahlung in the
inner detector material. For the 13 TeV sample, the e ff ective signal mass resolution parameters for a SM Higgs boson mass of m
H= 125 GeV, σ
68%and σ
95%, defined as half of the smallest range containing 68% and 95% of the signal events, amount to 1.68 GeV and 3.77 GeV, respectively. The invariant mass resolution for the SM Higgs boson signal in the 7 and 8 TeV samples is given in Ref. [55].
Signal MC events were generated at step sizes of 5 GeV in m
Hfrom 115 GeV to 135 GeV. The fit param- eters can be extrapolated to arbitrary masses using a simultaneous fit to all the discrete m
Hdistributions.
The procedure is validated by excluding generated samples with a given m
Hone at a time and comparing the extrapolated model to the generated distribution.
5.2 Background composition
The main background to this measurement is the SM continuum diphoton production. Photon-jet produc- tion and dijet production are also sizable backgrounds since jets fragmenting into energetic π
0s can fake photons. Finally, a small fraction of the total background (< 1%) comes from Drell-Yan events, in which both electrons are misidentified as photons. Although the final result does not rely on it, a quantitative understanding of the sample composition is an important cross-check of the diphoton selection procedure.
The number of γγ, γ–jet and jet–jet events in the selected diphoton event sample is estimated by means of a double two-dimensional sideband method, which is a generalization of the method used in Ref. [59].
Without constraining to the total number of events, the event fractions are fitted to the distribution of the number of events in two bins of loose and tight photon identification criteria times two bins of loose and tight photon isolation criteria, for each of the two photon candidates per event. The method relies on the near independence between these two variables for the jet background and that the sidebands (the regions where either the photon identification or isolation requirement is loose) are essentially populated by jets. The small signal contamination in the control regions is estimated using the MC simulation and is subtracted.
The rate of events where at least one of the two photons is fake in the Run-2 measurement is very similar to the previous analyses with Run-1 data [60]. The number of diphoton events in the 105-160 GeV mass range is found to be 23510 ± 210 (stat.)
+−1030220(syst.). The systematic uncertainty arises from the definition of the relaxed identification control region, the possible correlations between isolation and identification variables, and the fraction of real photons leaking into the background control regions. The extracted yields of photon-jet and dijet events are 5850 ± 130 (stat.)
+950−190(syst.) and 740 ± 30 (stat.)
+90−140(syst.) events, respectively.
Figure 5 shows the extracted diphoton, photon-jet and dijet components as a function of m
γγ. The purity of the sample (fraction of diphoton events) is 78 ± 3 %, integrated over the 105-160 GeV mass range.
5.3 Background model
The total background contribution is estimated directly from data by fitting the steeply falling m
γγdis-
tribution to an analytical function. The parameterization for the background model is chosen with the
help of templates built from fast simulation samples. The distributions of m
γγfrom these templates are
fitted in the same range as the data with a signal plus a background model. Since no signal is present
in those background-only samples, the resulting number of signal events from the fit N
sp(m
H) is taken
as an estimate of the bias in a particular background model under test. For such a bias to be considered
acceptable, N
sp(m
H) has to be smaller than 10% of the expected signal rate or smaller than 20% of the
[GeV]
γ
mγ
110 120 130 140 150 160
Events / GeV
0 500 1000
ATLAS Preliminary = 13 TeV, 3.2 fb-1
s γ γ γ-jet jet-jet stat. total
[GeV]
γ
mγ
110 120 130 140 150 160
Fraction [%]
0 20 40 60 80 100
ATLAS Preliminary s = 13 TeV, 3.2 fb-1
γ γ γ-jet jet-jet stat. total
Figure 5: Main background contributions to the diphoton invariant mass distribution, as obtained from a data-driven method. The various components are stacked on top of each other in the left plot, while the plot on the right shows their fractional contribution. The error bars correspond to the uncertainties on each component separately. The γγ component also includes a small e
+e
−contribution from the Drell-Yan process. The error bars on each point represent the statistical uncertainty on the measurement while the colored bands represent the total uncertainty.
statistical uncertainty on the number of background events in the fitted signal peak σ
bkgd(m
H), for all m
Hin the mass range 117 - 133 GeV [3]. The largest N
sp(m
H) in this mass range is taken as the systematic uncertainty of the background model.
The background templates for the Run-1 measurements are built from γγ, γ–jet (S herpa ) and jet–jet (Pythia8) samples with the detector response simulated using the simplified models, as described in Section 3. In the Run-2 measurement, the impact of the γ–jet and jet–jet components is estimated by reweighting the γγ sample according to the result of the data-driven background measurement described in Section 5.2. It is found that an exponential of a second order polynomial fulfills the above require- ments on the functional form. Compared to the Run-1 fit range of 105–160 GeV, restricting the range to 110–160 GeV reduces the systematic uncertainty on the background model by 15%. There is no loss in expected sensitivity due to this choice of lower bound.
5.4 Signal extraction
The signal is extracted using the approach adopted in previous ATLAS measurements of H → γγ [1]. An unbinned maximum likelihood fit is performed on the m
γγspectrum in the fiducial region of each dataset separately. The likelihood function, L, is given by
L(m
γγ; N
S, N
bkg, m
H) = e
−Nn!
n
Y
j
h N
SS(m
γγj; m
H) + N
bkgB(m
γγj) i
× Y
k
G
k(1)
where N
Sis the fitted number of signal events, N
bkgis the fitted number of background events, N = N
S+
N
bkgis the mean value of the underlying Poisson distribution for the n events, m
γγjis the diphoton invariant
mass for event j, S(m
γγj; m
H) and B(m
γγj) are the signal and background probability distribution functions
(as defined in Section 5.3 and 5.1, respectively), and the G
kincorporate unit Gaussian constraints from
uncertainties on the photon energy scale and resolution, as well as the uncertainty in the fitted peak
position from the chosen background parameterization. Other uncertainties that do not affect the shape
[GeV]
γ
mγ
110 115 120 125 130 135 140 145 150 155 160
Events / 2 GeV
200 400 600 800 1000 1200 1400 1600 1800
data fit b s +
b background,
γ
→ γ
→ H pp
= 13 TeV, 3.2 fb
-1s
= 125.09 GeV m
HPreliminary ATLAS
[GeV]
γ
m γ
110 115 120 125 130 135 140 145 150 155 160
data - b
− 100 0 100
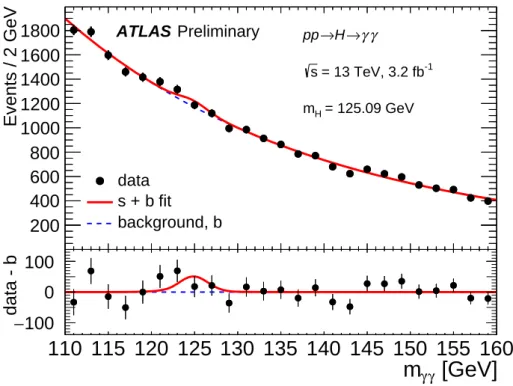
Figure 6: Diphoton invariant-mass m
γγspectrum observed in the 13 TeV data. The solid red curve shows the fitted signal plus background model when the Higgs boson mass is fixed at 125.09 GeV. The background component of the fit is shown with the dotted blue curve. The bottom plot shows the residual of the background-subtracted data.
of the m
γγspectrum are not included in the fit and are dealt with as part of the correction for detector effects.
Figure 6 shows the result of the signal-plus-background fit to the diphoton invariant-mass distribution in the 13 TeV sample for m
H= 125.09 GeV. The expected SM signal-to-background ratio in a mass window around m
H= 125.09 GeV containing 90% of the signal is 4.2%. The expected (N
exp) and extracted (N
S) signal yields are:
N
exp= 143 ± 71 (stat.)
+−639(syst.) N
S= 113 ± 74 (stat.)
+43−25(syst.) .
The uncertainty on the expected signal yield arises from the uncertainty of the fit procedure, assuming that the data has the SM Higgs boson signal rate. Under the asymptotic approximation [61], the observed (expected) significance above the no-signal hypothesis is 1.5 σ (1.9 σ). A detailed discussion of the obtained systematic uncertainties is given in Section 7.
6 Correction for detector e ff ects
The fiducial cross section, σ
fid, is defined by
σ
fid= N
SC L
int, (2)
where N
Sis the extracted signal yield, L
intis the integrated luminosity, and C is a correction factor accounting for detector resolution and efficiency. This correction is derived from simulated Higgs boson samples, and is defined as the ratio of the expected number of detector-level events passing the analysis selection (see Section 4) to the number of generated particle-level events in the fiducial volume. The particle level is defined using all stable generated particles, which are required to have a mean lifetime cτ > 10 mm [12]. Similarly, the total cross section, σ
tot, is defined by
σ
tot= N
SL
intB A C = σ
fidB A (3)
where A is the acceptance and B is the branching ratio, both described in detail in section 9.
The fiducial volume is defined with similar selection criteria as the detector level to minimize model dependence. The two highest E
γTphotons are taken as the Higgs boson candidate, and are required to be within |η
γ| < 2.37. Additionally, the leading (sub-leading) photon must satisfy E
γT/m
γγ< 0.35 (0.25).
The events are also required to have m
γγin the range 105–160 GeV to be consistent with the 7 and 8 TeV analyses. Using a consistent mass window as that used during signal extraction, 110 GeV < m
γγ<
160 GeV, is found to have a negligible e ff ect on the correction factor, and is neglected. Furthermore, the transverse energy, E
T,iso, of the vector sum over particles within a cone of ∆ R = 0.2 around each photon, excluding muons and neutrinos, must be less than 0.1 × E
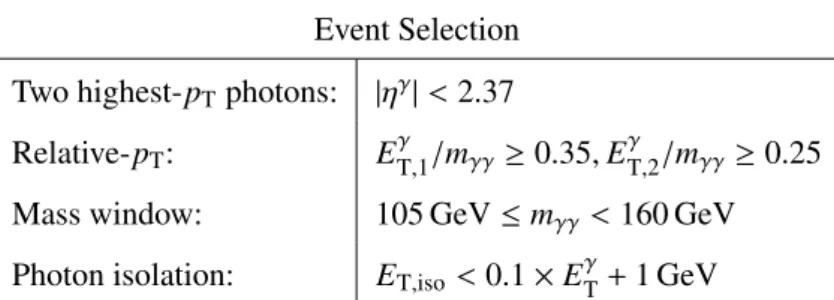
γT+ 1 GeV. This isolation requirement reduces model dependence between di ff erent production modes, and is determined using simulated Higgs boson samples to compare the track isolation momentum to the particle-level isolation on an event-by-event basis. A summary of the fiducial volume is given in Table 1.
Event Selection Two highest- p
Tphotons: |η
γ| < 2.37
Relative- p
T: E
γT,1/m
γγ≥ 0.35, E
T,2γ/m
γγ≥ 0.25 Mass window: 105 GeV ≤ m
γγ< 160 GeV Photon isolation: E
T,iso< 0.1 × E
Tγ+ 1 GeV
Table 1: Summary of the particle-level fiducial definition. Only stable photons with a mean lifetime cτ > 10 mm are considered.
A small contribution from the Dalitz decay H → f f ¯ γ is expected after the event selection, primarily from H → e
+e
−γ events. These events have a reconstructed m
γγdistribution similar to that of the H → γγ signal, and are subtracted as part of the correction procedure. The resulting correction is ≈ 0.3%.
The correction factor is determined to be 0.677 ± 0.033, where the uncertainty is described in section 7.2.
The deviation of the correction factor from unity is dominated by the photon reconstruction, identification, and isolation e ffi ciencies. The rejection of photons falling in the barrel–endcap transition region (1.37 <
|η
γ| < 1.52) at detector level results in an 11% e ffi ciency loss and is included in the correction to particle
level.
7 Systematic uncertainties
The uncertainties of the fiducial cross-section measurement are grouped by either their effect on the signal extraction or their e ff ect on the correction factor. Both contributions are discussed in the following two subsections.
7.1 Uncertainties in the signal extraction
The impact of the photon energy scale and energy resolution, as well as the position of the signal peak due to background modeling, are included as nuisance parameters in the signal extraction fit, as described in Section 5.4. The initial calibration factors are extracted from 8 TeV Z → ee decays [54], hence additional systematic uncertainties on the energy scale and resolution are introduced to cover the di ff erent conditions between 2012 and 2015 data taking periods. The increase in photon energy scale uncertainty includes a significant contribution from the uncertainty in the correction of the calorimeter response due to a change in the LAr temperature between 2012 and 2015, as well as terms to cover the updated object reconstruction procedure and detector geometry. The uncertainty in the photon energy scale results in an asymmetric uncertainty of
+0.42−0.45% on the mean of the Crystal Ball function used in the signal model. For the photon energy resolution, the smearing corrections extracted from Z → ee events are assigned an additional uncertainty based on a comparison of simulated Z → ee samples in the 8 and 13 TeV simulation setup, which differ in particular by the addition of the IBL for 13 TeV. This results in an asymmetric uncertainty of
+−1333% on the width of the Crystal Ball function used in the signal model. The uncertainty on the signal position due to the choice of background function is derived by fitting simulated signal and background samples with the chosen signal and background functions.
A log-likelihood scan of the extracted signal yield from the diphoton mass distribution in data is per- formed twice: first allowing all nuisance parameters to float; then fixing all nuisance parameters to their profiled values, defining the statistical uncertainty. The systematic uncertainty component is obtained by subtracting the total and statistical uncertainty in quadrature. The result of this log-likelihood scan using data is shown in Figure 7, where −2 ln Λ is the profile likelihood [61]. As described in Section 5.4, the signal extraction fit only includes nuisance parameters for the uncertainty on the photon energy resolu- tion, photon energy scale, and peak position due to the choice of the background function. The profiled value of the photon energy scale (resolution) nuisance parameter is shifted by −36% ( + 23%) relative to its nominal uncertainty. These so-called pulls are not significant due to the large statistical uncertainty, which provides a smaller penalty on the likelihood than the systematic uncertainties in the signal extraction fit.
The uncertainty on the signal yield due to the choice of background function is taken to be 2.7 events/fb,
derived using the method described in Section 5.3. There is also an uncertainty on the signal yield
because the chosen signal function does not exactly describe the simulated shape of the Higgs boson
signal peak. To quantify this, a fit is performed on the simulation after shifting (smearing) the photons
by their energy scale (resolution) uncertainty. The envelope around the nominal extracted signal yield
provided by shifting and smearing the simulation is included as an additional uncertainty. Finally, the
uncertainty due to the contribution from Dalitz events is determined by assuming a 100% uncertainty
on the cross section, which affects the subtraction of these events during the correction procedure. A
summary of these sources of uncertainty and their sum in quadrature is shown in Table 2.
N
S− 50 0 50 100 150 200 250 300
Λ -2ln
0 1 2 3 4 5 6 7 8
Syst.
⊕ Stat.
Stat.
Preliminary ATLAS
γ γ
→
→ H pp
= 13 TeV, 3.2 fb
-1s
= 125.09 GeV m
HFigure 7: The profile likelihood, −2 ln Λ , shown as a function of the extracted number of signal events, N
S. The black “Stat. + Syst." line corresponds to allowing all nuisance parameters to float, while the dotted red “Stat." line corresponds to fixing the nuisance parameters at their profiled value. The dotted black (gray) line represents the one (two) σ uncertainty. Only systematic uncertainties a ff ecting the signal extraction are considered here.
Component Uncertainty [%]
Total fit
+−6976Fit: statistical ±66
Fit: systematic
+−2238Background modeling ±7.7
Signal modeling ±1.5
Dalitz contribution ±0.3
Total
+76−70Table 2: Summary of the uncertainties a ff ecting the signal extraction in the 13 TeV analysis, and their sum in quadrature, as described in the text.
7.2 Uncertainties in the correction factor
The correction factor is affected by the photon energy scale and energy resolution uncertainties through
migrations of reconstructed events into and out of the defined fiducial volume. Uncertainties in the trigger,
photon identification, and photon isolation efficiencies also change the number of reconstructed events by
a uniform shift of the normalization. The isolation uncertainty is affected by both the charged-particle
track and calorimeter requirements. Due to imperfect modeling of the charged-particle track isolation momentum of photons in MC simulation, a data-driven shape correction is applied. The difference be- tween the isolation e ffi ciency of photons in MC simulation with and without this shape correction is taken as an uncertainty, resulting in a shift of the correction factor. Similarly, a data-driven shift is applied to the calorimeter isolation energy of photons in MC simulation when deriving the correction factor, and the di ff erence from the nominal correction factor is taken as an uncertainty. The sum in quadrature of the calorimeter and charged-particle track components results in an uncertainty of ±4.0%. The uncertainty in the photon identification efficiency is determined by comparing the efficiency derived after applying cor- rections to the calorimeter shower shapes, to the e ffi ciency derived before these corrections. The trigger uncertainty is estimated by comparing the e ffi ciency of the trigger selection in the MC simulation and the efficiency observed in data as a function of E
γT. The absolute difference between these two measurements is taken as the uncertainty. The uncertainty due to selecting the incorrect diphoton vertex, which is used to correct E
γT, is found to be negligible.
Uncertainties in the correction factor due to the theoretical modeling are estimated in two ways. First, the correction factor is derived using a sample with multiple-parton-interactions (MPI) turned o ff , which provides a conservative +1.4% uncertainty in the modeling of the underlying event. Second, the relative fraction of each production mode is varied within its uncertainties, and the correction factor is rederived for each case. The contribution from VBF and V H production modes is varied by a factor of two, both up and down, and the t¯ tH component is varied by a factor of five as well as by removing its contribution en- tirely. Although these values result in a conservative −0.1% uncertainty, they are chosen to be consistent with the uncertainty used by the 8 TeV measurement [62]. The envelope of these two uncertainty com- ponents is averaged and taken as the theoretical modeling uncertainty. Uncertainties on the Higgs boson rapidity and transverse momentum distributions have not been explicitly evaluated, but are not expected to a ff ect the present uncertainty estimate in a significant way.
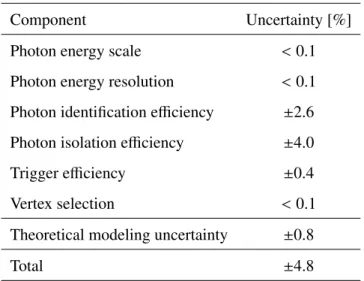
The experimental and theoretical uncertainties in the correction factor are treated as uncorrelated, and added in quadrature. A summary of the uncertainties in the correction factor is given in Table 3.
Component Uncertainty [%]
Photon energy scale < 0.1
Photon energy resolution < 0.1 Photon identification e ffi ciency ±2.6 Photon isolation efficiency ±4.0
Trigger e ffi ciency ±0.4
Vertex selection < 0.1
Theoretical modeling uncertainty ±0.8
Total ±4.8
Table 3: Summary of the uncertainties a ff ecting the correction factor for the 13 TeV analysis, divided into experi-
mental and theoretical components.
7.3 Summary of uncertainties
The measurement of the integrated luminosity includes an uncertainty of 5.0%. It is derived, following a methodology similar to that detailed in Ref. [63], from a preliminary calibration of the luminosity scale using a mini van der Meer scan performed in June 2015. Because the uncertainties in the correction factor due to photon energy scale and resolution are negligible, these components are treated as uncorrelated between the signal extraction and the correction factor. This results in a total uncertainty on the measured fiducial cross section of
+77−70% = ± 66 (stat.)
+39−24(syst.) ± 5 (lumi.)%.
8 Updated signal extraction and fiducial definition for Run-1 measurements
The Higgs boson signal strength has already been measured by ATLAS at √
s = 7 and 8 TeV [62], with fiducial cross sections published for the latter [7]. To make a direct comparison with the result at 13 TeV presented in this note, the signal extraction for both measurements has been updated to assume m
H= 125.09 GeV. The same fiducial region as defined in Section 6 for the 13 TeV measurement is also used for the updated 7 and 8 TeV measurements. Correction factors for the 7 TeV result have been computed, as well as an additional correction for the published 8 TeV results to account for the di ff erence in particle-level isolation used in the published and current analyses. For both these measurements, the mass window is defined from 105 to 160 GeV, a slightly larger range than the 110–160 GeV used for the 13 TeV signal extraction. The changes specific to each center-of-mass energy are described in the following two subsections.
8.1 7 TeV correction factors and uncertainties The signal is extracted from data at √
s = 7 TeV using the same procedure described in Ref. [62]. The sample is used inclusively instead of separating it into categories optimized for the coupling extraction, while the event selection and signal extraction procedure remain the same. Assuming m
H= 125.09 GeV, the extracted yield is 148 ± 51 (stat.) ± 10 (syst.) events.
The correction factor is derived using the detector-level selection defined in Ref. [62]; however, the particle-level fiducial volume is defined in the same way as described in Section 6. This results in a correction factor of 0.67, which extrapolates from an isolation cone of ∆ R = 0.4 at detector level to an isolation cone of ∆ R = 0.2 at the particle level. A total uncertainty on the correction factor of ±8.8%
is derived using the same method described in Section 7.2, and is dominated by the ±8.4% uncertainty on the photon identification e ffi ciency. The resulting fiducial cross section measured at √
s = 7 TeV is 49 ± 17 (stat.) ± 6 (syst.) ± 1 (lumi.) fb.
8.2 Updated 8 TeV correction factors and uncertainties
The signal extraction, as well as correction and acceptance factors, at √
s = 8 TeV are presented in
Ref. [7]. The use of the updated value of m
H= 125.09 GeV results in an extracted yield of 550 ± 130 events,
compared to 570 ± 130 events when assuming m
H= 125.4 GeV.
There are two di ff erences in the particle-level fiducial definition between the published 8 TeV and the cur- rent 13 TeV measurement: i) the two photon candidates are now defined before the E
Tγand |η
γ| selection, instead of afterwards, and ii) the particle-level isolation. For the published result, the particle-level isola- tion was defined within ∆ R = 0.4 and required to be less than 14 GeV. The updated fiducial region defines the particle-level isolation within ∆ R = 0.2, and is further required to be less than 0.1 × E
γT+ 1 GeV. The resulting correction factor using the updated fiducial definition is 0.64, a change of −1.0% relative to the previous value of 0.65.
The uncertainties are re-evaluated to check for significant differences due to the extrapolation between an isolation cone of ∆ R = 0.4 and ∆ R = 0.2, estimated using the correction factor. The relative theoretical uncertainties in the correction factor detailed in Ref. [7] are found to increase from
+3.3−1.0% to
+3.3−1.4%. The resulting fiducial cross section at √
s = 8 TeV, using the updated fiducial definition and m
Hvalue, is 42.5 ± 9.8 (stat.)
+−2.72.9(syst.) ± 1.2 (lumi.) fb.
9 Theoretical predictions
The measurements are compared to a Standard Model prediction of the Higgs boson production cross section by the LHC Higgs cross section working group [48], referred to as LHC-XS in this note. The ggF prediction is accurate to NNLO + NNLL in QCD with NLO electroweak corrections included. The VBF, W H and ZH calculations are all accurate to NNLO in QCD with NLO electroweak corrections applied. Finally, the t¯ tH production mode is accurate to NLO in QCD, and the b bH ¯ production mode is accurate to NNLO (NLO) in QCD for the five-flavor (four-flavor) scheme. The branching ratio for H → γγ is taken to be 0.228 ± 0.011 %, following the recommendations of Ref. [48], as well as a value of m
H= 125.09 GeV. The SM is assumed for all production-mode cross sections, all values of A, and the branching ratio calculation used for comparison to the measurements in this analysis.
All predictions include uncertainties for the renormalization and factorization scales; the theory prediction for ggF includes an additional uncertainty in the resummation scale. Variations of the PDFs and the strong coupling (α
S) are also considered as additional sources of uncertainty.
The fiducial acceptance factor is derived for each production mode, defined as the fraction of particle-level events that fulfill the fiducial requirements in Table 1. These values are determined using events gener- ated by P owheg+ P ythia 8 interfaced with the CT14 PDF set for the ggF and VBF production modes, and events generated by the AU2 tune of Pythia8 for the W H, ZH and t¯ tH production modes. The fiducial acceptance factors are assigned uncertainties due to the PDFs, QCD scale effects, and soft QCD effects.
QCD scale variations are found to have a negligible impact on A relative to that from PDF variations.
PDF uncertainties in the ggF and VBF portions of the prediction are assigned using the CT14 eigen- vector variations. The envelope of the difference between the predictions using the CT14, NNPDF3.0 and MMHT2014 PDF sets is taken as an additional, uncorrelated uncertainty contribution. Uncertainties due to the modeling of soft QCD effects are estimated using ggF events simulated with multiple tunes.
The leading-order generator tunes considered are AU2 (P ythia 8), UE-EE-4-LO (H erwig++ [64, 65]) as well as AUET2B-CTEQ6L1, AMBT2-LO, AMBT-CTEQ6L1 [66], Perugia2011C, and Perugia2012 [67]
(Pythia6 [68]). The prediction using the AU2 tune of Pythia8 is taken as the central value, and the en-
velope provided by the other tunes is defined as the systematic uncertainty. The total uncertainty in the
theory prediction is the sum in quadrature of all individual uncertainty components, including those in
the absolute theory prediction and A .
For the measurement using 8 TeV data, the published value A = 0.604 ± 0.012 is used along with the 1.0% shift of the 8 TeV correction factor resulting from the updated fiducial definition. Due to the small magnitude of the correction, the relative uncertainties in A are found to be unchanged from those pre- sented in Ref. [7]. A summary of A is given in Table 4 for √
s = 7, 8 and 13 TeV. Since the Higgs rapidity spectrum is broader for larger √
s values, a larger fraction of events with forward photons falls outside of the fiducial region, causing a decrease in A. While the 8 TeV value from Ref. [7] was derived using the CT10 PDF set, A for √
s = 7 and 13 TeV is calculated using the CT14 PDF set, resulting in smaller PDF uncertainties.
√ s A
7 TeV 0.620 ± 0.007 8 TeV 0.611 ± 0.012 13 TeV 0.570 ± 0.006 Table 4: Summary of acceptance A at √
s = 7, 8 and 13 TeV. The 8 TeV measurement includes an additional correction to the previously published value, to account for the di ff erence in fiducial definition between the current and published results. While the 8 TeV value from Ref. [7] was derived using the CT10 PDF set, A for √
s = 7 and 13 TeV is calculated using the CT14 PDF set, resulting in smaller PDF uncertainties.
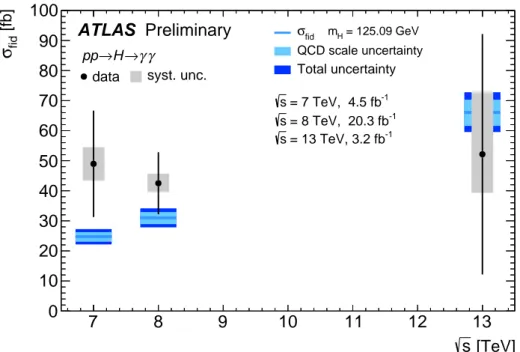
10 Fiducial cross-section measurements
The measured fiducial cross sections at √
s = 7, 8 and 13 TeV, along with the LHC-XS predictions, are presented in Table 5. The results are also plotted in Figure 8, and again compared with the LHC-XS predictions as a function of √
s. Both the measured fiducial cross sections and theoretical predictions assume m
H= 125.09 GeV. No significant deviations from the SM predictions are seen within the quoted uncertainties, which are dominated by the statistical component.
√ s Measured fiducial cross section [fb] LHC-XS prediction [fb]
7 TeV 49 ± 17 (stat.) ± 6 (syst.) ± 1 (lumi.) 24.7 ± 2.6 8 TeV 42.5 ± 9.8 (stat.)
+−2.72.9(syst.) ± 1.2 (lumi.) 31.0 ± 3.2 13 TeV 52 ± 34 (stat.)
+−2113(syst.) ± 3 (lumi.) 66.1
+−6.66.8Table 5: Measured fiducial cross sections, LHC-XS predictions, and their uncertainties for √
s = 7, 8 and 13 TeV.
All values assume m
H= 125.09 GeV and the fiducial volume defined in Section 6.
The total Higgs boson cross section is measured by dividing the fiducial cross sections by the acceptance
factors presented in Section 9, and by the H → γγ branching ratio. The results are shown in Table 6,
along with the LHC-XS predictions and their uncertainties. Since the observed significance of the 13 TeV
result is below 3 σ, an observed (expected) 95% confidence-level upper limit on the total cross section of
106 pb (112 pb) is set under the asymptotic approximation.
[TeV]
s
7 8 9 10 11 12 13
[fb]
fidσ
0 10 20 30 40 50 60 70 80 90 100
ATLAS Preliminary
mH = 125.09 GeV σfidQCD scale uncertainty Total uncertainty
γ
γ
→
→ H pp
data syst. unc.
= 7 TeV, 4.5 fb-1
s
= 8 TeV, 20.3 fb-1
s
= 13 TeV, 3.2 fb-1
s