ATLAS-CONF-2012-122 17August2012
ATLAS NOTE
ATLAS-CONF-2012-122
August 16, 2012
Performance of the ATLAS Minimum Bias and Forward Detector Triggers in 2011 Heavy Ion Run
The ATLAS Collaboration
Abstract
This note describes the performance of the ATLAS minimum bias and forward detector triggers during the 2011 LHC Heavy Ion run. The efficiency, purity, and rate of triggers using a wide variety of ATLAS subdetectors are presented. As an application, we show the luminosity stability measurements during LHC Heavy Ion fills using the number of events passing minimum bias triggers and compare the event counts in subranges of individual LHC fills.
c
Copyright 2012 CERN for the benefit of the ATLAS Collaboration.
Reproduction of this article or parts of it is allowed as specified in the CC-BY-3.0 license.
1 Introduction
The ATLAS Heavy Ion (HI) physics program is of broad scope and aims to investigate the properties of the hot, dense matter created in ion collisions at the LHC. The collisions of Pb+Pb nuclei are significantly different from the p
+p interactions for which the ATLAS trigger system was designed. Depending on the impact parameter (the distance of closest approach between the colliding nuclei) the overlap of colliding nuclei varies significantly. For the central collisions (small impact parameter), almost all nucleons interact and the multiplicity of particles produced is many times larger than in a single p
+p collision. For peripheral collisions (large impact parameter) the overlap region is elliptical or almond like in shape. Fewer constituent nucleons of the ions interact and the resultant multiplicity of particles produced on the detector is correspondingly reduced. In ATLAS, the magnitude of the impact parameter, and hence the centrality of the collision, is quantified using the total transverse energy,
ΣE
T, measured in the Forward Calorimeters (FCal) which cover the pseudorapidity
1range 3.1
<|η|<4.9. The inclusive minimum bias event sample can be divided into centrality classifications according to the measured FCal
ΣE
Tvalues as shown in Figure 1 based on the 2010 data [1]. The higher the FCal
ΣE
Tvalue, the more central collision is. In 2011 the FCal
ΣE
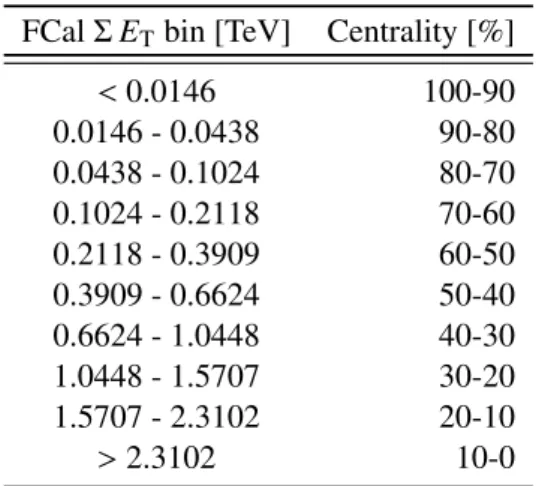
Tcalibration has been adjusted by 4.1% which results in new centrality values defined in Table 1.
Figure 1: Measured FCal
ΣE
Tdistribution divided into 10% centrality intervals as extracted from the 2010 data sample [1].
In the HI collisions, the nucleons which do not interact (especially from outside of the elliptical overlap area) are known as spectator nucleons. The Zero Degree Calorimeter (ZDC) is designed to detect free spectator neutrons which follow a straight trajectory after the Pb+Pb collisions. The charged remnants of the beam (spectators protons, nuclei fragments, and the unaffected Pb nuclei) are bent by the magnetic field which guide the beams and have a low probability of impacting the ZDC. Spectator nucleons are not always released as single particles, according to the measurements of Pb fragmentation in Pb+Pb collisions at 158 GeV/nucleon [2], in 5.6% of events (the most central collisions) there are only singly charged spectators. In other events, large fraction of spectators are bound in multicharged fragments (Z
>1). The sum of the charges in these fragments has an almost flat distribution with its
1In the ATLAS coordinate system, thez-axis points in the direction of the anti-clockwise beam viewed from above. Polar anglesθand transverse momenta pT are measured with respect to this axis. The pseudorapidityη=−ln tan(θ/2) is a good approximation to the rapidity of a particle whose mass is negligible compared with its energy and is used here, relative to the nominalz=0 point at the centre of the apparatus, to describe regions of the detector. The hemisphere at positive pseudorapidity is denoted the A side while the hemisphere at negative pseudorapidity is denoted the C side of the detector. Natural units are assumed such thatc=~=1.
FCal
ΣE
Tbin [TeV] Centrality [%]
<
0.0146 100-90
0.0146 - 0.0438 90-80
0.0438 - 0.1024 80-70
0.1024 - 0.2118 70-60
0.2118 - 0.3909 60-50
0.3909 - 0.6624 50-40
0.6624 - 1.0448 40-30
1.0448 - 1.5707 30-20
1.5707 - 2.3102 20-10
>
2.3102 10-0
Table 1: FCal
ΣE
Tbins and corresponding centrality classification.
mean value is about 41 (50% of the charge of the Pb nuclei). The more peripheral the collision is, the more protons are bound in multiply charged fragments and the relative fraction of free spectator protons decreases.
The neutron content of the fragments is poorly known, but even if it initially agrees with the neutron to proton ratio in the Pb nuclei, fragments similar to stable nuclei with fewer neutrons form more frequently. We can thus expect that there are more free spectator neutrons than protons.
Heavy nuclei with a large charge also interact electromagnetically and the cross section for such processes is twice as large as it was at previous colliders [3]. QED processes and photo-nuclear inter- actions occur when one photon from the electromagnetic field of one of the nuclei interacts with the other nucleus, possible fluctuating to a vector meson. This produces soft particles at mid-rapidity [4], however with relatively small multiplicity. Usually one of the ions remains intact while the other one dissociates. In the physics measurements of inelastic Pb
+Pb collisions [5], only events from 0-80% cen- tralities are considered. This is due to large systematic uncertainties arising from a strong contamination by electromagnetic backgrounds present in the 80-100% centrality bin.
The ATLAS trigger system [6] is designed to record events at approximately 200 Hz from the 40 MHz bunch crossing rate of p
+p collisions at nominal running conditions of the LHC. In 2011, rates of Pb
+Pb interactions exceeded 6 kHz at peak luminosity. The trigger system consists of three levels; the first level (L1) is a hardware-based system using information from the calorimeter and muon subdetectors, the second (L2) and third (Event Filter, EF) levels are software-based systems using information from all subdetectors. Together, L2 and EF are called the High Level Trigger (HLT).
HI triggering in ATLAS is based on signals from particle production in the main detector (as in p
+p collisions) and on signals from spectator neutrons detected in the ZDC. Although the requirements on the trigger selection for HI runs are not as stringent as those for high luminosity p
+p runs, the trigger selection is still essential for HI data taking and further physics analysis. Several ingredients are needed for HI physics measurements, one important group of triggers are those which select inelastic events with the smallest bias. Events selected in these triggers are called Minimum Bias (MB) events and are selected using information from various subsystems including: the Minimum Bias Trigger Scintillators (MBTS), ZDC, the LUminosity ˇ Cerenkov Integrating Detector (LUCID), the Inner Detector (ID) used for tracking and calorimeters providing the Total Calorimetric Energy (TE).
In this note, the performance of the MB triggers in the 2011 HI data taking period is assessed. During the running period, lasting from Nov. 5 to Dec. 7, 2011, ATLAS recorded approximately 69 million MB events from Pb+Pb collisions at nucleon-nucleon center of mass energy of
√s
NN =2.76 TeV. These
events are of use for physics measurements, detector calibration and various high-p
Ttrigger performance
studies. The efficiency of selected triggers is studied as a function of the FCal
ΣE
Tand the number of reconstructed tracks. Since most of these triggers will not be used during high luminosity 2012 p
+p running, it is important to document their performance for reference in view of the forthcoming HI runs, when they will be reintroduced into the trigger menu.
This note is organized as follows. After a brief description of the MB detectors (Section 2) and data selection requirements (Section 3), the performance of various MB triggers is reviewed (Sections 4 and 5). The performance of the MBTS counters are also investigated and compared with their performance in 2010. Finally, the stability of the relative luminosity measurement is assessed using the number of events collected by the MB triggers which is discussed in Section 6.
2 The ATLAS Minimum Bias and Forward Detector Trigger System
The ATLAS subdetectors involved in the MB event selections are: MBTS [7], LUCID [8], ZDC [9], ID tracking system [10], Calorimetric system [10]. These will be discussed in subsequent sections.
2.1 MBTS
The MBTS detector [7] consists of 32 scintillator counters each of 2 cm thickness which are organized in two disks with one on each side of the ATLAS detector (called MBTS A and MBTS C for sides A and C, respectively). The scintillators are installed on the inner face of the end-cap calorimeter cryostats at z
=±3650 mm such that the disk surface is perpendicular to the beam direction. Each disk is dividedinto an inner and an outer ring covering the radii 153–426 mm and 426–890 mm respectively. This cor- responds in pseudorapidity to 3.84
>|η|>2.82 and 2.82
>|η|>2.09. Both the inner and the outer rings are subdivided into eight readout independent
φsectors, each of 2π/8 radians wide. These sectors are located such that the first sector has its edges at
φ =0 and
φ = π/4. Light emitted by each scintillatorcounter is collected by wavelength-shifting optical fibres and guided to a photomultiplier tube (PMT).
The PMT signals are read out by the Tile Calorimeter (TileCal) electronics. The MBTS signals, after being shaped and amplified by the TileCal electronics, are fed into leading edge discriminators and sent as 25 ns pulses to the Central Trigger Processor (CTP). An MBTS hit is defined as a signal above the dis- criminator threshold. The MBTS multiplicity is calculated for sides A and C independently. During 2011 HI runs, the signals from MBTS counters were processed individually by the CTP giving L1 MBTSXN triggers where X
=A, C and N
=1
. . .16. Different trigger logic is then implemented by combining individual signals, the most important of which are L1 MBTS 2, L1 MBTS 1 1 and L1 MBTS 2 2. These require at least two MBTS hits (either on side A or C), at least one hit on both sides and at least two hits on both sides, respectively.
2.2 LUCID
LUCID is the primary ATLAS instantaneous luminosity monitor [8]. It has been designed to provide
information on the luminosity delivered to the experiment both time integrated over all particle bunches
and bunch-by-bunch. In order to achieve the latter, its electronics have been designed to process, with-
out deadtime, the number of hits recorded per bunch crossing. This also allows LUCID to operate as
part of the trigger system. The light produced by a charged particle (having momentum above the gas
Cherenkov threshold of 10 MeV for electrons and 2.8 GeV for pions) crossing a tube is collected by a ˇ
photomultiplier (PMT), amplified by the front end amplifiers and sent to receiving amplifiers through
long cables. The signals are then processed by a Field Programmable Gate Array (FPGA) in order to
provide two trigger signals which input to the CTP. These hit patterns are also recorded and are available
for further analysis (Section 5.6). Each of these trigger signals requires at least one hit in one of the two
detector arms (labeled L1 LUCID A and L1 LUCID C). Also available are the logical OR (L1 LUCID) and logical AND of these two triggers (L1 LUCID A C). The LUCID electronics are equipped with a power- ful event processor LUMAT card [8] which runs the luminosity algorithms. The LUMAT also delivers independent trigger signals to the CTP called L1 LUCID COMM. For the 2011 HI run, the L1 LUCID COMM trigger is implemented to require at least 11 hits (out of 16) per side on both LUCID arms (logical AND).
2.3 ZDC
The ZDC [9] is a compact tungsten
/quartz sampling calorimeter located on both sides of the interaction point (IP) at zero degrees with respect to the beam line. The ZDC is located 140 m downstream from the IP in the copper Target Absorber Neutral (TAN)[11], between the beam-pipes just at the place where the single beam pipe is divided back into two independent beam-pipes . It measures forward neutral particles that are produced in HI collisions at
|η|>8.3. The ZDCs are segmented longitudinally in four modules - one electromagnetic (EM) module (about 29X
0thick) and three hadronic modules (each of about 1.14λ
int). Some modules are also segmented laterally but this feature is not used at the trigger level. The quartz strips are viewed by PMT tubes, however due to the high radiation level, digitiza- tion electronics could not be placed in the vicinity the ZDC detector. Instead, analog PMT signals are amplified and sent via coaxial cables to special ZDC receiver modules in the service cavern. Here the signals are processed by a variable gain amplifier/shaper which produces a unipolar differential output signal with full length of
∼60 ns and amplitude within a [−1, 0] V range. The ZDC system provides sev- eral triggers, L1 ZDC A and L1 ZDC C trigger on one or more signals above threshold in the detectors placed on the A and C sides of ATLAS respectively. Their combinations are also implemented: logical OR (L1 ZDC) and logical AND (L1 ZDC A C). The L1 ZDC A C trigger is a key MB trigger.
2.4 Inner Detector Minimum Bias Triggers
The ID MB trigger, referred to as mbSpTrk, provides an alternative method for selecting HI interactions.
mbSpTrk is seeded by a random trigger at L1 which selects random filled bunch crossings to avoid any selection bias. The event selection takes place in the HLT. The mbSpTrk trigger uses the ID silicon sub- detectors: the pixel detector (Pixel) and the silicon micro strip tracker (SCT) [12]. The trigger covers the complete ID tracking region up to
|η|<2.5. In the L2 trigger, the algorithms detect central detector activity by forming space-points in both the Pixel and SCT. Space-points are 3-dimensional hit repre- sentations formed from hit clusters. While the Pixel space-points are made by a direct transformation of pixel clusters into space-points, the SCT space-points are only created if a pair of strip hits originate from opposing sides of a module and overlap in
ηand
φ[12]. This coincidence of silicon strips gives an intrinsic noise suppression in the SCT detector. To suppress hits accidentally formed by electronic noise in the Pixel, a cut on the pixel cluster time-over-threshold of 20 bunch crossings is applied before counting the total number of Pixel space-points in the event. Since the main task at L2 is to suppress empty bunch crossing events, the thresholds were set to operate just above the electronic noise level. The configuration used for HI runs required:
•
At least two Pixel space-points with a time-over-threshold larger than 20 bunch crossings.
•
At least three SCT space-points.
All events selected at L2 are written to tape with no further rejection at EF.
The mbSpTrk trigger is primarily designed to be a minimally biased trigger with which the trigger
e
fficiencies of the other available MB triggers can be quantified against. In 2011, the full trigger chain
accepted about 0.03% events triggered by the random trigger at L1.
2.5 Additional Items
Additional L1 items used to select MB events are based on the Total Energy (
ΣE
T) L1 trigger [13].
For the HI run, L1 specific noise suppression cuts are applied. A maximum number of eight available thresholds are used for L1 TEx (with x
=5, 10, 20, 30, 40, 50, 2000, 4000 GeV) though only those with x
≤50 are considered for MB event selection. These triggers are deployed standalone or in combination with other L1 trigger items. In addition, a veto on L1 TE50 was used to select low-multiplicity events.
This is denoted with a V in the corresponding trigger item, VTE50 for example. Such events are useful for detector monitoring and calibration, along with physics measurements. In particular full scan
2ID tracking reconstruction was run on such events in the HLT, selecting a sizable sample of ultra-peripheral collision (UPC) events.
The L1 TEx triggers are of key importance for other physics signatures and they are used as the L1 seeds of various HLT based triggers which reconstruct high- p
Telectrons, muons and jets.
3 Data Selection
The data set used for this analysis was collected during the 2011 HI data taking with the solenoid switched on. It includes only runs and luminosity blocks
3for which all primary ATLAS subdetectors were running at nominal conditions without major problems.
The total integrated luminosity corresponds to approximately 140
µb−1. The standard HI o
ffline event selection of the MB sample is used to obtain events from collisions. These collision criteria consist of the following requirements:
•
MBTS timing selections: each side is required to have a good time measurement and the difference of times measured on side A and C is smaller than 3 ns. These selections protect against the time reconstruction algorithm failure modes and remove false triggers from beam-gas interactions or halo events
•
At least two tracks which fulfill the following requirements:
– |ηtrk|<
2.5
–
with a minimal number of hits in the Pixel Detector and SCT (N
Pixel Hits ≥1 and N
SCT Hits≥6)
–
with a hit in the first, innermost layer of the Pixel detector, if it is expected from the interpo- lated track trajectory (N
BLayer Hits Expected =0 or N
BLayer Hits=1)
–
minimum p
Trequirement (p
T>0.5 GeV)
–
good fit in the case of tracks with p
T >10 GeV: Prob(χ
2trk,NDoF
trk)
≥0.01 (such require- ment is not necessary for tracks with lower momenta)
–
small distance from the primary vertex, in terms of the transverse and longitudinal impact parameters with respect to the primary vertex (|d
PV0 |<1.5mm and
|zPV0 ×sin(θ)|
<1.5mm).
2Innormalconfiguration, the ID tracking trigger processes only hits belonging to a limited size of the ID detector (Region of Interest). Infull scanmode the whole ID tracking detector is processed.
3ATLAS runs are subdivided into smaller time intervals of approximately one minute over which it is approximated that the delivered luminosity is constant.
4 Trigger Menu for the 2011 HI Runs
The trigger selection is implemented by trigger chains that consist of sequences of L1 trigger items and L2 and EF trigger algorithms. Some chains run in pass-through mode, that is, the reconstruction and hypothesis algorithms run and produce trigger decisions but the event is recorded irrespective of it.
Those triggers are used for e
fficiency measurements. Some other chains run in active mode where events are actively selected based on their reconstructed quantities passing the thresholds. To reduce the total recording rate, a prescale factor (PS) can be applied to select randomly only a requested fraction
4of the events passing the trigger chain. The list of all trigger chains, their configurations and PS factors make up the trigger menu. The trigger menu for HI 2011 runs is substantially di
fferent than the one used for pp collisions.
The primary chains used to select MB HI events are: mbZdc a c L1VTE50 trk and L1TE50 NoAlg.
The first chain is a low activity trigger seeded by L1 ZDC A C with a veto on L1 TE50 with a requirement of at least one track reconstructed at EF. The second chain L1TE50 NoAlg is a counterpart selecting events with high particle multiplicities. It does not require any additional selection at HLT as it is a high- purity trigger (as discussed in Section 5.3). The L1 ZDC A C is not included in the high activity trigger as the ZDC is slightly inefficient for events with very high multiplicities (strongly correlated with high FCal
ΣE
T). These are the most central Pb
+Pb interactions in which all neutrons from one of the nuclei have interacted leaving none free to be measured by the ZDC.
5 Performance Measurements
5.1 mbSpTrk Performance
mbSpTrk is a supporting trigger designed to select events with the smallest possible bias. In 2011 it triggered events at a constant rate of a few Hz, adjusted by means of PS values. MB events triggered by mbSpTrk are used to assess the efficiencies of various triggers in the subsequent sections of this note.
The mbSpTrk trigger e
fficiency is itself quantified based on a fully unbiased data sample selected by a random trigger at L1 selecting Pb+Pb bunch crossings with no subsequent rejection of events at the HLT. The space-point counting algorithm still runs at L2 and extracts the quantities which are used in the hypothesis algorithm of mbSpTrk. This information is used to impose the trigger selection o
ffline and hence derive the total efficiency of mbSpTrk. The majority of events in this sample consists of so called empty events in which no interaction occurred, therefore the statistics of non-empty events are strongly limited.
The mbSpTrk efficiency
trigis defined as follows:
trig=
# events passing(offline selection
∧mbSpTrk)
# events passing (offline selection)
,(1) where the o
ffline selection denotes the events passing the selections defined in Section 3.
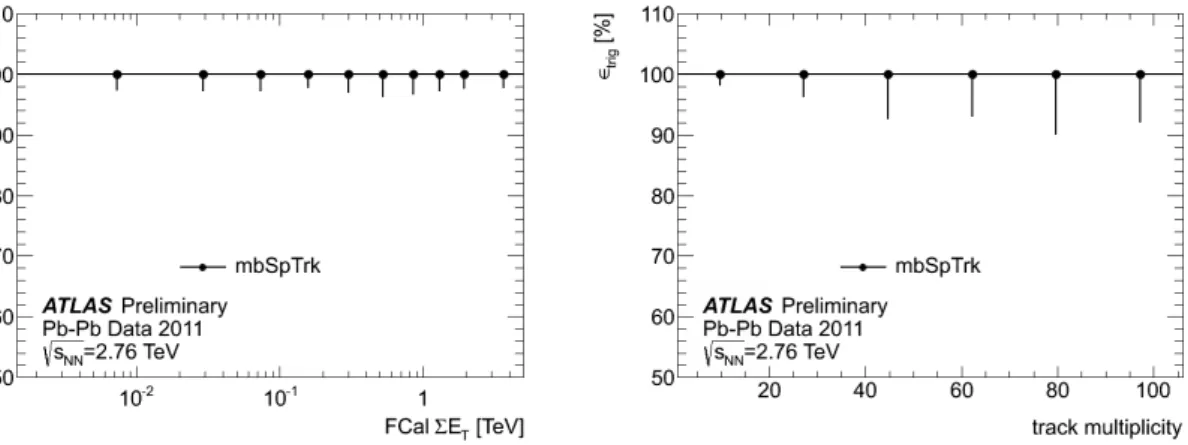
Figure 2 presents the mbSpTrk efficiency as a function of the FCal transverse energy and as a function of the number of reconstructed tracks per event. The trigger is 100% e
fficient for all FCal transverse energy and track multiplicity values. All 416 events accepted by the offline selection have also passed the mbSpTrk trigger requirements.
As the data sample selected by the L1 random trigger has small statistics, an alternative method of measuring the mbSpTrk efficiency was developed based on a data sample selected by L1 ZDC A C.
This later trigger requires a coincidence of signals from two sides of the ZDC detector. There was no subsequent selection at HLT. The space-point counting algorithm was however run at L2, extracting
4The fraction of events selected is the reciprocal of the prescale factor.
Figure 2: mbSpTrk e
fficiency as a function of FCal
ΣE
T(left) and the number of reconstructed tracks for low-multiplicity events (right).
features which were used to reproduce the mbSpTrk trigger selection offline. A large sample of more than 2.7
×10
5MB events was examined using this method. All of them also passed the mbSpTrk trigger selection which confirms the negligible probability of any ine
fficiency of this trigger.
5.2 mbSpTrk noNoise Performance
During HI data taking in 2011, high voltage (HV) trips in ID modules (both Pixel and SCT) caused periods of noise in these modules. Multiple trips were observed in some individual runs and tripped modules were observed to generate a large number of noise hits over a period of approximately ten minutes. These space points are not related to the particles produced in a collision, however they may cause an empty event to be accepted by the mbSpTrk trigger. To exclude such events an additional trigger chain was implemented, mbSpTrk noNoise, in which a specific noise state of the SCT is protected against. SCT modules a
ffected by noise are excluded per-event from the space-point sum if they would have individually contributed more than 40 space-points to the sum. Noise hits from spacepoint modules were also observed from HV trips elsewhere in the ID, these however did not cause a clear noise peak signal which could be discriminated against using the current algorithms.
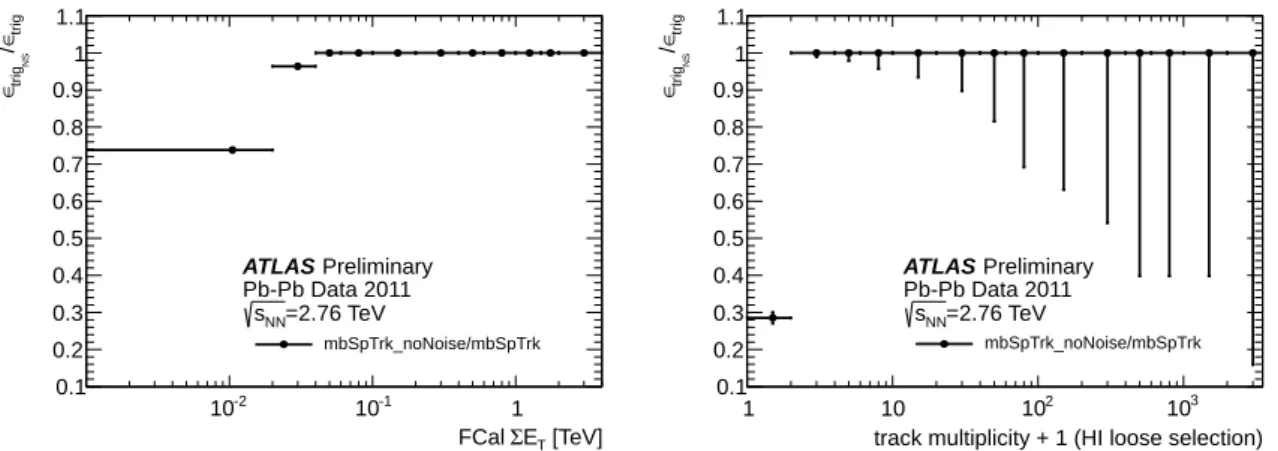
In Figure 3, the relative performance of the mbSpTrk noNoise with respect of the mbSpTrk trigger is shown as a function of FCal transverse energy and number of reconstructed tracks. It can be seen that all events selected by mbSpTrk but not by mbSpTrk noNoise are non-collision events (zero o
ffline reconstructed tracks) hence the efficiency of the new trigger remains 100%.
To study the rejection power of a given chain X, the purity is defined as the fraction of events selected by the chain which subsequently pass the o
ffline selection.
Purity
=# events passing(offline selection
∧trigger selection X)
# events passing(trigger selection X)
.Purity is an important performance quantity that has been measured for all triggers studied in the
rest of the note. The purity measurements in a LHC fill where ID modules were a
ffected by HV trips for
mbSpTrk and mbSpTrk noNoise chains are shown in Table 2. A substantial improvement of the purity
of the sample under noisy data taking conditions is observed. The higher purity of mbSpTrk noNoise
will in future lead to a more economical usage of the available trigger bandwidth.
[TeV]
ET
Σ FCal
10-2 10-1 1
trig∈/ NStrig∈
0.1 0.2 0.3 0.4 0.5 0.6 0.7 0.8 0.9 1 1.1
mbSpTrk_noNoise/mbSpTrk
ATLAS Preliminary Pb-Pb Data 2011
=2.76 TeV sNN
track multiplicity + 1 (HI loose selection)
1 10 102 103
trig∈/ NStrig∈
0.1 0.2 0.3 0.4 0.5 0.6 0.7 0.8 0.9 1 1.1
mbSpTrk_noNoise/mbSpTrk
ATLAS Preliminary Pb-Pb Data 2011
=2.76 TeV sNN
Figure 3: Relative performance of mbSpTrk noNoise with respect to mbSpTrk as a function of sum E
Tin the FCal (left) and as function of 1.5
+the number of reconstructed tracks passing the offline HI loose requirement (right). The loss in acceptance is confined to events with zero offline tracks hence preserving the 100% e
fficiency of the trigger whilst improving its purity.
Trigger Purity
mpSpTrk 0.863
±0.002 mbSpTrk NoNoise 0.929
±0.002
Table 2: Purity of mbSpTrk compared with mbSpTrk noNoise for runs affected by ID module noise.
5.3 L1 TEX Performance
The L1 TEx triggers are used to select event candidates at L1 with subsequent dedicated selections for various final states at the HLT. The trigger e
fficiency of a generic trigger L1 TEx has been measured in the unbiased data sample collected by mbSpTrk. It is defined as follows:
trig=
# events passing(L1 TEx
∧mbSpTrk
∧o
ffline selection)
# events passing(mbSpTrk
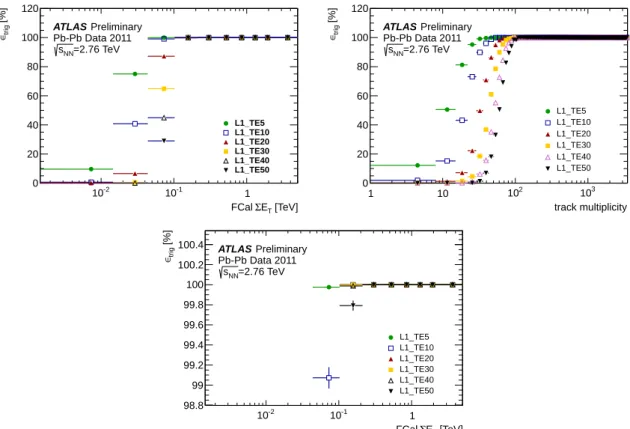
∧offline selection) (2) Figure 4 shows trigger e
fficiencies for all low-energy L1 TEx triggers where x
=5, 10, 20, 30, 40 and 50 GeV. Trigger efficiencies are studied as a function of FCal
ΣE
Tand track multiplicity. All triggers for x
<50 GeV reach a 100% plateau region for E
T >100 GeV which corresponds to around 100 tracks with p
T >500 MeV per event and centralities in the range 0–70%. L1 TE50 also exhibits a 0.2%
inefficiency in the 60–70% centrality bin. In the 70–80% centrality bin, only L1 TE5 is 100% efficient while L1 TE10 is 99% efficient.
The purity has also been measured for the L1 TEx triggers for all available thresholds (see Table 3).
Time dependencies have been identified only for the L1 TE5 trigger item, this is due to the activation of an enhanced noise suppression algorithm after LHC fill 2334. The purity for the remaining L1 TEx items is close to 1 and has no dependence on the time of the measurement (see Figure 5).
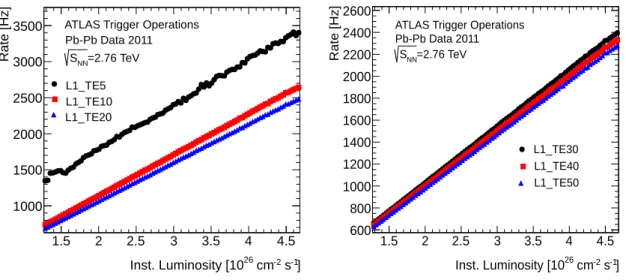
The measured rates of L1 TEx triggers as a function of the instantaneous luminosity are shown in
Figure 6. All TE thresholds scale linearly with luminosity. L1 TE5 is noisy, therefore some structures
are visible in the plot. A linear fit has been performed on the curves. The coe
fficients of the fit for these
items and the ones described in the following sections are shown in Appendix.
[TeV]
ET
Σ FCal
10-2 10-1 1
[%]trig∈
0 20 40 60 80 100 120
ATLAS Preliminary Pb-Pb Data 2011
=2.76 TeV sNN
L1_TE5 L1_TE10 L1_TE20 L1_TE30 L1_TE40 L1_TE50
track multiplicity
1 10 102 103
[%]trig∈
0 20 40 60 80 100 120
ATLAS Preliminary Pb-Pb Data 2011
=2.76 TeV sNN
L1_TE5 L1_TE10 L1_TE20 L1_TE30 L1_TE40 L1_TE50
[TeV]
ET
Σ FCal
10-2 10-1 1
[%]trig∈
98.8 99 99.2 99.4 99.6 99.8 100 100.2
100.4 ATLAS Preliminary Pb-Pb Data 2011
=2.76 TeV sNN
L1_TE5 L1_TE10 L1_TE20 L1_TE30 L1_TE40 L1_TE50
Figure 4: L1 TEx trigger e
fficiency as a function of FCal
ΣE
T(top left), the number of reconstructed tracks (top right) and a detailed view of the FCal
ΣE
Tdependence for the plateau region (bottom).
Trigger Purity
L1 TE5 0.141
±0.006 L1 TE10 0.991
+0.004−0.007L1 TE20 1.000
+−0.0040.000L1 TE30 1.000
+0.000−0.004L1 TE40 1.000
+−0.0040.000L1 TE50 1.000
+−0.0050.000Table 3: Purity of TE seeded triggers.
LHC Fill
2300 2310 2320 2330 2340 2350
Purity
0 0.2 0.4 0.6 0.8 1 1.2 1.4
L1_TE5 L1_TE10 L1_TE20
ATLAS
Pb-Pb Data 2011 = 2.76 TeV SNN
Preliminary
Figure 5: Purity of TE seeded triggers as a function of time represented by the LHC fill number. L1 TEx triggers with x
≥30 always have purity equal unity and are not shown.
-1]
-2 s
26 cm Inst. Luminosity [10
1.5 2 2.5 3 3.5 4 4.5
Rate [Hz]
1000 1500 2000 2500 3000
3500 ATLAS Trigger Operations Pb-Pb Data 2011
=2.76 TeV SNN
L1_TE5 L1_TE10 L1_TE20
-1]
-2 s
26 cm Inst. Luminosity [10
1.5 2 2.5 3 3.5 4 4.5
Rate [Hz]
600 800 1000 1200 1400 1600 1800 2000 2200 2400 2600
ATLAS Trigger Operations Pb-Pb Data 2011
=2.76 TeV SNN
L1_TE30 L1_TE40 L1_TE50
Figure 6: Measured rates of L1 TEx triggers as a function of luminosity.
[TeV]
ET
Σ FCal
10-2 10-1 1
[%]trig∈
0 20 40 60 80 100
120 ATLAS Preliminary Pb-Pb Data
=2.76 TeV sNN
L1_ZDC_A_C 2011 L1_ZDC_A_C 2010
track multiplicity
1 10 102 103
[%]trig∈
0 20 40 60 80 100
120 ATLAS Preliminary Pb-Pb Data
=2.76 TeV sNN
L1_ZDC_A_C 2011 L1_ZDC_A_C 2010
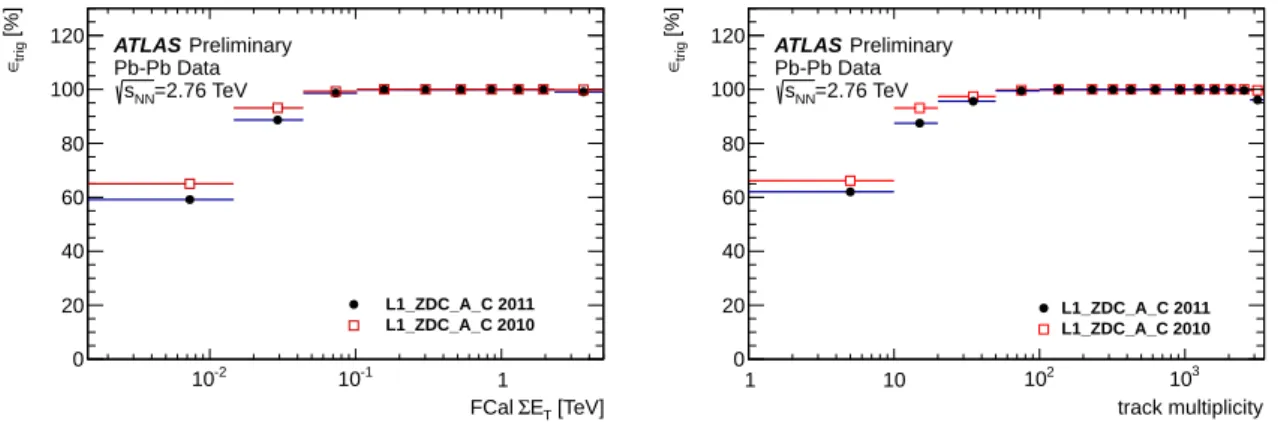
Figure 7: L1 ZDC A C efficiency as a function of FCal
ΣE
T(left) and the number of reconstructed tracks (right) for 2010 and 2011 data.
5.4 L1 ZDC Performance
The e
fficiency of L1 ZDC A C is shown in Figure 7 as a function of FCal transverse energy and the number of reconstructed tracks for 2010 and 2011 data. In 2011 the efficiency is slightly lower due to the reduced gain caused by radiation damage. It reaches 100% in the 60–70% centrality bin for events with more than 70 reconstructed tracks. However, a 1% ine
fficiency is observed in the highest FCal
ΣE
Tbin, which corresponds to the 10% most central events. In these events with no trigger from L1 ZDC A C, either the entire nucleus is broken up in the collision leaving no spectator neutrons to impact the ZDC or the reduced gain leads to the measured signal which is below the threshold. The HIJING [14]
Monte Carlo simulations of Pb+Pb collisions suggest, that the probability of a failure of L1 ZDC A C trigger due to the lack of spectator neutrons in the most central events (0-10%) is about 0.9%. On the other hand the peripheral events (80-100% centrality bins) are contaminated by a non-negligible fraction of photo-nuclear events which are selected by the MB requirements. Due to large systematic uncertainties, events from these two peripheral bins
5are not used to normalize the production yields in HI physics measurements. Section 5.4.1 discusses two methods of estimation of the photo-nuclear contamination at low FCal
ΣE
Tvalues. The overall L1 ZDC A C efficiency in 0-80% centrality bins is equal to (99.7
±0.1)%.
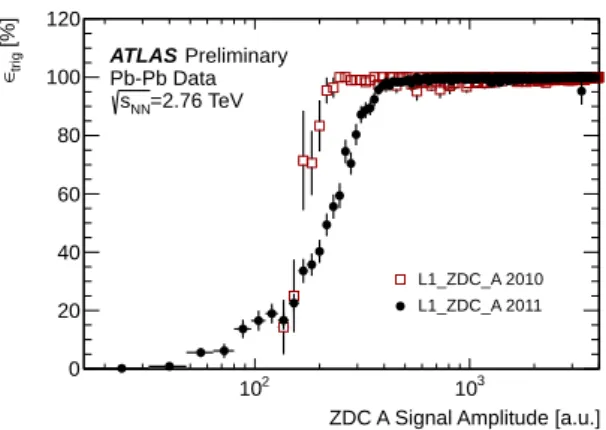
Figure 8 shows a comparison between L1 ZDC A trigger e
fficiency as a function of signal amplitude on side A of ZDC for two data sets collected in 2010 and 2011. A clear difference in turn-on behavior is visible. In 2010 the turn-on region is sharp and a plateau value is reached at around 200 [a.u.]
6. While in 2011 the turn-on region is smeared out over a broader range of signal amplitudes. The plateau is reached for higher signal amplitudes at around 400 [a.u.]. This behavior is a consequence of the gain change in the 2011 HI run. C side of ZDC shows similar performances.
It is observed that about 40% of events selected by the L1 ZDC A C trigger do not pass the MB offline selection. Figure 9 shows the number of hits for each side (A and C) of the MBTS detector for events selected by L1 ZDC A C. These events are split into two classes: those which do not pass the MB o
ffline selection and those which do pass it. Events which do not pass the MB o
ffline requirements are predominantly empty with no single hit on either side of MBTS. There is also a significant number of asymmetric events with some large number of counts on one side of MBTS and no deposits or a small number of counts on the opposite side. These come mainly from photo-nuclear interactions and do not
5The 80-100% centrality bins correspond to FCalΣET<43.8 GeV.
6a.u. stands for arbitrary units.
ZDC A Signal Amplitude [a.u.]
102 103
[%]trig∈
0 20 40 60 80 100 120
ATLAS Preliminary Pb-Pb Data
=2.76 TeV sNN
L1_ZDC_A 2010 L1_ZDC_A 2011
Figure 8: L1 ZDC A trigger efficiency as a function of signal amplitude on side A for 2010 and 2011 data.
MBTS counts side C
0 2 4 6 8 10 12 14
MBTS counts side A
0 2 4 6 8 10 12 14
1 10 102
103
104
105
ATLAS Preliminary Pb-Pb Data 2011
=2.76 TeV sNN
NOT passing MB selection
MBTS counts side C
0 2 4 6 8 10 12 14
MBTS counts side A
0 2 4 6 8 10 12 14
1 10 102
103
ATLAS Preliminary Pb-Pb Data 2011
=2.76 TeV sNN
Passing MB selection
Figure 9: The number of modules hit on two sides of the MBTS detector for events selected by L1 ZDC A C which do not pass the MB o
ffline selection (left) and those which do pass the MB require- ment (right). Events passing MB o
ffline selection populate preferentially the high multiplicity region on both sides.
have a reconstructed vertex.
To avoid filling the trigger bandwidth with empty events, the L1 ZDC A C trigger was used in only one of two complementary trigger chains in combination with the total energy trigger L1 TE50. These two exclusive triggers are defined as follows:
•
High-multiplicity trigger: L1TE50 NoAlg. Seeded by L1 TE50 at L1. This is the only requirement, with no selection at the HLT. This chain also recovers very central events which are not selected by L1 ZDC A C.
•
Low-multiplicity trigger: mbZdc a c L1VTE50 trk. Events selected by L1 ZDC A C which do not pass the L1 TE50 trigger requirement at L1. This trigger runs the full scan tracking reconstruction at the EF which requires at least one reconstructed track with p
T>400 MeV in order to select the event.
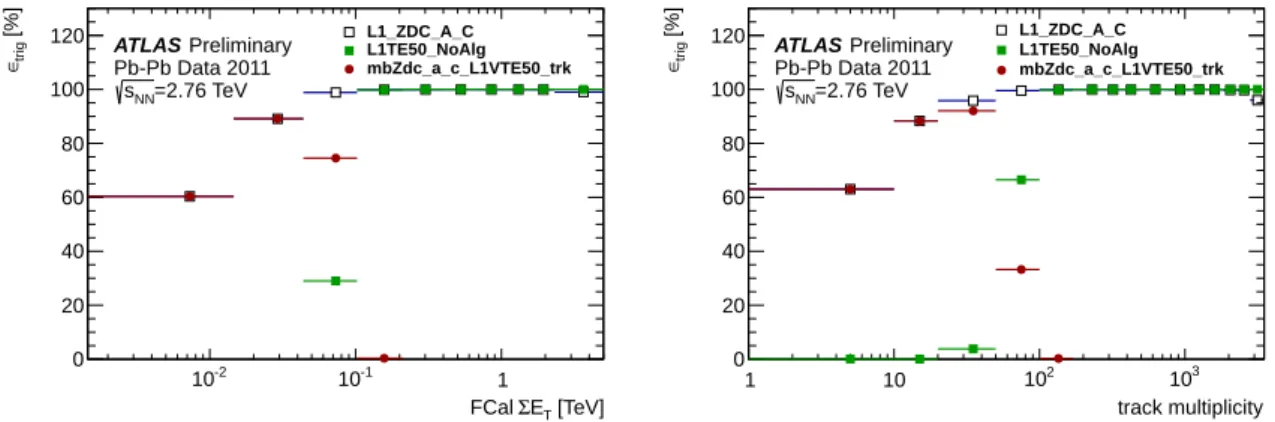
The trigger efficiencies of these two chains in comparison to the trigger efficiency of the pure L1 ZDC A C
chain is shown in Figure 10 as a function of the FCal transverse energy and the number of recon-
structed tracks. The low-multiplicity trigger mbZdc a c L1VTE50 trk has the same efficiency as the pure
L1 ZDC A C trigger in the events with low multiplicity (up to 20 tracks) or with small FCal
ΣE
Tvalues.
[TeV]
ET
Σ FCal
10-2 10-1 1
[%]trig∈
0 20 40 60 80 100
120 ATLAS Preliminary Pb-Pb Data 2011
=2.76 TeV sNN
L1_ZDC_A_C L1TE50_NoAlg mbZdc_a_c_L1VTE50_trk
track multiplicity
1 10 102 103
[%]trig∈
0 20 40 60 80 100
120 ATLAS Preliminary Pb-Pb Data 2011
=2.76 TeV sNN
L1_ZDC_A_C L1TE50_NoAlg mbZdc_a_c_L1VTE50_trk
Figure 10: Trigger efficiencies of L1 ZDC A C, mbZdc a c L1VTE50 trk and L1TE50 NoAlg as a func- tion of FCal
ΣE
T(left) and track multiplicity (right).
(TeV) FCal ET
10-2 10-1 1
[%]trig∈
50 60 70 80 90
100 ATLASPreliminary Pb-Pb Data 2011
=2.76 TeV sNN
L1_ZDC_A_C
L1TE50_NoAlg OR mbZdc_a_c_L1VTE50_trk
[TeV]
ET
Σ FCal
10-2 10-1 1
Ratio
0.98 0.99 1 1.01 1.02
track multiplicity
1 10 102 103
[%]trig∈
50 60 70 80 90
100 ATLAS Preliminary Pb-Pb Data 2011
=2.76 TeV sNN
L1_ZDC_A_C
L1TE50_NoAlg OR mbZdc_a_c_L1VTE50_trk
track multiplicity
1 10 102 103
Ratio
0.95 0.975 1 1.025 1.05
Figure 11: Combined trigger e
fficiencies of mbZdc a c L1VTE50 trk OR L1TE50 NoAlg as a function of FCal
ΣE
T(left) and track multiplicity (right). A comparison with the L1 ZDC A C is also shown. The bottom panels show a ratio of the combined mbZdc a c L1VTE50 trk OR L1TE50 NoAlg efficiency over the L1 ZDC A C e
fficiency.
Then its efficiency starts to decrease due to the veto on the L1 TE50 trigger. At the same time, the high-multiplicity trigger L1TE50 NoAlg starts to accept events and becomes 100% e
fficient for track multiplicities around 100. The L1 TE50 trigger is fully efficient for the most central events, whereas small efficiency losses are observed in the L1 ZDC A C trigger.
Figure 11 shows the combined trigger e
fficiency of the logical OR of mbZdc a c L1VTE50 trk and L1TE50 NoAlg as a function of FCal transverse energy and track multiplicity. This efficiency is com- pared with the efficiency of L1 ZDC A C. The combined trigger becomes fully efficient for events with at least 100 tracks. For low multiplicities (low FCal
ΣE
T) its ine
fficiency is due to the low e
fficiency of the L1 ZDC A C L1 seed. There are no additional e
fficiency losses due to the full-scan tracking reconstruc- tion at the HLT. The combined trigger recovers the inefficiency of L1 ZDC A C for large centrality values.
The overall combined trigger e
fficiency in 0-80% centralities is equal to (99.9
±0.1)%.
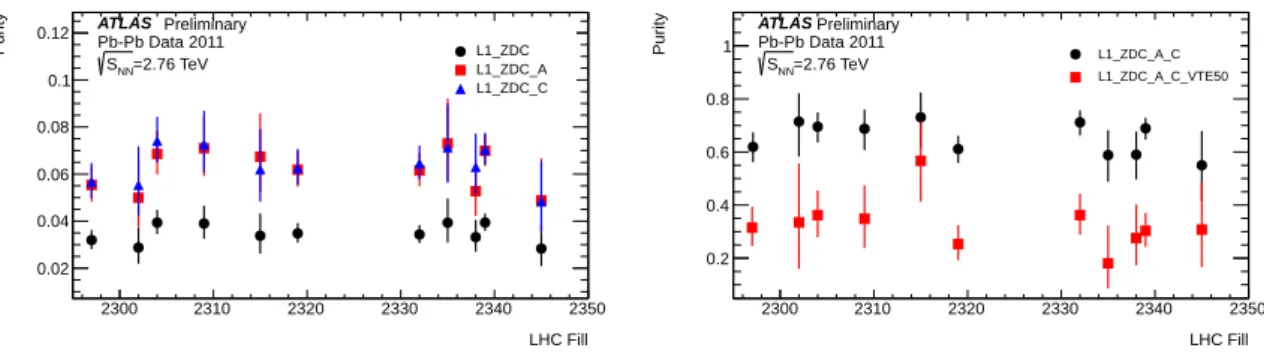
The purity of the ZDC triggers is shown in Table 4. To spot variations in time, the purity has been evaluated as a function of the LHC fill number in Figure 12. No significant variations are observed. The measured rates as a function of the instantaneous luminosity are shown in Figure 13.
The dependence of the mean of the signal from the FCal detector as a function of time was used to
Trigger Purity
L1 ZDC 0.0348
±0.0014 L1 ZDC A C 0.653
±0.017 L1 ZDC A C VTE50 0.305
±0.025 mbZdc a c L1VTE50 trk 0.684
±0.001 Table 4: Purity of ZDC seeded triggers.
LHC Fill
2300 2310 2320 2330 2340 2350
Purity
0.02 0.04 0.06 0.08 0.1 0.12
L1_ZDC L1_ZDC_A L1_ZDC_C ATLAS
Pb-Pb Data 2011
=2.76 TeV SNN
Preliminary
LHC Fill
2300 2310 2320 2330 2340 2350
Purity
0.2 0.4 0.6 0.8
1 L1_ZDC_A_C
L1_ZDC_A_C_VTE50 ATLAS
Pb-Pb Data 2011
=2.76 TeV SNN
Preliminary
Figure 12: Purity of L1 ZDC triggers as a function of time represented by the LHC fill number.
-1]
-2 s
26 cm Inst. Luminosity [10
1.5 2 2.5 3 3.5 4 4.5
Rate [Hz]
20 30 40 50 60 70 80 90 100 110
103
× ATLAS
Pb-Pb Data 2011
=2.76 TeV SNN
L1_ZDC L1_ZDC_C L1_ZDC_A
Trigger Operations
-1]
-2 s
26 cm Inst. Luminosity [10
1.5 2 2.5 3 3.5 4 4.5
Rate [Hz]
1 2 3 4 5
103
×
L1_ZDC_A_C L1_ZDC_A_C_VTE50 Trigger Operations
Pb-Pb Data 2011
=2.76 TeV SNN
ATLAS
Figure 13: Rates of L1 ZDC triggers as a function of instantaneous luminosity.
LHC Fill 193200 193400 193600 193800 194000 194200 194400
> [TeV]TEΣ<FCal
0.01 0.02 0.03 0.04
ATLAS Preliminary Pb-Pb Data 2011
= 2.76 TeV sNN
mbZdc_a_c_L1VTE50_trk
2287 2300 2315 2326 2333 2343 2352
LHC Fill 193200 193400 193600 193800 194000 194200 194400
> [TeV]TEΣ<FCal
0.2 0.4 0.6 0.8 1 1.2
ATLAS Preliminary Pb-Pb Data 2011
= 2.76 TeV sNN
L1TE50_NoAlg
2287 2300 2315 2326 2333 2343 2352
Figure 14: Mean value of the FCal signal as a function of the run number for the events selected by mbZdc a c L1VTE50 trk (left) and L1TE50 NoAlg (right). Only events selected by the fully efficient minimum bias mbSpTrk trigger were uesd.
measure the stability over time of these principal MB chains with HI collisions. This is an important event characteristic as it is related to the stability of the event centrality dependence in the whole dataset, which is directly derived from the FCal signal. The values obtained for di
fferent runs are consistent with a common constant value (as in Figure 14). Deviations larger than the statistical errors are due to small detector e
ffects such as temporary trips of calorimeter modules and variation of noise cuts
7.
5.4.1 Background contamination
A photo-nuclear background contaminates the MB sample in particular at low FCal
ΣE
Tvalues. Those events will artificially lower the L1 ZDC A C e
fficiencies as in the majority of cases only one nucleus is broken up which leads to a failure of the coincidence ZDC trigger. Two methods to evaluate the contamination of background events in the FCal
ΣE
Tspectrum are discussed in the following.
The MBTS cut method relies on the fact that photo-nuclear events tend to deposit lower numbers of hits on both MBTS sides which also tend to be asymmetric as shown in the left plot of Figure 9. Therefore the photo-nuclear background may be diminished by imposing extra cuts on a number of hits in MBTS.
The stability of the trigger efficiency measurement was evaluated imposing an extra requirement on a minimum number of hits on each side of MBTS on top of the MB selection discussed in the baseline L1 ZDC A C efficiency measurement. The left plot of Figure 15 shows a comparison of the L1 ZDC A C efficiency with and without a cut on a minimum number of hits in MBTS. The efficiency is different only in the first two FCal
ΣE
Tbins being an indication of the background contamination there. The L1 ZDC A C efficiency is consistent with the earlier measurement in 0-80% centrality bins. For tighter requirements on the minimum number of MBTS hits, the L1 ZDC A C efficiency tends to go up in the first FCal
ΣE
Tbin indicating a strong contamination by the background. At the same time, the loosest minimum number of MBTS hits requirement tends to give a stable L1 ZDC A C efficiency measurement in the second FCal
ΣE
Tbin.
The L1 ZDC A C trigger e
fficiency has been extracted from an independent data sample of high p
Tmuons which predominantly come from hadronic Pb+Pb interactions. This sample has been selected using events selected by the single muon trigger with a minimum p
T >4 GeV requirement. The trigger and single tight muon selection cuts are defined following the ATLAS Z
→µ+µ−analysis of ref. [15].
7In particular the increase around fill 2330.
[TeV]
ET
Σ FCal
10-2 10-1 1
[%]trig∈
50 60 70 80 90 100 110
ATLAS Preliminary Pb-Pb Data 2011
=2.76 TeV sNN
L1_ZDC_A_C default
L1_ZDC_A_C && min MBTS hits>2 L1_ZDC_A_C && min MBTS hits>3 L1_ZDC_A_C && min MBTS hits>6 L1_ZDC_A_C && min MBTS hits>9
[TeV]
ET
Σ FCal
10-2 10-1 1
[%]trig∈
50 60 70 80 90 100 110
ATLAS Preliminary Pb-Pb Data
=2.76 TeV sNN
L1_ZDC_A_C from muons L1_ZDC_A_C && min MBTS hits > 2 Pb-Pb Data 2011
Figure 15: Comparison of the L1 ZDC A C efficiency with a requirement on a minimum number of hits deposited in MBTS (left). Comparison of the L1 ZDC A C e
fficiency extracted from a sample of muons with p
T>10 GeV and the one with a cut on a number of hits in MBTS
>2 (right).
The FCal
ΣE
Tdistribution for such events does not follow the MB spectrum from Figure 1 but is heavily biased towards central events. The L1 ZDC A C trigger efficiency is defined as a ratio of a number of events with at least one tight muon with p
T>10 GeV which were also selected by L1 ZDC A C to a total number of events with at least one tight muon with p
T >10 GeV in a given FCal
ΣE
Tbin. Figure 15 shows a comparison between the L1 ZDC A C efficiency extracted from a sample of high p
Tmuons with the one measured using the MB sample selected by mbSpTrk and the requirement of at least two MBTS hits. The two e
fficiency curves agree for all FCal
ΣE
Tvalues not leaving much room for the background contamination, in particular in the 0-80% centrality bins. The lowest two FCal
ΣE
Tbins suffer from a large statistical uncertainty due to low yields of high p
Tmuons in peripheral events.
5.5 L1 MBTS X Performance
The MBTS detector provides basic triggers for MB events in p
+p collisions, namely L1 MBTS 1 and L1 MBTS 2. The L1 MBTS 1 1 and L1 MBTS 2 2 triggers were used at the beginning of the 2010 HI run but were substituted with a ZDC trigger because MBTS frequently selected empty events at L1 thus providing low purity. The signals from MBTS are however used in further selection of Pb
+Pb collisions and thus understanding the detector performance in the HI run is important.
Before the 2011 HI run the MBTS has been exposed to radiation produced in the p
+p collisions of approximately 5 fb
−1of integrated luminosity. This cumulative radiative dose received during operation of the LHC modified the properties of the polystyrene scintillator causing a deterioration of transparency.
The intensity of the light reaching the MBTS photomultiplies decreases and the performance of this detector is expected to degrade. The signal outputs of the MBTS counters are investigated to test if the radiation damage a
ffect the triggering capabilities.
To evaluate the degradation of the signals coming from the MBTS counters the distributions of the signals in single modules were analyzed. For each module S X where S
=A,C and X
=1
. . .16, the sample of events selected by the L1 MBTS 1 1 trigger
8was divided into events passing the monitoring trigger L1 MBTS S X (i.e. events with signal) and events rejected by this trigger (i.e. events with noise). Typical signal distributions for a single counter is shown in Figure 16. The distributions for accepted signals and noise signals were normalized to the same total number of events (accepted
+noise). In HI collisions, large particle multiplicities are produced due to the large number of nucleon-nucleon interactions. In the
8So as to avoid ultra-peripheral and non-collision events.
MBTS signal [pC]
0 100 200 300 400 500 600 700 800 900
eventsN
1 10 102
103
module A03
2010 2011
ATLAS Preliminary Pb-Pb Data
= 2.76 TeV sNN
MBTS signal [pC]
-0.1 0 0.1 0.2 0.3 0.4 0.5 0.6 0.7 0.8 0.9
eventsN
1 10 102
103
module A03
2010 2011
ATLAS Preliminary Pb-Pb Data
= 2.76 TeV sNN
Figure 16: The distributions of the full range (left) of the signal for MBTS module A03 and of its low region (right) for events accepted by L1 MBTSA3 trigger (solid lines) and vetoed by this trigger (dotted lines) obtained in the years 2010 (blue) and 2011 (red).
central Pb+Pb collisions each of MBTS modules is hit by many particles. Consequently, the full range of MBTS signals is much larger in Pb
+Pb collisions than in p
+p. The distribution obtained in 2010 is affected by signal saturation resulting in a peak below the upper saturation value of 900 pC.
The degradation of the MBTS response to charged particles leads to significant reduction of signal yield (60–70%) thus the distribution obtained in 2011 ends below 700 pC. In Figure 16 (right), the same distributions restricted to the range below 0.9 pC are shown, together with the distributions of the noise signals. The hardware threshold for the L1 MBTSA3 trigger at 0.2 pC is visible as a smooth transition, this is due to the di
fference between the signal in the electronics and the o
ffline reconstruction. The distributions of accepted signal from 2010 and 2011 are similar, however in 2011 the event multiplicity at small signals is larger due to the aforementioned degradation of MBTS scintillators leading in this case to the shifting of the events to lower values. The distributions for events rejected by the L1 MBTSA3 trigger are almost identical (Figure 16 (right)).
The distribution for events rejected by L1 MBTSA3 trigger (Figure 16 (right)) includes a Gaussian noise peak centered near zero and a shoulder at larger values (probably mostly events with a particle hitting the module, but leaving signals below the threshold at 0.2 pC). A more precise study of the noise distribution is possible after it has been parametrized using a Gaussian function in the vicinity of the maximum. In Figure 17, the parameters of such a fit are shown for each MBTS counter. The mean position of the maximum is very close to zero, however deviations from zero are not fully random. Both the direction and magnitude of the deviation per module is observed to be similar in 2010 and 2011 for many but not all counters. This observation is more pronounced in the width of the noise peak. While the systematic di
fferences between MBTS modules are large, about 20%, a systematic decrease of the noise signal width between 2010 and 2011 of almost 5% is also observed.
In Figure 18, trigger e
fficiencies are shown for L1 MBTS 2, L1 MBTS 1 1 and L1 MBTS 2 2 as a function of the FCal transverse energy and the number of reconstructed tracks. The first two of them are almost 100% efficient starting from very peripheral events, while all of them reach a plateau region for FCal
ΣE
T>0.1 TeV which corresponds to relatively low track-multiplicities. L1 MBTS 2 is 100%
e
fficient for events with at least 3 tracks with p
T >500 MeV each. Figure 18 also shows an expanded view of the plateau region revealing a 0.05% inefficiency for all MBTS triggers for mid–central and central events. This inefficiency tends to grow for tighter trigger selections and can be explained by the pulse stretching induced from large signals and time not lining up with the LHC clock.
Purity has also been measured for the MBTS triggers. The values for several triggers are shown in
Table 5. In addition to the previously discussed triggers, the purity of L1 MBTS 3 3 and L1 MBTS 4 4
(triggers which require on each side hits in at least three and in at least four modules, respectively) is
MBTS module
0 5 10 15 20 25 30
> [pC]MBTSnoise<E
-0.005 -0.004 -0.003 -0.002 -0.001 0 0.001 0.002 0.003 0.004 0.005
2010 2011
ATLAS Preliminary Pb-Pb Data
= 2.76 TeV sNN
MBTS module
0 5 10 15 20 25 30
) [pC] MBTS noise(Eσ
0 0.005 0.01 0.015 0.02 0.025 0.03
2010 2011
ATLAS Preliminary Pb-Pb Data
= 2.76 TeV sNN
Figure 17: Noise parametrization in MBTS counters obtained from the fit of a Gaussian function. Blue and red points were obtained for data taken in 2010 and 2011 respectively. A few missing points corre- spond to counters which were not working correctly during the analyzed run; mean position of the noise peak (left), width of the noise (right).
[TeV]
ET
Σ FCal
10-2 10-1 1
[%]trig∈
70 75 80 85 90 95 100 105 110 115
ATLAS Preliminary Pb-Pb Data 2011
=2.76 TeV sNN
L1_MBTS_2 L1_MBTS_1_1 L1_MBTS_2_2
track multiplicity
1 2 3 4 5 6 7 8 9 10 11
[%]trig∈
50 60 70 80 90 100
110 ATLAS Preliminary Pb-Pb Data 2011
=2.76 TeV sNN
L1_MBTS_2 L1_MBTS_1_1 L1_MBTS_2_2
[TeV]
ET
Σ FCal
10-2 10-1 1
[%]trig∈
99 99.2 99.4 99.6 99.8 100
100.2 ATLAS Preliminary Pb-Pb Data 2011
=2.76 TeV sNN
L1_MBTS_2 L1_MBTS_1_1 L1_MBTS_2_2
Figure 18: L1 MBTS X trigger efficiency as a function of FCal transverse energy (top left), the number
of reconstructed tracks (top right) and a detailed view of the FCal transverse energy dependence for the
trigger plateau region (bottom).
Trigger Purity
L1 MBTS 1 0.0113
±0.0005 L1 MBTS 1 1 0.068
±0.003
L1 MBTS 2 0.048
±0.002 L1 MBTS 2 2 0.144
±0.006 L1 MBTS 3 3 0.244
±0.010 L1 MBTS 4 4 0.39
±0.01
Table 5: Purity of L1 MBTS seeded triggers. See text for definitions of triggers.
LHC Fill
2300 2310 2320 2330 2340 2350
Purity
0 0.02 0.04 0.06 0.08 0.1 0.12 0.14
L1_MBTS_1 L1_MBTS_2 L1_MBTS_1_1 Preliminary
Pb-Pb Data 2011
=2.76 TeV SNN
ATLAS
LHC Fill
2300 2310 2320 2330 2340 2350
Purity
0.1 0.2 0.3 0.4 0.5 0.6 0.7 0.8
L1_MBTS_2_2 L1_MBTS_3_3 L1_MBTS_4_4 Preliminary
Pb-Pb Data 2011
=2.76 TeV SNN
ATLAS
![Figure 1: Measured FCal Σ E T distribution divided into 10% centrality intervals as extracted from the 2010 data sample [1].](https://thumb-eu.123doks.com/thumbv2/1library_info/4028003.1542234/2.892.267.618.476.701/figure-measured-distribution-divided-centrality-intervals-extracted-sample.webp)