ATLAS-CONF-2010-018 13July2010
ATLAS NOTE
ATLAS-CONF-2010-018 April 16, 2010
Properties and internal structure of jets produced in proton-proton collisions at √
s=900 GeV
The ATLAS Collaboration
Abstract
Preliminary results are presented on the study of charged tracks in jets and the inter- nal jet structure using a sample of proton-proton collisions at a center-of-mass energy of
√s=900 GeV collected by the ATLAS detector. Jets with low transverse momenta (pTjet) are constructed using the anti−kt jet algorithm withR=0.6, and selected with uncorrected transverse momentum pTjet>7 GeV. The measurements are not corrected for detector ef- fects and no attempt is made to account for systematic uncertainties. The track multiplicity and momentum distribution within jets can be exploited to improve jet calibration and is found to be in good agreement with predictions from Monte Carlo simulations. Jet shape measurements are also reasonably well described by the Monte Carlo simulation.
1 Introduction
This note presents the first results on studies of jet properties in proton-proton (pp) collisions at a center- of-mass energy of √
s=900 GeV, using a sample collected with minimum bias triggers by the ATLAS experiment in December 2009. The measurements are compared to predictions from a Monte Carlo sim- ulation based on phenomenological models of non-diffractive processes and including a full simulation of the detector response. Precise measurements of the charged particle content and energy distributions within jets will form a basis for understanding the process of jets production and internal jet structure at higher center-of-mass energies. A proper description of the jet fragmentation process and the hadronic final state activity around jets constitutes a crucial step towards the precise determination of the jet en- ergy scale and the ability to accurately measure the jet internal structure. Preliminary studies of each of these aspects of jet properties are presented in this note. The measurements are not corrected for detector effects and no attempt is made to account for systematic uncertainties. More details on the kinematic distributions of jets using the first ATLAS data can be found in [1].
2 Monte Carlo Simulation
Data are compared to Monte Carlo (MC) events of non-diffractive proton-proton collisions (often re- ferred to as “minimum bias”) generated with the PYTHIA [2] event generator program at√
s=900 GeV.
The events are generated with a special tuned set of parameters denoted as ATLAS MC09 [3], and sim- ulated using a full GEANT4 [4] simulation of the ATLAS detector. Only non-diffractive processes are considered as the single and double diffractive contributions have been shown to be negligible for these analyses. The same trigger and event selection criteria are applied to the MC as to the data.
3 Event Selection and Jet Reconstruction
3.1 Event trigger and selection
All data were collected during the first LHC run of December 2009 where the tracking detectors and calorimeters were fully operational and the solenoid magnetic field was on. Events are selected to pass the first level trigger requiring at least one hit on both sides of the minimum bias trigger scintillators (MBTS), which are located inside the inner cavity in front of the end-cap cryostats, and cover the pseudo- rapidity range 2.09<|η|<3.84. Additional offline timing criteria are applied to further reject beam background events: signals in coincidence from both sides of either the end-cap calorimeters or the MBTS. A total of 330,810 events satisfy these criteria and form the basis of the analyses presented here.
3.2 Jet reconstruction and track selection
Jets are constructed using the infrared and collinear-safe anti−kt jet algorithm [5] with a distance pa- rameter (η−φ space)1) set toR=0.6. The inputs to the jet algorithm in both data and Monte Carlo simulation events are energy deposits in the calorimeter towers [6]. In this analysis, calorimeter towers and tracks are treated as massless objects. The jet reconstruction algorithm recombines the four-vectors of the jet constituents leading to massive jets. Jets with transverse momentum pTjet>7 GeV at the elec- tromagnetic scale, which is the appropriate scale for energy deposited by electromagnetic processes in
1)The ATLAS reference system is a Cartesian right-handed coordinate system, with nominal collision point at the origin.
The anti-clockwise beam direction defines the positive z-axis, with thex-axis pointing to the center of the LHC ring. The pseudo-rapidity is defined asη=−ln(tan(θ/2)), where the polar angleθis taken with respect to the positivezdirection. The rapidity is defined asy=0.5×ln[(E+pz)/(E−pz)], whereEdenotes the energy andpzis the component of the momentum along the beam direction.
the calorimeter, and pseudo-rapidity in the range |ηjet|<2.6 2)are considered. No attempt is made to correct for dead material energy losses, or for differences in the calorimeter hadronic and electromag- netic responses (non-compensation). Additional jet quality criteria are also applied to ensure that jets are not produced by single noisy calorimeter cells or problematic detector regions. The final sample contains a total of 1596 jets.
The results shown here use jets constructed with noise suppressed∆η×∆φ =0.1×0.1 towers built only from cells contained in clusters [7]. Topological clusters are built from a seed calorimeter cell with
|Ecell|>4σ of the noise, surrounding cells with|Ecell|>2σ, and an outer layer of all cells surrounding the clustered cells, whereσ is defined as the RMS of the cell energy noise distribution.
Tracks are selected within the acceptance of the ATLAS inner tracking detectors (Pixel, SCT and TRT) using the selection criteria described below. Track candidates are reconstructed using a silicon based pattern recognition requiring seven or more silicon hits in total from the Pixel and SCT, and then extrapolated to include measurements in the TRT. Studies of the track reconstruction performance and efficiency at √s=900 GeV [8] demonstrate that the MC description of the track properties and kinematics agrees with the data to a high accuracy within the Pixel and SCT detectors.
For studies of charged particle tracks in jets, the selection criteria are chosen to provide good quality tracks with moderately lowpTtrack. The following selection criteria are applied:
• transverse momentum pT >500 MeV,
• pseudo-rapidity |η|<2.5,
• transverse impact parameter with respect to the primary vertex|d0|<1.5 mm,
• longitudinal impact parameter with respect to the primary vertex|z0×sinθ|<1.5 mm,
• at least 6 hits in the Silicon Tracker (SCT) detector,
• at least 1 hit in the Pixel detector.
4 Study of Tracks inside Jets
The ATLAS Inner Detector (ID) provides precise measurements of the momentum of charged particles emerging from the pp collisions which in turn yield information regarding the fraction of neutral and charged energy contained in the jet and the internal jet structure. Measurements of the track multiplicity in jets, Ntrack, and its correlation with pTjet using a simple ∆R=p
(∆η)2+ (∆φ)2 matching criterion are presented. The total track momentum associated with a jet, ∑pTtrack, can be used to provide further details on the calorimeter response to jets. The ratio of ∑pTtrack to pTjet, referred to as ftrack, has been shown to improve the energy resolution of jets in the MC simulation [7]. In this section, jets are selected with|ηjet|<1.9, to account for the ID coverage (|η|<2.5) and the requirement that tracks are contained within a cone of radiusR=0.6 around the jet axis. A total of 1192 jets are selected with this criterion.
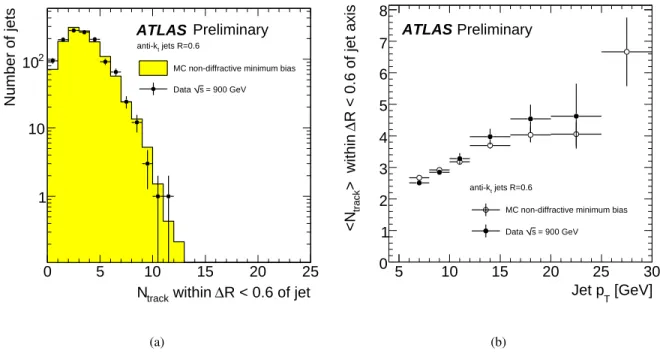
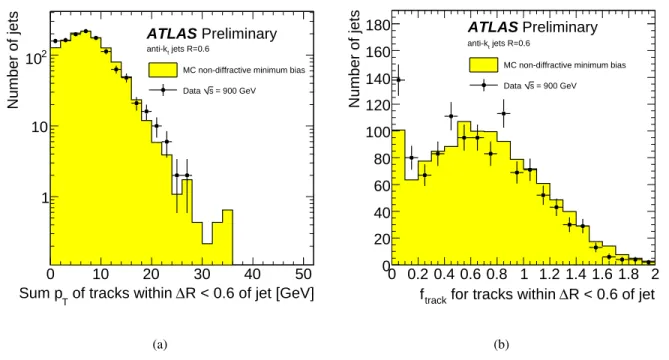
Figure 1 shows the measured number of tracks inside jets and its correlation with pTjet. The track multiplicity is peaked atNtrack=2 and increases with increasing pTjet. The measurements are reasonably well described by the predictions from the MC simulation, which would suggest that the track momen- tum and angular distributions in jets are well modeled, and that the response of the ATLAS detector is followed by the current GEANT4 simulation. Nevertheless, the data prefer a smaller average track multiplicity at low pTjet. The measured∑pTtrackand ftrackshown in Figure 2 also indicate slightly softer
2)In most of the studies presented in this note, the effect of the jet mass is very small and pseudo-rapidity is used instead of rapidity in order to maintain the desired geometrical interpretation. Only in the detailed studies of the jet internal profile presented in Section 5.2 rapidity units are employed.
distributions in data compared to the MC predictions. In both cases, the MC distributions have been normalized to the number of jets present in the data.
R < 0.6 of jet
∆ within
track
N
0 5 10 15 20 25
Number of jets
1 10 102
jets R=0.6 anti-kt
MC non-diffractive minimum bias = 900 GeV s Data
ATLAS Preliminary
(a)
[GeV]
Jet pT
5 10 15 20 25 30
R < 0.6 of jet axis∆> within track<N
0 1 2 3 4 5 6 7 8
jets R=0.6 anti-kt
MC non-diffractive minimum bias = 900 GeV s Data
ATLAS Preliminary
(b)
Figure 1: (a) Distribution of the number of charged tracks matched to the calorimeter jet,Ntrackand (b) the correlation ofNtrackwith pTjet.
5 Study of Jet Profiles
5.1 Jet Width
The transverse size of the jet can be characterized in terms of the jet widthwjet, defined as the weighted average distance of the jet constituents (towers) to the jet direction, wjet=∑(r×ETtower)/∑ETtower, where r=p
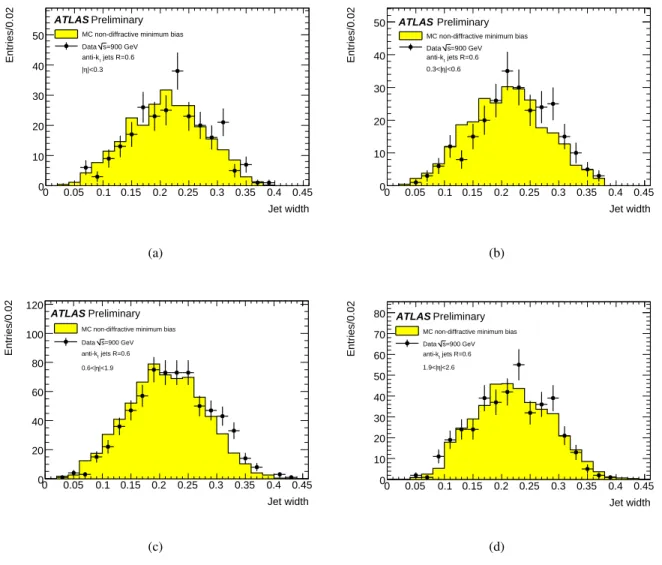
(φ tower−φ jet)2+ (ηtower−ηjet)2,ETtoweris the transverse energy of the calorimeter tower, and the sum runs over the towers associated to the jet by the jet algorithm. Figure 3 presents the measured jet width distribution for an inclusive selection of jets within|η|<2.6 and Figure 4 distinguishes this distribution for severalη ranges, each withpTjet>7 GeV. The shapes of the width distributions are well described by the predictions from the non-diffractive MC simulation, although the data seem to favor slightly wider jets in the centralηranges, particularly in the region 0.6<|η|<1.9.
5.2 Jet Internal Profiles
The internal structure of jets at colliders has been previously studied in terms of jet shapes [9] or trans- verse energy profiles using jet constituents inside the jet cone. These observables have demonstrated their sensitivity to a proper understanding of the jet fragmentation process, the detector response to low energy particles, and the accurate treatment of soft underlying event and pile-up contributions within the jet calibration procedure. The differential jet profile (see Figure 5) is defined as the average jet transverse
R < 0.6 of jet [GeV]
∆ of tracks within Sum pT
0 10 20 30 40 50
Number of jets
1 10
102 anti-kt jets R=0.6
MC non-diffractive minimum bias = 900 GeV s Data
ATLAS Preliminary
(a)
R < 0.6 of jet
∆ for tracks within
track
f
0 0.2 0.4 0.6 0.8 1 1.2 1.4 1.6 1.8 2
Number of jets
0 20 40 60 80 100 120 140 160 180
jets R=0.6 anti-kt
MC non-diffractive minimum bias = 900 GeV s Data
ATLAS Preliminary
(b)
Figure 2: (a) Total track momentum matched to the calorimeter jet, ∑pTtrackand (b) the ratio of charged particle momentum to calorimeter jet momentum, ftrack.
Jet width 0 0.05 0.1 0.15 0.2 0.25 0.3 0.35 0.4 0.45
Entries/0.02
0 50 100 150 200 250 300
MC non-diffractive minimum bias
=900 GeV s Data
jets R=0.6 anti-kt
|<2.6 η
|
ATLAS Preliminary
Figure 3: Measured jet width distribution in minimum bias data compared to Monte Carlo simulations for an inclusive selection of jets within|η|<2.6.
momentum that lies inside an annulus of inner radiusr−∆r/2 and outer radiusr+∆r/2 around the jet axis:
< 1
(2πr) d pT
dr >jets= 1 A
1 Njet ∑
jets
pT(r−∆r/2,r+∆r/2), 0≤r≤R, (1) where pT denotes the scalar sum of the transverse momentum of either calorimeter towers or tracks in
Jet width 0 0.05 0.1 0.15 0.2 0.25 0.3 0.35 0.4 0.45
Entries/0.02
0 10 20 30 40
50 MC non-diffractive minimum bias
=900 GeV s Data
jets R=0.6 anti-kt
|<0.3 η
|
ATLAS Preliminary
(a)
Jet width 0 0.05 0.1 0.15 0.2 0.25 0.3 0.35 0.4 0.45
Entries/0.02
0 10 20 30 40 50
MC non-diffractive minimum bias
=900 GeV s Data
jets R=0.6 anti-kt
|<0.6 η 0.3<|
ATLAS Preliminary
(b)
Jet width 0 0.05 0.1 0.15 0.2 0.25 0.3 0.35 0.4 0.45
Entries/0.02
0 20 40 60 80 100 120
MC non-diffractive minimum bias
=900 GeV s Data
jets R=0.6 anti-kt
|<1.9 η 0.6<|
ATLAS Preliminary
(c)
Jet width 0 0.05 0.1 0.15 0.2 0.25 0.3 0.35 0.4 0.45
Entries/0.02
0 10 20 30 40 50 60 70 80
MC non-diffractive minimum bias
=900 GeV s Data
jets R=0.6 anti-kt
|<2.6 η 1.9<|
ATLAS Preliminary
(d)
Figure 4: Measured jet width distribution in minimum bias data compared to Monte Carlo simulations for (a) the central region|η|<0.3, (b) 0.3<|η|<0.6, (c) 0.6<|η|<1.9, and (d) 1.9<|η|<2.6.
Jet
R r ∆r
Figure 5: Sketch of the jet profile as a function of the distance to the jet axis.
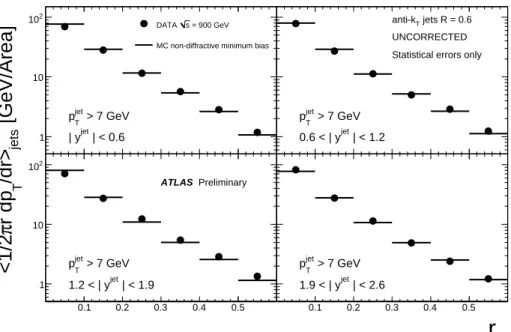
a given annulus with area A, Njet is the number of jets, R=0.6, and ∆r=0.1 is used. In this study, events are also required to have a reconstructed primary vertex withz-position within 10 cm around the the origin of the coordinate system. Figure 6 shows the measured jet profiles using calorimeter towers for jets in different jet rapidity regions up to|yjet|=2.6. The jet profiles present the expected shape with a prominent peak at lowr which indicates that the majority of the jet momentum is concentrated in the core of the jet. Similarly, jet profiles are reconstructed using tracks inside the jets, for which the track
[GeV/Area] jets/dr> Tr dpπ<1/2
r
0.1 0.2 0.3 0.4 0.5
1 10
102 DATA s = 900 GeV
MC non-diffractive minimum bias
> 7 GeV
jet
pT
| < 0.6
| yjet
0.1 0.2 0.3 0.4 0.5
1 10 102
> 7 GeV
jet
pT
| < 1.9 1.2 < | yjet
ATLAS Preliminary
0.1 0.2 0.3 0.4 0.5
1 10 102
> 7 GeV
jet
pT
| < 1.2 0.6 < | yjet
jets R = 0.6 anti-kT
UNCORRECTED Statistical errors only
0.1 0.2 0.3 0.4 0.5
1 10 102
> 7 GeV
jet
pT
| < 2.6 1.9 < | yjet
Figure 6: Measured jet profiles using calorimeter towers for jets with pTjet>7 GeV in different |yjet| regions. The data are compared to Monte Carlo simulations.
selection follows that described in Section 3.2. Figure 7 presents the measured jet profiles compared to Monte Carlo simulation. In this case, the measurements are limited to jets with|yjet|<1.9, as dictated by a maximal tracking coverage of|η|<2.5. The data are reasonably well described by the Monte Carlo simulation, although the MC tends to predict slightly narrower jets than the data, in agreement with the observation based on the jet widths presented in Section 5.1.
6 Summary
In summary, we report preliminary results on the study of jet properties using samples of minimum bias data collected by the ATLAS experiment at √
s=900 GeV. The measurements are not corrected for detector effects and no attempt is made to account for systematic uncertainties. The measured distribu- tions of charged tracks inside the jets and the jet energy profiles are compared to predictions from Monte Carlo simulated events. The simulation provides a reasonable description of the data. The remaining differences could be attributed to deficiencies on the current understanding of the detector response, the noise description, or the modeling of soft hadronic activity and fragmentation processes in the Monte Carlo simulations.
[GeV/Area] jets/dr> Tr dpπ<1/2
r
0.1 0.2 0.3 0.4 0.5
1 10
102 DATA s = 900 GeV
MC non-diffractive minimum bias
| < 0.6
| yjet
0.1 0.2 0.3 0.4 0.5
1 10 102
| < 1.9 1.2 < | yjet
ATLAS Preliminary
0.1 0.2 0.3 0.4 0.5
1 10 102
| < 1.2 0.6 < | yjet
jets R = 0.6 anti-kT
UNCORRECTED Statistical errors only
0.1 0.2 0.3 0.4 0.5
1 10 102
Tracks inside jet cone > 7 GeV
jet
pT
Figure 7: Measured jet profiles using tracks for jets with pTjet>7 GeV in different|yjet|regions. The data are compared to Monte Carlo simulations.
References
[1] The ATLAS Collaboration, Jet kinematic distributions in soft proton-proton collisions at √ s = 900 GeV with the ATLAS detector (2010) .
[2] T. Sj¨ostrandet al., Comp. Phys. Comm.135, 238 (2001) .
[3] The ATLAS Collaboration, ATLAS Monte Carlo tunes for MC09, ATL-PHYS-PUB-2010-002 (2010) .
[4] S. Agostinelliet al., Nucl. Instrum. Methods A506, 250 (2003) .
[5] M. Cacciari, G. P. Salam and G. Soyez, JHEP 0804 (2008) 063. [arXiv:0802.1189] .
[6] The ATLAS Collaboration, Inputs to Jet Reconstruction and Calibration with the ATLAS Detector Using Proton-Proton Collisions at√
s=900 GeV (2010) .
[7] The ATLAS Collaboration, Expected performance of the ATLAS experiment : detector, trigger and physics, CERN-OPEN-2008-020 (2008) .
[8] The ATLAS Collaboration, Charged-particle multiplicities in pp interactions at√
s=900 GeV mea- sured with the ATLAS detector at the LHC, CERN-PH-EP-2010-004 (2010) [arXiv:1003.3124] . [9] D. Acosta et al.(CDF Collaboration), Phys. Rev.D71112002 (2005)
J. Breitweg et al.(ZEUS Collaboration), Eur. Phys. J.C2, 61 (1998) R. Akers et al.(OPAL Collaboration), Z. Phys.C63, 197 (1994) .