A TLAS-CONF-2019-053 04 November 2019
ATLAS CONF Note
ATLAS-CONF-2019-053
1st November 2019
Measurement of azimuthal anisotropy of muons from charm and bottom hadrons in Pb + Pb collisions at √
s NN = 5.02 TeV with the ATLAS detector
The ATLAS Collaboration
Azimuthal anisotropies of muons from charm and bottom decays are measured in Pb+Pb collisions at √
s
NN= 5.02 TeV. The data were collected with the ATLAS detector at the Large Hadron Collider in 2015 and 2018 with integrated luminosities of 0.5 nb
−1and 1.4 nb
−1, respectively. The kinematic selection for heavy-flavor muons requires transverse momentum 4 < p
T< 30 GeV and pseudorapidity |η| < 2.0. The dominant sources of muons in this p
Trange are semi-leptonic decays of charm and bottom hadrons. These heavy-flavor muons are separated from light-hadron decay muons using the momentum imbalance between the tracking and muon spectrometers. Azimuthal anisotropies, quantified by flow coe ffi cients, are measured via the event-plane method for inclusive heavy-flavor muons as a function of the muon p
Tand in categories of Pb+Pb collision centrality. Heavy-flavor muons are separated into contributions from charm and bottom decays using the muon transverse impact parameter with respect to the event primary vertex. Non-zero elliptic (v
2) and triangular (v
3) flow coefficients are extracted for charm and bottom muons, with the charm muon coefficients higher than those for bottom muons for all Pb+Pb collision centralities. The results indicate substantial modification to the charm and bottom quark angular distributions via interactions in the quark-gluon plasma produced in these Pb+Pb collisions, with smaller modifications for the bottom quarks as expected theoretically due to their larger mass.
c
2019 CERN for the benefit of the ATLAS Collaboration.
Reproduction of this article or parts of it is allowed as specified in the CC-BY-4.0 license.
1 Introduction
The paradigm for the time evolution of heavy ion collisions at the Relativistic Heavy Ion Collider (RHIC) and the Large Hadron Collider (LHC) involves the formation and hydrodynamic expansion of a region of hot and dense quark-gluon plasma (QGP) with a small ratio of the shear viscosity to entropy density. In this paradigm, the QGP is considered to be a nearly-perfect fluid [1, 2]. Initial geometric inhomogeneities of the QGP are translated into momentum anisotropies for the final-state hadrons via large pressure gradients.
Extensive measurements of light hadron azimuthal anisotropies have been made where the single particle anisotropy is expressed in terms of a Fourier expansion:
dN
dφ ∝ 1 + 2
∞
X
n=1
v
ncos(n(φ − Ψ
n)), (1)
where the event plane angle, Ψ
n, specifies the orientation of the initial density profile in the transverse plane [3], and Fourier coe ffi cients, v
n, quantify the magnitude of the modulation with respect to the event plane angle. The second and third order v
nare referred to as elliptic (v
2) and triangular (v
3) flow coefficients, respectively, with the term “flow” invoking the nearly perfect fluid paradigm.
Heavy-flavor charm and bottom quarks have masses much larger than the temperature of the QGP (m
c,b> T ), with maximum temperatures at early times ranging from T = 300–500 MeV [4]. Thus, thermal production of heavy quarks during the QGP phase is highly suppressed. Instead, heavy quarks are produced at the earliest times via high-momentum transfer collisions between incoming partons. Once created the heavy quarks are preserved through the time evolution of the QGP and thus act as sensitive probes of the medium.
Radiative energy loss of heavy quarks in the QGP is suppressed relative to that of light quarks [5], though it was still postulated that charm quarks would interact strongly enough to flow with the QGP [6].
Experimental data at RHIC and then at the LHC revealed that heavy-quark hadrons, and their decay leptons, have transverse momentum (p
T) distributions that are strongly modified by the QGP. These hadrons and leptons are also observed to have significant azimuthal anisotropies, as the heavy quarks are pushed in the plasma to follow a similar flow pattern as the plasma itself. For reviews of heavy-flavor measurements in heavy ion collisions see Refs. [7, 8].
For p
T. 4 − 6 GeV, it was proposed that heavy quarks can be described via a Langevin approach with drag and di ff usion terms [9]. Modified p
Tdistributions and azimuthal anisotropies of D mesons have been used to constrain heavy-quark transport coefficients [10, 11]. At higher momentum p
T& 6 GeV, heavy-quark energy loss is thought to dominate, with collisional and induced radiative processes both contributing [12]. There are numerous theoretical predictions for the azimuthal anisotropies of bottom quarks, see for example Refs [13–15]; however, only limited experimental data are currently available.
The flow coe ffi cients v
2, v
3, and v
4of inclusive heavy-flavor muon production, which includes muons from charm hadron decays (charm muons) and muons from bottom hadron decays (bottom muons), have been measured by the ATLAS experiment in Pb+Pb collisions at √
s
NN= 2.76 TeV [16]. The measurement
indicates significant elliptic flow for heavy-flavor muons with 4 < p
T< 14 GeV. Recently, heavy-flavor
muon v
2has also been measured in high-multiplicity 13 TeV proton–proton (pp) collisions [17]. The pp
measurement separated muons from charm and muons from bottom decay, finding a non-zero v
2for charm
muons while the v
2for bottom muons is consistent with zero within uncertainties.
In this measurement, the procedure of the previous 2.76 TeV Pb + Pb analysis using the event-plane method is followed [18]. This measurement extends the previously published ones to the higher 5.02 TeV Pb+Pb energy with the high statistics provided by the 2015 and 2018 combined data sets. The larger data sample enables measurements over a larger momentum range 4 < p
T< 30 GeV for inclusive heavy-flavor muons.
It also allows the separation of the inclusive heavy-flavor muons into charm and bottom contributions.
Results for charm and bottom muon elliptic v
2and triangular v
3flow coe ffi cients are shown as a function of muon p
Tin various categories of degree of overlap between the colliding nuclei, referred to as centrality.
2 ATLAS detector
The ATLAS experiment [19] at the LHC is a multi-purpose particle detector with a forward–backward sym- metric cylindrical geometry and a near 4π coverage in solid angle.
1It consists of an inner tracking detector surrounded by a thin superconducting solenoid providing a 2 T axial magnetic field, electromagnetic and hadron calorimeters, and a muon spectrometer. The inner tracking detector (ID) covers the pseudorapidity range |η| < 2.5. It consists of silicon pixel, silicon microstrip, and transition radiation tracking (TRT) detectors. The calorimeter system covers the pseudorapidity range |η| < 4.9. Within the region |η| < 3.2, electromagnetic calorimetry is provided by barrel and endcap high-granularity lead/liquid-argon (LAr) calorimeters, with an additional thin LAr presampler covering |η| < 1.8, to correct for energy loss in mater- ial upstream of the calorimeters. Hadronic calorimetry is provided by the steel / scintillating-tile calorimeter, segmented into three barrel structures within |η| < 1.7, and two copper/LAr hadronic endcap calorimeters.
The solid angle coverage is completed with forward copper/LAr and tungsten/LAr calorimeter modules (FCal) optimised for electromagnetic and hadronic measurements respectively. The muon spectrometer (MS) comprises separate trigger and high-precision tracking chambers, covering |η| < 2.4 and |η| < 2.7 respectively, and measures the deflection of muons in a magnetic field generated by superconducting air-core toroids. The field integral of the toroids ranges between 2.0 and 6.0 T m across most of the detector.
The minimum-bias trigger scintillator (MBTS) detects charged particles over 2.07 < |η| < 3.86 using two hodoscopes of 12 counters positioned at z = ±3.6 m. The zero-degree calorimeters (ZDC) measure neutral particles at pseudorapidities |η| ≥ 8.3 and consist of layers of alternating quartz rods and tungsten plates. A two-level trigger system is used to select events. The first-level trigger (L1) is implemented in hardware and uses a subset of the detector information to reduce the accepted rate to at most nearly 100 kHz. This is followed by a software-based high level trigger (HLT) stage that reduces the accepted event rate to 1–4 kHz depending on the data-taking conditions during Pb + Pb collisions.
3 Event selection
Data used in this analysis were recorded by the ATLAS detector in 2015 and 2018 for Pb+Pb collisions at
√ s
NN= 5.02 TeV with integrated luminosities of 0.5 nb
−1and 1.4 nb
−1, respectively. Data were selected using a set of muon triggers that requires a muon at the HLT stage with p
Tlarger than 3, 4, 6, or 8 GeV, with the same corresponding L1 thresholds [20]. The muon trigger with 8 GeV p
Tthreshold samples the full luminosity in both 2015 and 2018, while triggers with lower p
Tthresholds have di ff erent prescale
1ATLAS uses a right-handed coordinate system with its origin at the nominal interaction point (IP) in the center of the detector and thez-axis along the beam pipe. Thex-axis points from the IP to the center of the LHC ring, and they-axis points upwards.
Cylindrical coordinates (r, φ) are used in the transverse plane,φbeing the azimuthal angle around thez-axis. The pseudorapidity is defined in terms of the polar angleθasη=−ln tan(θ/2). Angular distance is measured in units of∆R≡p
(∆η)2+(∆φ)2.
values, and thus the higher threshold triggers are utilized at given muon p
Tfor sampling a larger fraction of the full luminosity. Muon triggered events are further required to satisfy offline minimum bias (MinBias) Pb + Pb collision criteria based on the combination of Σ E
FCalT, the total transverse energy measured in the FCal, and ZDC energy.
The Pb+Pb events are then characterized by centrality via the Σ E
TFCal. For the results shown here, the MinBias Σ E
FCalTdistribution is divided into percentiles ordered from the most central (large Σ E
FCalT, small impact parameter) to the most peripheral (small Σ E
TFCal, large impact parameter): 0-10%, 10-20%, 20-30%, 30-40%, and 40-60%. A Monte Carlo Glauber [21] calculation is used to characterize each centrality interval [22]. The above centrality intervals have an average number of participating nucleons hN
parti = 358.8 ± 2.3, 264.1 ± 2.9, 189.2 ± 2.8, 131.4 ± 2.6, and 70.5 ± 2.2 respectively.
Muons with 4 < p
T< 30 GeV and |η| < 2.0 reconstructed in both the ID and the MS are selected and required to pass “MEDIUM” selection requirements, detailed in Ref. [23], without any requirement on number of TRT hits, due to the high occupancy in heavy-ion running. Candidate muons are required to be matched with a muon reconstructed by the event trigger. Each muon is assigned a weight given by the inverse of the reconstruction and trigger e ffi ciency for the specific muon kinematics.
The muon reconstruction and trigger efficiencies are determined using J/ψ → µ
+µ
−tag-and-probe method as detailed in Ref. [23]. The ID reconstruction e ffi ciency is obtained from Pb + Pb data directly, while the MS reconstruction e ffi ciency is obtained from both Pb + Pb data and simulations of J/ψ and in P ythia 8 [24]
with the CTEQ6L1 [25] parton distributions overlaid with Pb+Pb minimum-bias events, using the same tag-and-probe method. The events in overlay simulations are then given a weight factor such that the Σ E
TFCaldistribution matches the muon triggered Pb + Pb data distribution. The e ffi ciency obtained from simulation is used as the central value for correction, with an additional data-to-MC scale factors applied to account for residual di ff erences between data and overlay simulation. The same J/ψ → µ
+µ
−tag- and-probe method is used to determine muon trigger e ffi ciency. The central value of the single muon trigger efficiency correction is obtained from simulations without overlaying Pb+Pb minimum-bias events, and additional correction factors are obtained from data and applied to selection to correct for trigger detector performance di ff erence in data and simulation, as well as the centrality dependence of muon trigger efficiency in Pb+Pb data.
4 Analysis procedure
The analysis follows the event-plane method for measuring flow coefficients used in previous ATLAS
measurements [16, 22] and is briefly summarized here. Each Pb + Pb event has a geometric orientation
of the impact parameter vector, and the evetn can also have a tilt relative to that due to fluctuations in
the geometry of the resulting QGP. In Pb+Pb collisions one can determine the orientation, represented
by event plane angle Ψ
n, of the produced matter event-by-event with good accuracy. The azimuthal
distribution of transverse energy deposited in the forward and backward rapidity FCal is used to determine
the event plane. A comparison of event planes, as measured separately in the forward-rapidity FCal and
the backward-rapidity FCal, enables a determination of the event-plane resolution Res{n Ψ
n} as detailed in
Ref. [22]. In each Pb+Pb centrality interval and in each muon p
Tselection, the muons are divided into a
finite number of bins in φ − Ψ
n, where φ is the azimuthal angle of the muon and Ψ
nis the FCal determined
n
thorder event plane orientation. As di ff erent harmonic orders are orthogonal to each other, the Fourier decomposition of the angular distribution as introduced in Eq. 1 at a given order n can be expressed as:
1 N
XµdN
µXd(n(φ − Ψ
n)) =
1 + 2v
rawncos n(φ − Ψ
n)
; (2)
where v
rawnare the raw flow coefficients and N
Xµare the extracted yields for muons of interest. Three types of signal are considered in this measurement (X = charm, bottom, and inclusive heavy-flavor).
The final v
ncoe ffi cients are obtained by correcting for the event-plane resolution: v
n= v
rawn/Res{n Ψ
n}.
The leading sources of background contribution in the selected muon samples are muons from π and K decay-in-flight (π/K background) and muons from non-heavy-flavor components such as direct quarkonia, low-mass resonances, τ-leptons and W/Z decays (light / onia background). Other sources of background from hadronic showers, punch-through hadrons, and fake muons are found to be very small and only considered in systematic uncertainties.
Similar to previous ATLAS publications [16, 17, 26], di ff erent sources of muons are separated based on two variables. The first is the momentum imbalance, ρ = ( p
ID− p
MS)/p
ID, where p
IDis the muon momentum measured in the ID, and p
MSis that measured in the MS corrected for the energy loss inside the calorimeter. Di ff erent shapes of the ρ distribution for the π/K background and other muons enables the isolation of inclusive heavy-flavor muons. The analysis is repeated using the transverse momentum imbalance, as opposed to the total momentum imbalance ρ, and no difference is observed. The second variable is the transverse impact parameter, d
0, with respect to the event primary vertex. Charm and bottom muons have different d
0distributions due to different decay lengths of charm and bottom hadrons.
A two-step fit in ρ and d
0is performed in data based on ρ and d
0line-shape templates for di ff erent sources of muons obtained from simulation. First, the yields of inclusive heavy-flavor and π/K background muons are extracted from a fit to the ρ distribution. The relative yields of light/onia background to the inclusive heavy-flavor muons are fixed to the fractions obtained from P ythia 8 simulations. Then, with the extracted π/K background yields fixed, a fit to the d
0distribution is performed to determine the relative fraction of charm and bottom muons within the yields of inclusive heavy-flavor muons.
The muon ID momentum resolution in P ythia 8 simulations overlaid with minimum-bias Pb + Pb events is found to be worse than that in Pb + Pb data. Thus, the ρ templates are obtained from simulation without Pb+Pb event overlay. The single muon ID and MS momentum responses in Pythia8 simulation are shifted and smeared in order to match those in Pb + Pb data. The single muon momentum shift and smearing parameters are determined by comparing the invariant mass resolution of simulated J/ψ → µ
+µ
−in Pythia8 to that from Pb+Pb data at different centralities. The charm and bottom muon ρ templates are determined from hard QCD simulations, forcing either c¯ c or b b ¯ production from pp collisions at
√ s = 13 TeV in P ythia 8 with the A14 tune [27] and NNPDF23LO parton distribution functions [28]. The π/K background ρ templates are obtained from non-diffractive QCD process samples from pp collisions at √
s = 13 TeV in P ythia 8 also with the A14 tune and NNPDF23LO parton distribution functions. The ρ templates for light / onia background contribution are obtained from the direct J/ψ simulation in pp collisions at √
s = 5.02 TeV. No difference in the template shapes has been observed between simulations at √
s = 13 TeV and 5.02 TeV.
As the d
0resolution is sensitive to the event primary vertex resolution, the d
0templates are all obtained from P ythia 8 simulations at √
s = 5.02 TeV overlaid with minimum-bias Pb+Pb events to best match
the primary vertex resolution. The distributions of d
0are shifted and smeared to remove the residual
ρ
−0.2 −0.1 0 0.1 0.2 0.3 0.4
Weighted Events
0 10 20 30 40 50 60 70
103
×
< 7 GeV
µ
pT
6 <
| < 1 ηµ
0 < | 30-40%
ATLAS Preliminary
= 5.02 TeV sNN
Pb+Pb 0.3 - 1.9 nb-1
Data
Inclusive HF Muon /K Bkg π
Light/Onia Bkg MC Stat. Error
ρ
−0.2 −0.1 0 0.1 0.2 0.3 0.4
Weighted Events
0 5 10 15 20 25
103
×
< 14 GeV
µ
pT
12 <
| < 2 ηµ
1 < | 0-10%
ATLAS Preliminary
= 5.02 TeV sNN
Pb+Pb 0.3 - 1.9 nb-1
Data
Inclusive HF Muon /K Bkg π
Light/Onia Bkg MC Stat. Error
[mm]
d0
−0.4 −0.2 0 0.2 0.4
Weighted Events
10 102
103
104
105
106
107
ATLAS Preliminary
= 5.02 TeV sNN
Pb+Pb 0.3 - 1.9 nb-1
< 7 GeV
µ
pT
6 <
| < 1 ηµ
0 < | 30-40%
Data Bottom Muon Charm Muon
/K Bkg π
Light/Onia Bkg MC Stat. Error
[mm]
d0
−0.4 −0.2 0 0.2 0.4
Weighted Events
10 102
103
104
105
106
107 ATLAS Preliminary
= 5.02 TeV sNN
Pb+Pb 0.3 - 1.9 nb-1
< 14 GeV
µ
pT
12 <
| < 2 ηµ
1 < | 0-10%
Data Bottom Muon Charm Muon
/K Bkg π
Light/Onia Bkg MC Stat. Error
Figure 1: Example fits to ρ (top) and d
0(bottom) for muons with 6 < p
T< 7 GeV and 0 < |η| < 1 in 30 − 40%
centrality Pb+Pb collisions (left) and 12 < p
T< 14 GeV and 1 < |η| < 2 in 0 − 10% centrality Pb+Pb collisions (right).
di ff erence between overlay simulations and Pb + Pb data. The d
0shift and smearing parameters are found by comparing high-quality prompt track distributions between Pb+Pb data and overlay simulations. The charm and bottom muon d
0templates are obtained from hard QCD P ythia 8 simulations, the π/K background d
0templates are from non-di ff ractive QCD P ythia 8 simulations, and the templates for light / onia background are obtained from the direct J/ψ Pythia8 simulations. Additional reweighting is applied to the charm and bottom muon signal sample to match the input charm and bottom hadron p
Tspectra to those measured in Pb + Pb collisions [29, 30].
Examples of selected fits in ρ and d
0based on simulation templates are shown in Figure 1 for two different muon p
Tselections (6 < p
T< 7 GeV and 12 < p
T< 14 GeV). The fits are performed independently in two intervals of muon η and then combined to obtain charm, bottom and inclusive heavy-flavor muon yields in different p
T, centrality and n|φ − Ψ
n| intervals.
The top row of Figure 2 shows the inclusive heavy-flavor muon yield as a function of 2|φ − Ψ
2| (left) and
3|φ − Ψ
3| (right), and the bottom row shows the charm and bottom muon yields as a function of 2|φ − Ψ
2|
(left) and 3|φ − Ψ
3| (right). The lines indicate the second (left) and third (right) extracted Fourier harmonics
from which the v
raw2and v
raw3are extracted.
Ψ2
φ - 2
0 0.5 1 1.5 2 2.5 3
|)2Ψ - φ/d(2|µN dµN1/
0.2 0.25 0.3 0.35 0.4 0.45
Inclusive heavy-flavor muon Preliminary ATLAS
= 5.02 TeV sNN
Pb+Pb 0.3 - 1.9 nb-1
20-30%
< 6.0 GeV
µ
pT
5.5 <
< 2 ηµ
Ψ3
φ - 3
0 0.5 1 1.5 2 2.5 3
|)3Ψ - φ/d(3|µN dµN1/
0.26 0.28 0.3 0.32 0.34 0.36 0.38 0.4
Preliminary ATLAS
= 5.02 TeV sNN
Pb+Pb 0.3 - 1.9 nb-1
Inclusive heavy-flavor muon
0-10%
< 8.0 GeV
µ
pT
7.0 <
< 2 ηµ
Ψ2
φ - 2
0 0.5 1 1.5 2 2.5 3
|)2Ψ - φ/d(2|µN dµN1/
0.2 0.25 0.3 0.35 0.4 0.45
Preliminary ATLAS
= 5.02 TeV sNN
Pb+Pb 0.3 - 1.9 nb-1
20-30%
< 6.0 GeV
µ
pT
5.5 <
< 2 ηµ
bottom muon charm muon
Ψ3
φ - 3
0 0.5 1 1.5 2 2.5 3
|)3Ψ - φ/d(3|µN dµN1/
0.26 0.28 0.3 0.32 0.34 0.36 0.38 0.4
Preliminary ATLAS
= 5.02 TeV sNN
Pb+Pb 0.3 - 1.9 nb-1
0-10%
< 8.0 GeV
µ
pT
7.0 <
< 2 ηµ
bottom muon charm muon
Figure 2: Examples of Fourier decomposition to inclusive heavy-flavor muon yields (top) and bottom / charm muon yields (bottom) in Pb+Pb collisions at √
s
NN= 5.02 TeV as a function of 2 |φ − Ψ
2| (left) and 3 |φ − Ψ
3| (right) for two selected analysis intervals in different muon p
Tand different centralities. The inclusive heavy-flavor muon yields are obtained from ρ template fits, the error bars on data indicates the statistical uncertainties obtained from the ρ fit. The error bars on data indicate only the statistical uncertainties obtained from the ρ and d
0fits. The lines indicate the second (left) and third (right) extracted Fourier harmonics.
5 Systematic uncertainties
Systematic uncertainties are presented for di ff erent categories covering each step of the analysis procedure:
1) muon efficiency; 2) ρ fit; 3) d
0fit; 4) light/onia background; 5) other background; 6) ρ-d
0correlation; 7) event plane resolution; 8) jet bias. Table 1 summarizes the contributions of di ff erent sources of systematic uncertainties to the final flow coe ffi cient results. All sources of systematic uncertainty are summed in quadrature to determine the total uncertainty.
The systematic uncertainty from the MS reconstruction e ffi ciency and muon trigger e ffi ciency corrections are dominated by the uncertainty in determining the data-to-MC scale factor. The scale factor uncertainties are evaluated following the procedure from previous ATLAS measurements [23] including variations on the tag-and-probe e ffi ciency extraction method, object matching resolution, and the purity of the sample.
The systematic uncertainty on the muon trigger efficiency also includes the determination of the centrality
Table 1: Summary of the typical sizes of the absolute systematic uncertainties of each category for the flow coefficient results. d
0related systematic uncertainties are not relevant for the heavy-flavor inclusive flow measurements as the d
0fit is not utilized for these results. Systematic uncertainties from the event plane resolution and jet bias are negligible and not included in the final uncertainties, and therefore are not shown in the table.
Category inclusive heavy-flavor muon v
2(v
3) charm muon v
2(v
3) bottom muon v
2(v
3) Muon e ffi ciency < 0.0002 (0.0006) < 0.006 (0.001) < 0.001 (0.001)
ρ fit < 0.004 (0.006) < 0.009 (0.01) < 0.005 (0.003)
d
0fit N / A < 0.02 (0.03) < 0.01 (0.01)
light / onia bkg < 0.004 (0.002) < 0.02 (0.01) < 0.008 (0.004) other bkg < 0.000001 (0.000001) < 0.002 (0.004) < 0.001 (0.0004)
ρ-d
0correlation N / A < 0.01 (0.004) < 0.007 (0.005)
dependent correction factors. The uncertainty on the muon ID reconstruction e ffi ciency is evaluated by comparing the results with and without the ID efficiency correction, as the ID efficiency is approximately 99% efficient for all centralities.
The systematic uncertainty on the shifts and smearing parameters for single muon momentum response in simulation is evaluated by comparing the nominal results to those: 1) without any shifts or smearing, 2) only applying shifts and smearing to the signal muons, and 3) incorporating additional smearing to the background ρ distributions in simulation to match data distributions in the background-enriched region (ρ > 0.2). Resulting differences of these variations are combined in quadrature. The combined uncertainty from the ρ fit is 1%–10%, depending on muon p
Tfor charm and bottom muon results.
The uncertainty in the d
0template shift and smearing parameters is tested by comparing results when determining the parameters using 2018 data (as in the nominal results) to using the 2015 Pb+Pb data to cover the slightly di ff erent detector alignment between the two data sets. Sensitivity to the charm and bottom hadron p
Tspectra reweighting in Pb + Pb is covered by a variation of reweighting the p
Tspectra to those from Pythia8 simulations with any modification due to QGP. The variations in the results due to d
0template shift and smearing and p
Tspectra reweighting are considered as uncorrelated and combined in quadrature, and the combined systematic uncertainty is 1%–10%, depending on muon p
Tfor charm and bottom muon results.
The light / onia contribution is fixed with respect to the inclusive heavy-flavor muon contribution based on the P ythia 8 MC sample. The analysis is repeated to study this variation, first ignoring the light / onia contribution and then fixing it to twice the fraction predicted by Pythia8. As shown in Ref. [31], Pythia overestimates prompt quarkonium production at the LHC, and thus the variation on the light / onia contribu- tion is conservative. The maximum di ff erence in the two variations with respect to the nominal results is assigned as systematic uncertainty. For the nominal results, light/onia muons are assumed to have the same v
2and v
3as the inclusive heavy-flavor muons. The analysis is repeated with variations assuming light / onia muons having zero flow coe ffi cients or double the inclusive heavy-flavor muon flow coe ffi cients.
The resulting maximum difference is assigned as a systematic uncertainty.
The contribution of hadronic showers, punch-through hadrons and fake muons are ignored in the nominal analysis. They were included in the analysis based on ρ and d
0templates from Pythia8 simulation with a fixed relative fraction of a few percent obtained also from P ythia 8 simulation. The di ff erence with respect to the nominal is found to be negligible for the inclusive heavy-flavor muon flow coe ffi cients, and approximately 8% at low p
Tand less than 1% at high p
Tfor charm and bottom muon flow coefficients.
All muons are assumed to have independent ρ and d
0distributions in the nominal results, which is only true for signal muons. To test the sensitivity to this assumption, d
0fits in data are repeated with a requirement of ρ < 0.1 on the sample, thus significantly reducing the background contribution. The difference between results with and without the restriction on ρ is assigned as a systematic uncertainty to cover the systematic effect of ignoring background muon correlation.
The systematic uncertainty associated with the event plane angle resolution is evaluated by measuring the event plane resolution from two sub-regions of FCal (3.2 < |η| < 4.0 and 4.0 < |η| < 4.8) following previous analysis [22]. The systematic uncertainties are evaluated independently for Ψ
2and Ψ
3. The maximum di ff erence between these two variations and the nominal results is considered as a systematic uncertainty. The uncertainty of event plane angle resolution is found to be negligible compared to other systematic uncertainties, thus not included in the results.
The charm and bottom muons are often produced with a recoil jet. The orientation of Ψ
ncould be biased to align with the signal muon, if the recoil jet reaches the FCal [16]. The magnitude of this bias on muon v
2and v
3are studied with truth Pythia muon flow in samples overlaid with Pb+Pb data. The bias is found to be 0.3% − 0.4% for v
2and v
3, and it is larger in peripheral than more central events. This small potential bias is negligible and is not included as a systematic uncertainty.
6 Results
Figure 3 shows the inclusive heavy-flavor muon elliptic flow coefficient v
2as a function of p
Tin the 5.02 TeV Pb + Pb data. Each panel corresponds to a di ff erent Pb + Pb centrality interval. The v
2results decrease steadily with p
Tover the entire p
Trange and in all centrality intervals. The overall magnitude of v
2is smaller in the most central 0–10% selection, as expected since the corresponding smaller impact parameter Pb+Pb collisions have smaller initial geometric ellipticity.
Figure 4 shows the inclusive heavy-flavor muon triangular flow coe ffi cient v
3as a function of p
Tin the 5.02 TeV Pb+Pb data. Each panel corresponds to a different Pb+Pb centrality interval. The v
3results decrease steadily with p
Tover the entire p
Trange in all centrality intervals. The overall magnitude of the v
3is quite similar in all centrality intervals, as expected since triangular deformations of the initial geometry are the result of fluctuations and are unrelated to any intrinsic geometry from the colliding nuclei [32].
In each panel of Figures 3 and 4 previous ATLAS results from 2.76 TeV Pb + Pb data [16] are also presented.
The present 5.02 TeV results significantly improve the statistical precision of the measurement and enable
an extended p
Trange. The 5.02 and 2.76 TeV inclusive heavy-flavor muon v
2and v
3are consistent with
each other within uncertainties. Indeed, no significant di ff erences are expected between Pb + Pb collisions at
the two different energies according to hydrodynamical models [33], so the observed consistency between
2.76 and 5.02 TeV data is in agreement with expectations. The inclusive charged particle flow coefficients
are also measured to be nearly identical at the two collision energies [22].
Preliminary
ATLAS0.3 - 1.9 nb
-1Inclusive heavy-flavor muon < 2
ηµ
2015+2018 Pb+Pb 5.02 TeV 2011 Pb+Pb 2.76 TeV
[GeV]
pT 4 5 6 7 8 910 20 30 40
2v
0 0.02 0.04 0.06 0.08 0.1 0.12
0-10%
[GeV]
pT 4 5 6 7 8 910 20 30 40
2v
0 0.02 0.04 0.06 0.08 0.1 0.12
10-20%
[GeV]
pT 4 5 6 7 8 910 20 30 40
2v
0 0.02 0.04 0.06 0.08 0.1 0.12
20-30%
[GeV]
pT 4 5 6 7 8 910 20 30 40
2v
0 0.02 0.04 0.06 0.08 0.1 0.12
30-40%
[GeV]
pT 4 5 6 7 8 910 20 30 40
2v
0 0.02 0.04 0.06 0.08 0.1 0.12
40-60%
Figure 3: Inclusive heavy-flavor muon v
2as a function of p
Tin the combined 2015 and 2018 5.02 TeV Pb + Pb data compared with the results in the 2.76 TeV Pb + Pb data measurements [16]. Statistical uncertainties are shown as vertical lines and systematic uncertainties as boxes for the 5.02 TeV results. For better visibility statistical and systematic uncertainties on the 2.76 TeV data are combined in quadrature and shown as vertical lines. Each panel represents a di ff erent centrality interval.
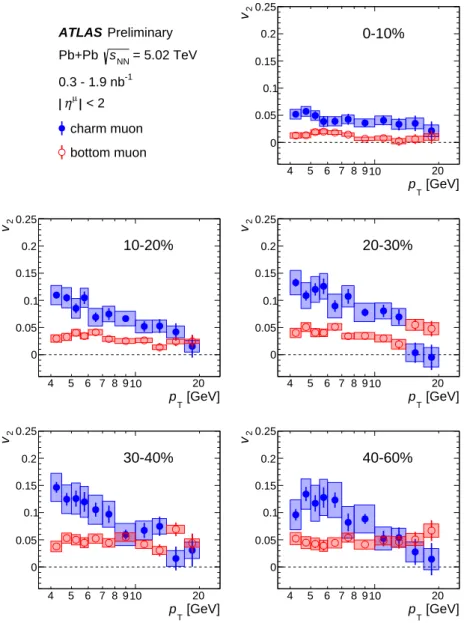
Figure 5 shows the separated charm and bottom muon v
2as a function of p
T, with each panel presenting a
di ff erent Pb + Pb centrality. The charm and bottom flow coe ffi cients are extracted only up to p
T= 20 GeV,
since above that momentum range the inclusive heavy-flavor v
2values are small and the charm-to-bottom
separation procedure becomes sensitive to fluctuations in data and yields unstable results. The results
indicate a non-zero v
2for both charm and bottom muons, with a substantially larger elliptic flow coe ffi cient
for charm muons. The statistical and systematic uncertainties have a significant contribution that is
anti-correlated between the charm and bottom v
2, i.e. a fluctuation up in the charm v
2in a particular p
Tbin
will be correlated with a fluctuation down in the bottom v
2in the same bin and vice versa. Qualitatively,
the charm and bottom v
2ordering matches theoretical expectations where the heavier bottom quarks have
Preliminary
ATLAS0.3 - 1.9 nb
-1Inclusive heavy-flavor muon < 2
ηµ
2015+2018 Pb+Pb 5.02 TeV 2011 Pb+Pb 2.76 TeV
[GeV]
pT 4 5 6 7 8 910 20 30 40
3v
−0.06
−0.04
−0.02 0 0.02 0.04 0.06
0-10%
[GeV]
pT 4 5 6 7 8 910 20 30 40
3v
−0.06
−0.04
−0.02 0 0.02 0.04 0.06
10-20%
[GeV]
pT 4 5 6 7 8 910 20 30 40
3v
−0.06
−0.04
−0.02 0 0.02 0.04 0.06
20-30%
[GeV]
pT 4 5 6 7 8 910 20 30 40
3v
−0.06
−0.04
−0.02 0 0.02 0.04 0.06
30-40%
[GeV]
pT 4 5 6 7 8 910 20 30 40
3v
−0.06
−0.04
−0.02 0 0.02 0.04 0.06
40-60%
Figure 4: Inclusive heavy-flavor muon v
3as a function of p
Tin the combined 2015 and 2018 5.02 TeV Pb + Pb data compared with the results in the 2.76 TeV Pb + Pb data measurements [16]. Statistical uncertainties are shown as vertical lines and systematic uncertainties as boxes for the 5.02 TeV results. For better visibility statistical and systematic uncertainties on the 2.76 TeV data are combined in quadrature and shown as vertical lines. Each panel represents a di ff erent centrality interval.
a smaller modification to their initial momentum trajectories due to the larger mass. Light quarks and heavy quarks can lose energy in traversing the QGP via induced gluon bremsstrahlung; however, heavy quarks with momentum less than or approximately equal to the quark mass (p
T. m) radiate less than lighter quarks due to a suppression of radiation at small angles relative to the quark direction, referred to as the “dead-cone” e ff ect [5]. Thus the heavier bottom quarks at lower momentum are expected to lose less energy in the QGP and thus have a smaller azimuthal anisotropy.
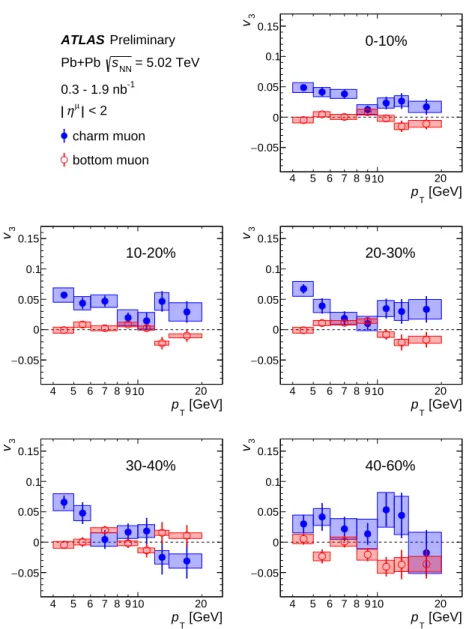
Figure 6 shows the separated charm and bottom muon v
3as a function of p
T, with each panel presenting a
di ff erent Pb + Pb centrality interval. The charm muons show significant non-zero v
3with values independent
of centrality. The bottom muons have a v
3at all p
Tand in all centrality intervals that is significant below that of charm muons.
Preliminary
ATLAS= 5.02 TeV
sNNPb+Pb 0.3 - 1.9 nb
-1< 2
ηµcharm muon bottom muon
[GeV]
pT
4 5 6 7 8 910 20
2v
0 0.05 0.1 0.15 0.2 0.25
0-10%
[GeV]
pT
4 5 6 7 8 910 20
2v
0 0.05 0.1 0.15 0.2 0.25
10-20%
[GeV]
pT
4 5 6 7 8 910 20
2v
0 0.05 0.1 0.15 0.2 0.25
20-30%
[GeV]
pT
4 5 6 7 8 910 20
2v
0 0.05 0.1 0.15 0.2 0.25
30-40%
[GeV]
pT
4 5 6 7 8 910 20
2v
0 0.05 0.1 0.15 0.2 0.25
40-60%
Figure 5: Charm and bottom muon v
2as a function of p
Tin the combined 2015 and 2018 5.02 TeV Pb + Pb data.
Statistical uncertainties are shown as vertical lines and systematic uncertainties as boxes for charm and bottom muons. The charm and bottom uncertainties are partially anti-correlated. Each panel presents a di ff erent centrality interval.
Figure 7 shows the ATLAS v
2results for charm and bottom decay muons in the Pb + Pb 0–10% (left) and
40–60% (right) centrality interval in comparison with theoretical calculations, dreena-b from Ref. [14],
and dab - mod from Ref. [13, 34]. The dreena - b calculation includes radiative and collisional energy loss of
the heavy quarks traversing the QGP, modeled via 1 + 1D Bjorken expansion [35]. The predicted D meson
v
2is higher than the B meson v
2with the two converging at p
T≈ 25 GeV as expected when the p
Tis much
larger than the charm and bottom quark masses. Using P ythia for decay kinematics, the charm muon and
bottom muon v
2results are calculated and shown. The predominant e ff ect in going from the parent meson
Preliminary
ATLAS= 5.02 TeV
sNNPb+Pb 0.3 - 1.9 nb
-1< 2
ηµcharm muon bottom muon
[GeV]
pT
4 5 6 7 8 910 20
3v
−0.05 0 0.05 0.1 0.15
0-10%
[GeV]
pT
4 5 6 7 8 910 20
3v
−0.05 0 0.05 0.1 0.15
10-20%
[GeV]
pT
4 5 6 7 8 910 20
3v
−0.05 0 0.05 0.1 0.15
20-30%
[GeV]
pT
4 5 6 7 8 910 20
3v
−0.05 0 0.05 0.1 0.15
30-40%
[GeV]
pT
4 5 6 7 8 910 20
3v
−0.05 0 0.05 0.1 0.15
40-60%
Figure 6: Charm and bottom muon v
3as a function of p
Tin the combined 2015 and 2018 5.02 TeV Pb + Pb data.
Statistical uncertainties are shown as vertical lines and systematic uncertainties as boxes for charm and bottom muons. The charm and bottom uncertainties are partially anti-correlated. Each panel presents a di ff erent centrality interval.
v
2(p
T) to the daughter muon v
2( p
T) is a shift downward in p
T. The predictions are in reasonable agreement with the experimental data, though somewhat over-predicting the v
2at high p
Tof bottom in central events.
The dab - mod framework includes a Langevin drag and di ff usion component as well as energy loss. The
curves shown here are run with Trento initial geometry conditions [36], a heavy quark Langevin dynamics
with the Moore and Teaney parameterization [9], and coupling values for charm (bottom) of D/2πT =
2.23 (2.79). The heavy-quark-to-medium decoupling temperature is T = 160 MeV and both coalescence
and fragmentation are implemented for hadronization. The predictions are qualitatively similar to the
dreena - b results for p
T> 10 GeV, but with v
2values roughly a factor of two lower for charm and bottom
muons. At lower p
T, the dreena - b v
2results rise significantly. A key component of these calculations is
0 5 10 15 20 25 [GeV]
pT
0 0.02 0.04 0.06 0.08 0.1 0.12
2v
DAB-MOD µ
→ D
µ
→ B 5.02 TeV Pb+Pb 0-10%
< 2 ηµ -1, 0.3 - 1.9 nb
Preliminary ATLAS
charm muon bottom muon DREENA-B
µ
→ D
µ
→ B
0 5 10 15 20 25
[GeV]
pT
0 0.05 0.1 0.15 0.2
2v
DAB-MOD µ
→ D
µ
→ B 5.02 TeV Pb+Pb 40-60%
< 2 ηµ -1, 0.3 - 1.9 nb
Preliminary ATLAS
charm muon bottom muon DREENA-B
µ
→ D
µ
→ B
Figure 7: Charm and bottom muon v
2as a function of p
Tin the 5.02 TeV Pb + Pb data for the 0–10% (left) and 40–60% (right) centrality interval, compared to theoretical predictions based on dreena - b [14] and dab - mod [13, 34]
in the same centrality intervals for charm and bottom muon v
2. For the data, statistical uncertainties are shown as vertical lines and systematic uncertainties as boxes. The charm and bottom uncertainties are partially anti-correlated.
the modeling of the QGP transverse expansion, and thus it will be instructive in the future to compare the calculations with a common QGP model to test if the differences arise from the QGP model or the energy loss implementation.
7 Conclusion
In summary, a measurement of elliptic and triangular flow coefficients for heavy-flavor decay muons in Pb+Pb collisions at 5.02 TeV is presented, including a separation between charm and bottom contributions.
The measurement uses a combined 2015 and 2018 data set corresponding to a total integrated luminosity of 1.9 nb
−1recorded by the ATLAS experiment at the LHC. The inclusive heavy-flavor muon v
2and v
3values measured in 4 < p
T< 30 GeV decrease with p
Tfor all centrality intervals. The v
2and v
3values are consistent within uncertainties with previous Pb + Pb measurements at 2.76 TeV. Further separating the inclusive heavy-flavor muons into charm and bottom muons reveals a significantly larger v
2and v
3for charm muons than for bottom muons. The results indicate that while both charm and bottom quarks have their trajectories and momenta modified when traversing the QGP, the e ff ect is stronger for the charm quarks. Theoretical calculations have a similar qualitative trend with smaller flow coe ffi cients for the muons from heavier bottom quark decays. The results can significantly discriminate between models of heavy-quark energy loss and constrain heavy-quark transport coe ffi cients in the QGP.
References
[1] P. Romatschke and U. Romatschke, Relativistic Fluid Dynamics In and Out of Equilibrium, Cam- bridge Monographs on Mathematical Physics, Cambridge University Press, 2019, isbn: 9781108651998, arXiv: 1712.05815 [nucl-th] (cit. on p. 2).
[2] U. Heinz and R. Snellings, Collective flow and viscosity in relativistic heavy-ion collisions, Ann.
Rev. Nucl. Part. Sci. 63 (2013) 123, arXiv: 1301.2826 [nucl-th] (cit. on p. 2).
[3] S. Voloshin and Y. Zhang, Flow study in relativistic nuclear collisions by Fourier expansion of Azimuthal particle distributions, Z. Phys. C 70 (1996) 665, arXiv: hep-ph/9407282 [hep-ph]
(cit. on p. 2).
[4] M. Habich, J. L. Nagle and P. Romatschke, Particle spectra and HBT radii for simulated central nuclear collisions of C + C, Al + Al, Cu + Cu, Au + Au, and Pb + Pb from √
s = 62.4 - 2760 GeV, Eur. Phys. J. C 75 (2015) 15, arXiv: 1409.0040 [nucl-th] (cit. on p. 2).
[5] Y. L. Dokshitzer and D. E. Kharzeev, Heavy quark colorimetry of QCD matter, Phys. Lett. B 519 (2001) 199, arXiv: hep-ph/0106202 [hep-ph] (cit. on pp. 2, 11).
[6] S. Batsouli, S. Kelly, M. Gyulassy and J. L. Nagle, Does the charm flow at RHIC?, Phys. Lett. B 557 (2003) 26, arXiv: nucl-th/0212068 [nucl-th] (cit. on p. 2).
[7] R. Averbeck, Heavy-flavor production in heavy-ion collisions and implications for the properties of hot QCD matter, Prog. Part. Nucl. Phys. 70 (2013) 159, arXiv: 1505.03828 [nucl-ex] (cit. on p. 2).
[8] X. Dong, Y.-J. Lee and R. Rapp, Open Heavy-Flavor Production in Heavy-Ion Collisions, (2019), arXiv: 1903.07709 [nucl-ex] (cit. on p. 2).
[9] G. D. Moore and D. Teaney, How much do heavy quarks thermalize in a heavy ion collision?, Phys.
Rev. C 71 (2005) 064904, arXiv: hep-ph/0412346 [hep-ph] (cit. on pp. 2, 13).
[10] S. Cao et al., Toward the determination of heavy-quark transport coe ffi cients in quark-gluon plasma, Phys. Rev. C 99 (2019) 054907, arXiv: 1809.07894 [nucl-th] (cit. on p. 2).
[11] R. Rapp, P. B. Gossiaux, A. Andronic, R. Averbeck and S. Masciocchi, Extraction of heavy-flavor transport coe ffi cients in QCD matter, Nucl. Phys. A 979 (2018) 21, arXiv: 1803.03824 [nucl-th]
(cit. on p. 2).
[12] S. Wicks, W. Horowitz, M. Djordjevic and M. Gyulassy, Elastic, inelastic, and path length fluctu- ations in jet tomography, Nucl. Phys. A 784 (2007) 426, arXiv: nucl-th/0512076 [nucl-th]
(cit. on p. 2).
[13] R. Katz, C. A. G. Prado, J. Noronha-Hostler, J. Noronha and A. A. P. Suaide, DAB-MOD sensitivity study of heavy flavor R
AAand azimuthal anisotropies based on beam energy, initial conditions, hadronization, and suppression mechanisms, (2019), arXiv: 1906.10768 [nucl-th] (cit. on pp. 2, 12, 14, 21, 22).
[14] D. Zigic, I. Salom, J. Auvinen, M. Djordjevic and M. Djordjevic, DREENA-B framework: first predictions of R
AAand v
2within dynamical energy loss formalism in evolving QCD medium, Phys.
Lett. B 791 (2019) 236, arXiv: 1805.04786 [nucl-th] (cit. on pp. 2, 12, 14, 20, 23).
[15] W. Ke, Y. Xu and S. A. Bass, Linearized Boltzmann-Langevin model for heavy quark transport in hot and dense QCD matter, Phys. Rev. C 98 (2018) 064901, arXiv: 1806.08848 [nucl-th]
(cit. on p. 2).
[16] ATLAS Collaboration, Measurement of the suppression and azimuthal anisotropy of muons from heavy-flavor decays in Pb + Pb collisions at √
s
NN= 2.76 TeV with the ATLAS detector, Phys. Rev.
C 98 (2018) 044905, arXiv: 1805.05220 [hep-ex] (cit. on pp. 2, 4, 5, 9–11).
[17] ATLAS Collaboration, Measurement of azimuthal anisotropy of muons from charm and bottom hadrons in pp collisions at √
s = 13 TeV with the ATLAS detector, (2019), arXiv: 1909.01650
[nucl-ex] (cit. on pp. 2, 5).
[18] ATLAS Collaboration, Measurement of jet fragmentation in Pb + Pb and pp collisions at √ s
NN= 2.76 TeV with the ATLAS detector at the LHC, Eur. Phys. J. C 77 (2017) 379, arXiv: 1702.00674 [hep-ex] (cit. on p. 3).
[19] ATLAS Collaboration, The ATLAS Experiment at the CERN Large Hadron Collider, JINST 3 (2008) S08003 (cit. on p. 3).
[20] ATLAS Collaboration, Performance of the ATLAS trigger system in 2015, Eur. Phys. J. C 77 (2017) 317, arXiv: 1611.09661 [hep-ex] (cit. on p. 3).
[21] M. L. Miller, K. Reygers, S. J. Sanders and P. Steinberg, Glauber modeling in high energy nuclear collisions, Ann. Rev. Nucl. Part. Sci. 57 (2007) 205, arXiv: nucl-ex/0701025 [nucl-ex] (cit. on p. 4).
[22] ATLAS Collaboration, Measurement of the azimuthal anisotropy of charged particles produced in
√ s
NN= 5.02 TeV Pb + Pb collisions with the ATLAS detector, Eur. Phys. J. C 78 (2018) 997, arXiv:
1808.03951 [hep-ex] (cit. on pp. 4, 9, 18, 19).
[23] ATLAS Collaboration, Muon reconstruction performance of the ATLAS detector in proton–proton collision data at √
s = 13 TeV, Eur. Phys. J. C 76 (2016) 292, arXiv: 1603 . 05598 [hep-ex]
(cit. on pp. 4, 7).
[24] T. Sjöstrand et al., An introduction to PYTHIA 8.2, Comput. Phys. Commun. 191 (2015) 159, arXiv:
1410.3012 [hep-ph] (cit. on p. 4).
[25] J. Pumplin et al., New generation of parton distributions with uncertainties from global QCD analysis, JHEP 07 (2002) 012, arXiv: hep-ph/0201195 [hep-ph] (cit. on p. 4).
[26] ATLAS Collaboration, Measurements of the electron and muon inclusive cross-sections in proton–
proton collisions at √
s = 7 TeV with the ATLAS detector, Phys. Lett. B 707 (2012) 438, arXiv:
1109.0525 [hep-ex] (cit. on p. 5).
[27] ATLAS Collaboration, ATLAS Pythia 8 tunes to 7 TeV data, ATL-PHYS-PUB-2014-021, 2014, url : https://cds.cern.ch/record/1966419 (cit. on p. 5).
[28] R. D. Ball et al., Parton distributions with LHC data, Nucl. Phys. B 867 (2013) 244, arXiv:
1207.1303 [hep-ph] (cit. on p. 5).
[29] CMS Collaboration, Nuclear modification factor of D
0mesons in PbPb collisions at √ s
NN= 5.02 TeV, Phys. Lett. B 782 (2018) 474, arXiv: 1708.04962 [hep-ex] (cit. on p. 6).
[30] ALICE Collaboration, Measurement of D
0, D
+, D
∗+and D
+sproduction in Pb-Pb collisions at
√ s
NN= 5.02 TeV, JHEP 10 (2018) 174, arXiv: 1804.09083 [nucl-ex] (cit. on p. 6).
[31] CMS Collaboration, Prompt and non-prompt J/ψ production in pp collisions at √
s = 7 TeV, Eur.
Phys. J. C 71 (2011) 1575, arXiv: 1011.4193 [hep-ex] (cit. on p. 8).
[32] B. Alver and G. Roland, Collision geometry fluctuations and triangular flow in heavy-ion collisions, Phys. Rev. C 81 (2010) 054905, arXiv: 1003.0194 [nucl-th], Erratum: Phys. Rev. C 82 (2010) 039903 (cit. on p. 9).
[33] W. Zhao, H. Xu and H. Song, Collective flow in 2.76 and 5.02 A TeV Pb + Pb collisions, Eur, Phys. J.
C 77 (2017) 645, arXiv: 1703.10792 [nucl-th] (cit. on p. 9).
[34] C. A. G. Prado et al., Event-by-event correlations between soft hadrons and D
0mesons in 5.02 TeV PbPb collisions at the CERN Large Hadron Collider, Phys. Rev. C 96 (2017) 064903, arXiv:
1611.02965 [nucl-th] (cit. on pp. 12, 14).
[35] J. D. Bjorken, Highly relativistic nucleus-nucleus collisions: The central rapidity region, Phys. Rev.
D 27 (1983) 140 (cit. on p. 12).
[36] J. S. Moreland, J. E. Bernhard and S. A. Bass, Alternative ansatz to wounded nucleon and binary collision scaling in high-energy nuclear collisions, Phys. Rev. C 92 (2015) 011901, arXiv: 1412.
4708 [nucl-th] (cit. on p. 13).
[37] CMS Collaboration, Measurement of Prompt D
0Meson Azimuthal Anisotropy in Pb-Pb collisions at √
s
NN= 5.02 TeV, Phys. Rev. Lett. 120 (2018) 202301, arXiv: 1708.03497 [hep-ex] (cit. on
p. 23).
Appendix
Preliminary
ATLAS= 5.02 TeV
sNNPb+Pb 0.3 - 1.9 nb
-1< 2
ηµcharm muon bottom muon Inclusive hadron
[GeV]
pT
4 5 6 7 8 910 20
2v
0 0.05 0.1 0.15 0.2 0.25
0-10%
[GeV]
pT
4 5 6 7 8 910 20
2v
0 0.05 0.1 0.15 0.2 0.25
10-20%
[GeV]
pT
4 5 6 7 8 910 20
2v
0 0.05 0.1 0.15 0.2 0.25
20-30%
[GeV]
pT
4 5 6 7 8 910 20
2v
0 0.05 0.1 0.15 0.2 0.25
30-40%
[GeV]
pT
4 5 6 7 8 910 20
2v
0 0.05 0.1 0.15 0.2 0.25
40-60%
Figure 8: Charm and bottom muon v
2as a function of p
Tin the combined 2015 and 2018 5.02 TeV Pb + Pb data in
comparison to inclusive hadron v
2in 2015 5.02 TeV Pb + Pb data [22] where the same centrality interval measurements
are available. Statistical uncertainties are shown as vertical lines and systematic uncertainties as boxes for charm
and bottom muons. The charm and bottom uncertainties are partially anti-correlated. Statistical and systematic
uncertainties of inclusive hadron results are combined in quadrature and shown as vertical lines. Each panel presents
a di ff erent centrality interval.
Preliminary
ATLAS= 5.02 TeV
sNNPb+Pb 0.3 - 1.9 nb
-1< 2
ηµcharm muon bottom muon Inclusive hadron
[GeV]
pT
4 5 6 7 8 910 20
3v
−0.05 0 0.05 0.1 0.15
0-10%
[GeV]
pT
4 5 6 7 8 910 20
3v
−0.05 0 0.05 0.1 0.15
10-20%
[GeV]
pT
4 5 6 7 8 910 20
3v
−0.05 0 0.05 0.1 0.15
20-30%
[GeV]
pT
4 5 6 7 8 910 20
3v
−0.05 0 0.05 0.1 0.15
30-40%
[GeV]
pT
4 5 6 7 8 910 20
3v
−0.05 0 0.05 0.1 0.15
40-60%
Figure 9: Charm and bottom muon v
3as a function of p
Tin the combined 2015 and 2018 5.02 TeV Pb + Pb data in
comparison to inclusive hadron v
3in 2015 5.02 TeV Pb + Pb data [22] where the same centrality interval measurements
are available. Statistical uncertainties are shown as vertical lines and systematic uncertainties as boxes for charm
and bottom muons. The charm and bottom uncertainties are partially anti-correlated. Statistical and systematic
uncertainties of inclusive hadron results are combined in quadrature and shown as vertical lines. Each panel presents
a di ff erent centrality interval.
0 5 10 15 20 25 [GeV]
pT
0 0.05 0.1 0.15 0.2
2v
5.02 TeV Pb+Pb 0-10%
< 2 ηµ -1, 0.3 - 1.9 nb
Preliminary ATLAS
charm muon bottom muon DREENA-B
D meson B meson µ
→ D →µ B
0 5 10 15 20 25
[GeV]
pT
0 0.05 0.1 0.15 0.2
2v
5.02 TeV Pb+Pb 10-20%
< 2 ηµ -1, 0.3 - 1.9 nb
Preliminary ATLAS
charm muon bottom muon DREENA-B
D meson B meson µ
→ D →µ B
0 5 10 15 20 25
[GeV]
pT
0 0.05 0.1 0.15 0.2
2v
5.02 TeV Pb+Pb 20-30%
< 2 ηµ -1, 0.3 - 1.9 nb
Preliminary ATLAS
charm muon bottom muon DREENA-B
D meson B meson µ
→ D →µ B
0 5 10 15 20 25
[GeV]
pT
0 0.05 0.1 0.15 0.2
2v
5.02 TeV Pb+Pb 30-40%
< 2 ηµ -1, 0.3 - 1.9 nb
Preliminary ATLAS
charm muon bottom muon DREENA-B
D meson B meson µ
→ D →µ B
0 5 10 15 20 25
[GeV]
pT
0 0.05 0.1 0.15 0.2
2v
5.02 TeV Pb+Pb 40-60%
< 2 ηµ -1, 0.3 - 1.9 nb
Preliminary ATLAS
charm muon bottom muon DREENA-B
D meson B meson µ
→ D →µ B
Figure 10: Charm and bottom muon v
2as a function of p
Tin the 5.02 TeV Pb + Pb data for all centrality intervals.
Statistical uncertainties are shown as vertical lines and systematic uncertainties as boxes. The charm and bottom
uncertainties are partially anti-correlated. Also shown are theoretical calculations dreena - b [14] in the same centrality
selections for D and B meson v
2, as well as the corresponding v
2results for the decay muons.
0 5 10 15 20 25 [GeV]
pT
0 0.05 0.1 0.15 0.2
2v
5.02 TeV Pb+Pb 0-10%
< 2 ηµ -1, 0.3 - 1.9 nb
Preliminary ATLAS
charm muon bottom muon DAB-MOD
µ
→ D →µ B
0 5 10 15 20 25
[GeV]
pT
0 0.05 0.1 0.15 0.2
2v
5.02 TeV Pb+Pb 10-20%
< 2 ηµ -1, 0.3 - 1.9 nb
Preliminary ATLAS
charm muon bottom muon DAB-MOD
µ
→ D →µ B
0 5 10 15 20 25
[GeV]
pT
0 0.05 0.1 0.15 0.2
2v
5.02 TeV Pb+Pb 20-30%
< 2 ηµ -1, 0.3 - 1.9 nb
Preliminary ATLAS
charm muon bottom muon DAB-MOD
µ
→ D →µ B
0 5 10 15 20 25
[GeV]
pT
0 0.05 0.1 0.15 0.2
2v
5.02 TeV Pb+Pb 30-40%
< 2 ηµ -1, 0.3 - 1.9 nb
Preliminary ATLAS
charm muon bottom muon DAB-MOD
µ
→ D →µ B
0 5 10 15 20 25
[GeV]
pT
0 0.05 0.1 0.15 0.2
2v
5.02 TeV Pb+Pb 40-60%
< 2 ηµ -1, 0.3 - 1.9 nb
Preliminary ATLAS
charm muon bottom muon DAB-MOD
µ
→ D →µ B


![Figure 3: Inclusive heavy-flavor muon v 2 as a function of p T in the combined 2015 and 2018 5.02 TeV Pb + Pb data compared with the results in the 2.76 TeV Pb + Pb data measurements [16]](https://thumb-eu.123doks.com/thumbv2/1library_info/3999423.1540361/10.892.226.691.153.779/figure-inclusive-flavor-function-combined-compared-results-measurements.webp)
![Figure 4: Inclusive heavy-flavor muon v 3 as a function of p T in the combined 2015 and 2018 5.02 TeV Pb + Pb data compared with the results in the 2.76 TeV Pb + Pb data measurements [16]](https://thumb-eu.123doks.com/thumbv2/1library_info/3999423.1540361/11.892.226.689.152.778/figure-inclusive-flavor-function-combined-compared-results-measurements.webp)
![Figure 7: Charm and bottom muon v 2 as a function of p T in the 5.02 TeV Pb + Pb data for the 0–10% (left) and 40–60% (right) centrality interval, compared to theoretical predictions based on dreena - b [14] and dab - mod [13, 34]](https://thumb-eu.123doks.com/thumbv2/1library_info/3999423.1540361/14.892.190.727.150.339/figure-charm-function-centrality-interval-compared-theoretical-predictions.webp)
![Figure 8: Charm and bottom muon v 2 as a function of p T in the combined 2015 and 2018 5.02 TeV Pb + Pb data in comparison to inclusive hadron v 2 in 2015 5.02 TeV Pb + Pb data [22] where the same centrality interval measurements are available](https://thumb-eu.123doks.com/thumbv2/1library_info/3999423.1540361/18.892.224.694.219.850/function-combined-comparison-inclusive-centrality-interval-measurements-available.webp)
![Figure 9: Charm and bottom muon v 3 as a function of p T in the combined 2015 and 2018 5.02 TeV Pb + Pb data in comparison to inclusive hadron v 3 in 2015 5.02 TeV Pb + Pb data [22] where the same centrality interval measurements are available](https://thumb-eu.123doks.com/thumbv2/1library_info/3999423.1540361/19.892.225.692.251.873/function-combined-comparison-inclusive-centrality-interval-measurements-available.webp)
