ATLAS-CONF-2014-025 20May2014
ATLAS NOTE
ATLAS-CONF-2014-025
May 20, 2014
Measurements of the nuclear modification factor for jets in Pb + Pb collisions at √
s
NN= 2.76 TeV with the ATLAS detector
The ATLAS Collaboration
Abstract
Measurements of inclusive jet production are performed in
ppand Pb
+Pb collisions at
√sNN =
2.76 TeV with the ATLAS detector at the LHC, corresponding to total integrated
luminosities of 4.0 pb
−1and 0.14 nb
−1, respectively. The jets are identified with the anti-k
talgorithm with
R =0.4 and the spectra are measured over the kinematic range 32
< pT <500 GeV,
|y|<2.1 and as a function of collision centrality. The nuclear modification factor,
RAA, is evaluated and jets are found to be suppressed by approximately a factor of two in central collisions compared to
ppcollisions. The
RAAshows a slight increase with
pTand no significant variation with rapidity.
c
Copyright 2014 CERN for the benefit of the ATLAS Collaboration.
Reproduction of this article or parts of it is allowed as specified in the CC-BY-3.0 license.
Relativistic heavy ion collisions at the LHC produce a medium of strongly interacting nuclear matter composed of deconfined color charges. Hard scattering processes occurring in these collisions produce high transverse momentum (
pT) partons that propagate through the medium and lose energy, resulting in the phenomenon of “jet quenching.” Such partonic energy loss was first observed at RHIC through measurements of hadrons resulting from the fragmentation of jets [1, 2, 3, 4]. Measurements at the LHC have provided a more complete view of the effects of the quenching by using fully reconstructed jets [5, 6, 7, 8, 9, 10]. ATLAS has performed measurements of jet suppression [8] by comparing the jet yields in central collisions, where the colliding nuclei have large overlap, to the yields in peripheral collisions.
Those results indicated that the rate for jets with
pT &40 GeV in Pb+Pb collisions is suppressed by a factor of approximately two in central collisions relative to peripheral collisions when accounting for the enhancement due to the larger geometric overlap. The quenching e
ffects can be better understood through measurements of the absolute suppression, performed by comparing the jet yields in Pb+Pb collisions to
ppcollisions at the same per nucleon center-of-mass energy. The results presented here are the first such measurements performed using fully reconstructed jets. A high-statistics Pb
+Pb data set is also used which allows measurements that extend over a larger
pTrange and that can be performed differentially in jet rapidity,
|y|.The magnitude of the suppression is expected to depend on both the
pTdependence of the energy loss as well as the shape of the initial jet production spectrum [11]. This spectrum becomes increasingly steep at larger values of the jet rapidity. Thus measurements of jet suppression for jets in different intervals of rapidity provide potentially di
fferent information about the energy loss. Additionally, jet production at large
|y|values is expected to be increasingly dominated by hard-scattering processes where the outgoing partons are quarks, which may be quenched differently than gluons [12].
Hard scattering rates are enhanced in more central collisions due to the fact that the larger overlap results in a higher luminosity of partons able to participate in hard scattering processes. This geometric effect is removed by scaling the per event jet yields in a given centrality bin by the average per-collision flux of nucleons for that centrality bin
hTAAi, which is determined from a Glauber Model analysis [13,14]. The suppression is quantified by the nuclear modification factor
RAA=
1
hTAAi
1
Nevt
d2Njet dpTdy
cent
d2σjetpp dpTdy
.
(1)
This note presents measurements of the inclusive jet
RAAin Pb
+Pb collisions at a nucleon-nucleon center-of-mass energy of
√sNN =
2.76 TeV. It utilizes Pb+Pb data collected during 2011 corresponding to an integrated luminosity of approximately 0.14 nb
−1as well as data from
ppcollisions recorded during 2013 corresponding to 4.0 pb
−1. Results are presented for jets reconstructed in the calorimeter [15] using the anti-k
tjet-finding algorithm [16] with jet radius parameter
R=0.4. The contribution of the underlying event (UE) to each jet, assumed to be uncorrelated and additive, was subtracted on a per-jet basis. The
RAAvalues were calculated after unfolding the jet spectra for distortions due to the detector response and UE fluctuations. The jet spectra were measured separately in the following absolute rapidity ranges:
0–0.3, 0.3–0.8, 0.8–1.2 and 1.2–2.1.
The measurements presented here were performed with the ATLAS detector [15] using its calorime- ter, inner detector, trigger, and data acquisition systems
1. The calorimeter system consists of a liq- uid argon (LAr) electromagnetic (EM) calorimeter (|η|
<3.2), a steel
/scintillator sampling hadronic calorimeter (|η|
<1.7), a LAr hadronic calorimeter (1.5
< |η| <3.2), and a forward calorimeter (FCal)
1ATLAS uses a right-handed coordinate system with its origin at the nominal interaction point (IP) in the center of the detector and thez-axis along the beam pipe. Thex-axis points from the IP to the center of the LHC ring, and they-axis points upward. Cylindrical coordinates (r, φ) are used in the transverse plane,φbeing the azimuthal angle around the beam pipe. The pseudorapidity is defined in terms of the polar angleθasη=−ln tan(θ/2).
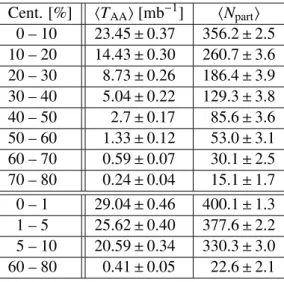
Table 1: The
hTAAiand
hNpartivalues and their uncertainties in each centrality bin.
Cent. [%]
hTAAi[mb
−1]
hNparti0 – 10 23.45
±0.37 356.2
±2.5 10 – 20 14.43
±0.30 260.7
±3.6 20 – 30 8.73
±0.26 186.4
±3.9 30 – 40 5.04
±0.22 129.3
±3.8 40 – 50 2.7
±0.17 85.6
±3.6 50 – 60 1.33
±0.12 53.0
±3.1 60 – 70 0.59
±0.07 30.1
±2.5 70 – 80 0.24
±0.04 15.1
±1.7 0 – 1 29.04
±0.46 400.1
±1.3 1 – 5 25.62
±0.40 377.6
±2.2 5 – 10 20.59
±0.34 330.3
±3.0 60 – 80 0.41
±0.05 22.6
±2.1
(3.2
< |η| <4.9). Charged-particle tracks were measured over the range
|η| <2.5 using the inner de- tector [17], which is composed of silicon pixel detectors in the innermost layers, followed by silicon microstrip detectors and a straw-tube transition-radiation tracker (|η|
<2.0), all immersed in a 2 T axial magnetic field. The zero-degree calorimeters (ZDCs) are located symmetrically at
z=±140 m and cover|η| >
8.3. In Pb
+Pb collisions the ZDCs primarily measure non-interacting “spectator” neutrons from the incident nuclei. A ZDC coincidence trigger was defined by requiring a signal consistent with one or more neutrons in each of the calorimeters.
During the recording of the
ppdata, the beam conditions were such that the typical number of in- teractions per crossing of proton bunches (pileup) varied between 0.3 and 0.6. These data were selected using the ATLAS jet trigger [18] with multiple values of the trigger thresholds used to construct the ref- erence distribution. Additionally, the selected
ppevents were further required to contain a reconstructed primary vertex.
Data from Pb+Pb collisions were recorded using either a minimum-bias trigger or a jet trigger. The minimum-bias trigger, formed from the logical OR of triggers based on a ZDC coincidence or total transverse energy in the event, is fully efficient in the range of centralities presented here and was scaled down by a factor of approximately 20 during the data taking. The jet trigger selected jets using the anti-k
talgorithm with
R=0.2 and included a UE subtraction procedure. The jet trigger selected events having at least one jet with transverse energy
ET >20 GeV at the electromagnetic scale [19]. Event selection and background rejection criteria were applied [20] yielding 53 million and 14 million events in the minimum-bias and jet-triggered samples, respectively.
The centrality of Pb+Pb collisions was characterized by
ΣEFCalT, the total transverse energy measured in the FCal [20]. The results reported here were obtained using centrality intervals defined according to successive percentiles of the
ΣEFCalTdistribution ordered from the most central (highest
ΣEFCalT) to the most peripheral collisions. A Glauber model analysis of the
ΣEFCalTdistribution was used to evaluate the
hTAAiand the number of nucleons participating in the collision,
hNparti, in each centrality interval[20]. The centrality intervals used in this measurement are indicated in Table 1 along with the
hTAAiand
hNpartifor those intervals.
The jet reconstruction and UE subtraction procedures are the same as those used in Ref. [8]. The
anti-k
talgorithm was applied to calorimeter towers with segmentation
∆η×∆φ=0.1
×0.1. An iterative
procedure was used to obtain an event-by-event estimate of the average
η-dependent UE energy densitywhile excluding actual jets from that estimate. The jet kinematics were obtained by subtracting the UE
energy from the towers within the jet.
Following reconstruction, the jet energies were corrected to account for the calorimeter energy re- sponse using an
η- and pT-dependent multiplicative factor that was derived from the MC simulations [19]. These calibration factors were derived and applied separately for the Pb+Pb and
ppsamples due to the di
fferent detector conditions during data taking. In all other respects the jet reconstruction procedure used in both data samples were identical. Following this calibration a final multiplicative
in situcalibra- tion was applied to account for differences in the simulated detector response and data. This calibration, typically di
ffering from unity by a few per cent, was derived by comparing the measured
pTof jets re- coiling against objects with an independently determined energy scale– such as
Zbosons,
γ’s or otherjets in a different region of the detector– between
ppdata and MC simulations [19].
In addition to the calorimetric jets, “track jets” were reconstructed by applying the anti-k
talgorithm with
R=0.4 to charged particles with
pT >4 GeV. In the Pb+Pb analysis, the track jets were used in conjunction with electromagnetic clusters to exclude the contribution to the jet yield from UE fluctuations of soft particles incorrectly interpreted as calorimeter jets [8]. The jets were required to be within
∆R= q∆η2+ ∆φ2 =0.2 of a track jet with
pT >7 GeV or an electromagnetic cluster with
pT >8 GeV.
The jet spectra were constructed separately from each triggered sample accounting for the scale- down applied to each trigger during data-taking. In the Pb
+Pb analysis, the combined spectrum was constructed by using the jet triggered sample for all
pTbins for which that trigger was determined to be better than 99 % efficient; the minimum-bias triggered sample was used for the lower
pTbins. The trigger e
fficiency has a broad turn on as a function of
pTdue to di
fferences in jet definitions used in the trigger algorithm (R
=0.2) and the offline measurement (R
=0.4). In central collisions, this effect is larger as the
R =0.4 jets are more strongly affected by the UE. Thus the minimum
pTvalue at which the jet triggered sample was used increases with centrality, varying between 60 and 100 GeV. In the
ppmeasurement, the different triggered samples were combined in a similar way, by constructing the com- bined spectrum in each
pTbin from the trigger with the best statistics that was more than 99 % efficient for that bin.
The performance of the jet reconstruction in Pb
+Pb collisions was evaluated using the GEANT4- simulated detector response [21, 22] in a Monte Carlo (MC) sample of
√ pphard scattering events at
s=2.76 TeV. The events were produced with the P
ythiaevent generator [23] version 6.423 using the AUET2B tune [24] and overlaid with minimum-bias Pb
+Pb collisions recorded by ATLAS during the same data-taking period as the data used in the analysis. Thus the MC sample contains a UE contribution that is identical in all respects to the data. Jets were reconstructed in the MC events using the same procedure as was applied to the data and compared to generator-level jets reconstructed from final-state Pythia hadrons. A separate Pythia sample was produced for the analysis of the
ppdata with the detector simulation adjusted to match the conditions during the
ppdata taking. To account for the small but non- negligible contribution from pileup, the P
ythiahard-scattering events were overlaid onto a number of minimum-bias Pythia events at a rate consistent with the pileup rate during operations. Additional MC samples were used in evaluations of the jet energy scale (JES) uncertainty. The Pyquen generator [25], which applies medium-induced energy loss to parton showers produced by P
ythia, was used to generate a sample of jets with fragmentation functions that differ from those in the nominal Pythia sample in a fashion consistent with measurements of fragmentation functions in quenched jets [26, 27].
The jet spectra were unfolded to account for the
pTbin migration induced by the jet energy res-
olution (JER) using a method based on the Singular Value Decomposition (SVD) [28]. This method
inverts the detector response matrix while simultaneously imposing a constraint on the curvature of the
unfolded spectrum to regularize the non-local e
ffects of statistical fluctuations in the measured spectrum
on the unfolded distribution. The application of this method to unfolding jet spectra is discussed exten-
sively in Ref. [8]. The effects of the detector response were evaluated by applying the same procedure
to the MC samples as was applied to the data and matching the resulting reconstructed jets with the
generator-level jets. For each pair, the
pTof the generator and reconstructed jets were used to populate a detector response matrix. Separate response matrices were obtained for each centrality interval. How- ever the distribution of centralities
withineach interval is slightly different in the MC samples, taken from minimum-bias Pb+Pb data, than in the events contributing to the measurement because jets are more likely to be produced in more central collisions. This was accounted for by analyzing the
ΣETFCaldistribution from data in minimum-bias events and events containing jets and using the ratio to reweight the contribution of each pair in the determination of the response matrices. The response matrix is gen- erally diagonal, indicating that jets are likely to be reconstructed in the same
pTbin as the generator jets.
The average
pTdifference between reconstructed and generator jets, is
.1 %, independent of central- ity. However the response distributions broaden at low
pTas the JER increases. At
pT =200 GeV, the relative JER is approximately 10 % and is independent of centrality, however at
pT =40 GeV, it varies from 20–40 % between peripheral and central collisions as the relative magnitudes of the UE fluctuations become larger with respect to the jet
pT. The unfolding is most sensitive in this region and the range of jet
pTwas chosen separately in each centrality interval to be as low as possible while maintaining stability in the unfolding procedure. Following the unfolding the e
ffects of any ine
fficiency in the jet reconstruction, including inefficiency introduced by the UE jet rejection requirement, were corrected for by a multiplicative correction. The e
fficiency is unity, and thus so is the correction factor, for jets with
pT >100 GeV. The magnitude of the correction is largest in central collisions at low
pT, and reaches a maximal value of 1.3.
The statistical uncertainties on the unfolded spectrum were evaluated using a pseudo-experiment procedure where the measured covariance in the data was used to generate a set of 1000 stochastic variations of the measurement, and each variation was separately unfolded. The statistical variation in the results of this procedure was used to define a statistical covariance on the unfolded spectrum. In the results presented here, the error bars on each point represent the square root of the diagonal element of the covariance matrix.
Systematic uncertainties in the results arise from potential inaccuracies in the description of the detector response present in the MC samples. Uncertainties on the JER and JES have been evaluated using data-driven techniques in
ppcollisions [19, 29]. New response matrices with a systematically- varied relationship between the reconstructed and generator jet kinematics were constructed from these uncertainties and used to perform the unfolding. Correlations in the JES and JER uncertainties across the two data samples were accounted for in the propagation of the uncertainties to the
RAA. A centrality- dependent uncertainty on the JES was also included to account for potential variations in the detector response to quenched jets. The jet response in the Pyquen sample was found to di
ffer by up to 1 % from that in the Pythia sample. The magnitude of this variation was then checked by a study performed by matching track jets to calorimetric jets in the data. The calorimetric response was evaluated as a function of track jet
pTand centrality, and was compared to the same quantity evaluated in the MC sample. The uncertainty was taken to be 1 % in the most central collisions with the uncertainty decreasing in more peripheral collisions. Potential differences in the calorimetric response between the two data taking periods were evaluated using a similar study with track jets but comparing peripheral Pb
+Pb to
pp. Anadditional uncertainty of 1.5 % on the JES was applied in the Pb+Pb data only to account for these differences.
Uncertainties in the unfolding procedure were evaluated by varying the choice of regularization pa-
rameter used in the unfolding. This parameter, which controls the number of damped singular values
in the response inversion as well as the magnitude of this damping, was varied by
±1 from the nominalvalues used in the unfolding. Additional uncertainties arise from the multiplicative correction applied
to the unfolded spectra to account for the jet reconstruction efficiency. The efficiency for reconstructing
calorimetric jets as defined with respect to matched track jet
pTwas evaluated in the data and the MC
sample. The di
fferences were found to be in agreement within statistical uncertainties and an estimate
of 0.5 % was used for the uncertainty on the efficiency correction. Jet
pTand rapidity independent un- certainties on the
hTAAifactor appearing in Eq. 1 were found to be approximately 1 % and 10 % in the most central and peripheral collisions, respectively, with the full set of values given in Table 1. An overall uncertainty on the luminosity in the
ppsample was estimated to be 3.4 %. Both the luminosity and
hTAAiuncertainties are correlated across all points.
The total systematic uncertainty on the
ppcross sections is dominated by the JES uncertainty, which is as large as 15 %. For the Pb+Pb jet yields this uncertainty is also dominant and in the most central collisions is 22 %. In the
RAAmuch of this uncertainty cancels, although the JES remains the dominant systematic in most centrality and rapidity intervals and is typically 10 %. The uncertainties due to the unfolding are generally a few per cent, but for some
pTvalues, particularly near the upper and lower limits included in the measurement, the contributions from the uncertainty in the unfolding procedure can become as large as 15 %. The contributions of the JER to the total uncertainty on
RAAvary between 2–6 %. In the most peripheral bins the
hTAAiuncertainties that affect the overall normalization are the dominant contribution.
[GeV]
pT
[ nb/GeV ] yd Tpdσ2 d
10-5
10-4
10-3
10-2
10-1
1 10 102
103
104
105
106
107
108
109
1010
1011
40 60 100 200 400
8 )
× 10
| < 2.1 ( y
|
6 )
× 10
| < 0.3 ( y
|
4 )
× 10 | < 0.8 ( y
≤ | 0.3
2 )
× 10 | < 1.2 ( y
≤ | 0.8
0 )
× 10 | < 2.1 ( y
≤ | 1.2
Preliminary ATLAS
= 2.76 TeV s
=0.4,
tR k anti-
= 4.0 pb-1
Lint
data, pp 2013
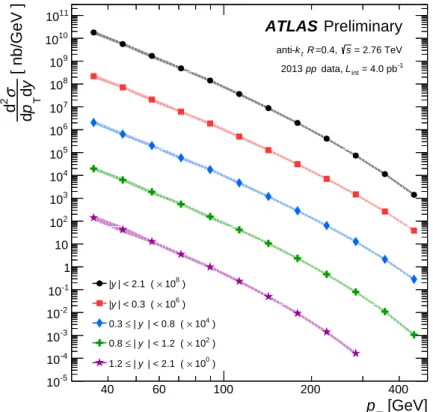
Figure 1: The double differential jet cross section in
ppcollisions, after unfolding and efficiency cor- rection, as a function of
pTin five rapidity bins: 0–0.3 ( ), 0.3–0.8 ( ), 0.8–1.2(
:), 1.2–2.1 (
M) and the integrated bin 0–2.1 (
•). The statistical and systematic uncertainties are indicated by the error bars (too small to be see on this scale) and shaded bands, respectively. Each spectrum is scaled by an overall multiplicative factor for presentation purposes.
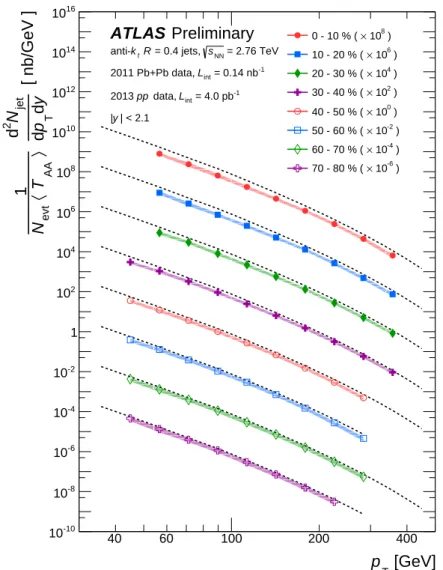
The unfolded, e
fficiency-corrected
ppjet cross sections are shown in Fig. 1. The
ppcross section obtained in this analysis are found to be consistent within uncertainties with previous measurements of the same quantity using a lower statistics run in 2011 [30]. The unfolded, efficiency-corrected jet yield, scaled by
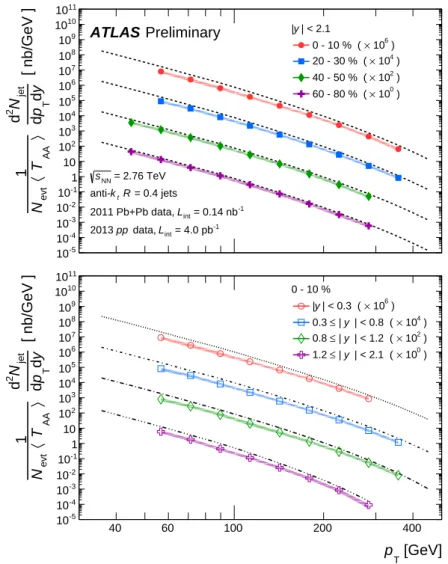
NevthTAAi, in Pb+Pb collisions in selected rapidity and centrality bins is shown in Fig. 2.
The upper series of points show the jet yields in the same rapidity interval,
|y| <2.1, but for different
centralities, while the lower points show the 0–10 % centrality interval, but for different ranges in jet
rapidity. The dashed lines represent the
ppjet cross sections for that same rapidity bin, and the jet suppression is evinced by the fact that the jet yields fall below these curves.
[ nb/GeV ] yd Tpd
jetN2 d 〉 AAT 〈evtN1
10-5
10-4
10-3
10-2
10-1
1 10 102
103
104
105
106
107
108
109
1010
1011
[GeV]
pT
[ nb/GeV ] yd Tpd
jetN2 d 〉 AAT 〈evtN1
10-5
10-4
10-3
10-2
10-1
1 10 102
103
104
105
106
107
108
109
1010
1011
40 60 100 200 400
0 - 10 %
6 )
× 10
| < 0.3 ( y
|
4 )
× 10 | < 0.8 ( y
≤ | 0.3
2 )
× 10 | < 1.2 ( y
≤ | 0.8
0 )
× 10 | < 2.1 ( y
≤ | 1.2
| < 2.1 y
|
6 )
× 10 0 - 10 % (
4 )
× 10 20 - 30 % (
2 )
× 10 40 - 50 % (
0 )
× 10 60 - 80 % (
Preliminary ATLAS
= 2.76 TeV sNN
= 0.4 jets
tR k anti-
= 0.14 nb-1
Lint
2011 Pb+Pb data, = 4.0 pb-1
Lint
data, pp 2013
Figure 2: The jet yield in Pb
+Pb collisions, after unfolding and e
fficiency correction, scaled by
Nevt× hTAAi, shown as a function of
pT. The lower panel shows the 0–10 % centrality interval in four rapidity ranges: 0–0.3 (
◦), 0.3–0.8 (u
t), 0.8–1.2 (♦), 1.2–2.1 (uuuttt tttuuu). The upper panel shows the 0–2.1 rapidity range for four centrality intervals: 0–10 % (
•), 20–30 % ( ), 40–50 % ( ) and 70–80 % (
:). The statistical and systematic uncertainties are indicated by the error bars (too small to be see on this scale) and shaded bands, respectively. Each spectrum is scaled by an overall multiplicative factor for presentation purposes and the dashed lines represent the
ppjet cross section for the same rapidity interval scaled by the same factor.
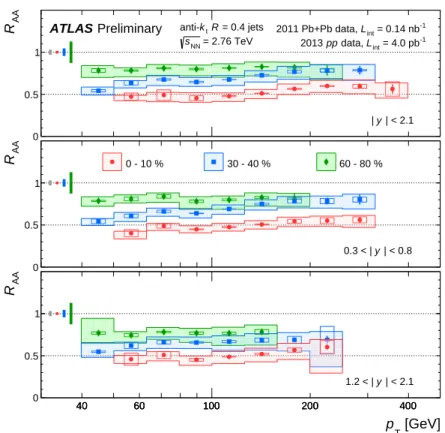
The jet
RAAas a function of
pTis shown in Fig. 3 for di
fferent ranges in collision centrality and jet rapidity. The
RAAis observed to increase weakly with
pT, except in the most peripheral collisions. In the 0–10 % and
|y|<2.1 centrality and rapidity intervals, which have the smallest statistical uncertainty, the
RAAis 0.47 at
pT ∼55 GeV and rises to 0.56 at
pT ∼350 GeV. The results are consistent with measurements of the jet central-to-peripheral ratio[8],
RCP = RAA|cent/RAA|60–
80%, although in those measurements the uncertainties are too large to infer any significant
pTdependence.
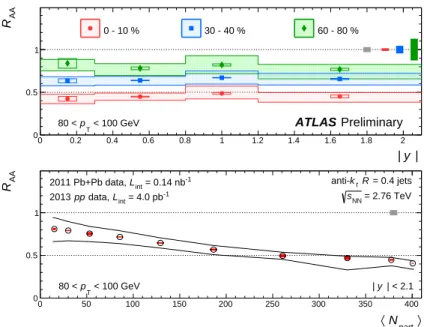
The rapidity dependence of the
RAAis shown in the top panel of Fig. 4 for jets with 80
< pT <AAR
0 0.5 1
| < 2.1 y
| Preliminary
ATLAS anti-ktR = 0.4 jets = 2.76 TeV sNN
= 0.14 nb-1
Lint
2011 Pb+Pb data,
= 4.0 pb-1
Lint
data, pp 2013
AAR
0 0.5 1
| < 0.8 y 0.3 < |
0 - 10 % 30 - 40 % 60 - 80 %
[GeV]
pT
AAR
0 0.5 1
40 60 100 200 400
40 60 100 200 400
40 60 100 200 400
| < 2.1 y 1.2 < |
0 - 10 % 30 - 40 % 60 - 80 %
Figure 3: Jet
RAAas a function of
pTfor three centrality bins: 0–10 % (
•), 30–40 % ( ) and 60–
80 % (). Each panel indicates a different range in
|y|:
|y| <2.1 (top), 0.3
< |y| <0.8 (middle) and 1.2
< |y| <2.1 (bottom). The fractional uncertainties from the luminosity and the
hTAAifactors are indicated separately as a shaded box centered at one. The solid lines indicate the uncertainties due to the unfolding and are partially correlated in
pT. The remaining uncertainties are fully correlated in
pTand are indicated by boxes. The statistical uncertainties are represented by error bars.
100 GeV for three centrality bins. The
RAAshows no significant rapidity dependence over the range presented in this measurement. The centrality dependence, as represented by the
hNparti, is shown in thebottom panel of Fig. 4 for jets in the same
pTinterval and with
|y|<2.1. The
RAAdecreases smoothly from the most peripheral collisions (smallest
hNpartivalues) to central collisions, where it reaches a minimal value of approximately 0.4 in the most central 1 % of collisions. A similar
hNpartidependence was observed for jets in di
fferent ranges of
pTand rapidity.
In summary, this note has presented measurements of inclusive jet production in
ppand Pb+Pb collisions over a wide range in
pT, rapidity and centrality. The jet
RAAobtained from these
measurements shows weak rise with
pT, with a slope that varies with collision centrality. No significant
slope is observed in the most peripheral collisions. The
RAAdecreases monotonically in increasingly
central collisions, and varies gradually as a function of
hNparti. At forward rapidity, the increasingsteepness of the jet production spectrum is expected to result in more suppression of the jet yields. In
this kinematic region, the production is increasingly dominated by quark jets, which may lose less
energy than gluon jets. The observed lack of rapidity dependence in the
RAAplaces constraints on
relative energy loss for quark and gluon jets in theoretical descriptions of jet quenching.
| y
|
0 0.2 0.4 0.6 0.8 1 1.2 1.4 1.6 1.8 2
AAR
0 0.5 1
0 - 10 % 30 - 40 % 60 - 80 %
< 100 GeV pT
80 < ATLAS Preliminary
part〉
〈N
0 50 100 150 200 250 300 350 400
AAR
0 0.5 1
< 100 GeV pT
80 < | y | < 2.1
= 0.4 jets
tR k anti-
= 2.76 TeV sNN
= 0.14 nb-1
Lint
2011 Pb+Pb data, = 4.0 pb-1
Lint
data, pp 2013
Figure 4: In the top panel, the
RAAfor jets with 80
< pT<100 GeV is shown as a function of
|y|for three centrality bins: 0–10 % (
•), 30–40 % ( ) and 60–80 % ( ). The fractional uncertainties coming from the luminosity and the
hTAAifactors are indicated separately as a shaded box centered at one. The boxes indicate the uncertainties due to the unfolding and are uncorrelated in
|y|. The remaining uncertainties are fully correlated in
|y|and are indicated by the solid lines. The statistical uncertainties are represented by error bars. The bottom panel shows the
RAAfor jets with 80
< pT <100 GeV and
|y|<2.1 as a function of
hNparti. All systematic errors are represented by the shaded boxes, except for the
hTAAiuncertainties, which are correlated from point-to-point and are indicated by the black lines.
References
[1] PHENIX Collaboration, S. S. Adler et al., Phys. Rev. Lett.
91(2003) 072301, arXiv:nucl-ex/0304022.
[2] STAR Collaboration, J. Adams et al., Phys. Rev. Lett.
91(2003) 172302, arXiv:nucl-ex/0305015.
[3] BRAHMS Collaboration, I. Arsene et al., Phys. Rev. Lett.
91(2003) 072305, arXiv:nucl-ex/0307003.
[4] PHOBOS Collaboration, B. B. Back et al., Phys. Rev. Lett.
94(2005) 082304, arXiv:nucl-ex/0405003.
[5] ATLAS Collaboration, Phys. Rev. Lett.
105(2010) 252303, arXiv:1011.6182.
[6] CMS Collaboration, Phys. Rev. C
84(2011) 024906, arXiv:1102.1957.
[7] CMS Collaboration, CERN-PH-EP-2012-042, 2012.
[8] ATLAS Collaboration, Phys. Lett. B
719(2013) 220–241, arXiv:1208.1967 [hep-ex].
[9] ALICE Collaboration, B. Abelev et al., JHEP
1403(2014) 013, arXiv:1311.0633 [nucl-ex].
[10] ATLAS Collaboration, Phys. Rev. Lett.
111(2013) 152301.
[11] PHENIX Collaboration, K. Adcox et al., Nucl. Phys.
A 757(2005) 184–283, nucl-ex/0410003.
[12] R. Baier, D. Schi
ff, and B. Zakharov, Ann.Rev.Nucl.Part.Sci.
50(2000) 37–69, arXiv:hep-ph/0002198 [hep-ph].
[13] Miller, Michael L. and Reygers, Klaus and Sanders, Stephen J. and Steinberg, Peter, Ann. Rev. Nucl. Part. Sci.
57(2007) 205–243, arXiv:nucl-ex/0701025.
[14] B. Alver, M. Baker, C. Loizides, and P. Steinberg, arXiv:0805.4411 [nucl-ex].
[15] ATLAS Collaboration, JINST
3(2008) S08003.
[16] M. Cacciari, G. P. Salam, and G. Soyez, JHEP
0804(2008) 063, arXiv:0802.1189.
[17] ATLAS Collaboration, Eur. Phys. J.
C 70(2010) 787–821, arXiv:1004.5293.
[18] ATLAS Collaboration, Eur. Phys. J.
C72(2012) 1849, arXiv:1110.1530 [hep-ex].
[19] ATLAS Collaboration, Eur. Phys. J. C
73(2013) 2304, arXiv:1112.6426 [hep-ex].
[20] ATLAS Collaboration, Phys. Lett.
B 707(2012) 330–348, arXiv:1108.6018.
[21] S. Agostinelli et al., Nucl. Instrum. Meth.
A 506(2003) 250–303.
[22] ATLAS Collaboration, Eur. Phys. J.
C 70(2010) 823–874, arXiv:1005.4568.
[23] T. Sjostrand, S. Mrenna, and P. Z. Skands, JHEP
0605(2006) 026, arXiv:hep-ph/0603175.
[24] ATLAS Collaboration, ATL-PHYS-PUB-2011-009.
http://cdsweb.cern.ch/record/1363300.
[25] I. Lokhtin and A. Snigirev, Eur. Phys. J.
C45(2006) 211–217, arXiv:hep-ph/0506189 [hep-ph].
[26] CMS Collaboration, JHEP
1210(2012) 087, arXiv:1205.5872 [nucl-ex].
[27] ATLAS Collaboration, ATLAS-CONF-2012-115, 2012.
[28] A. Hocker and V. Kartvelishvili, Nucl. Instrum. Meth.
A 372(1996) 469–481, arXiv:hep-ph/9509307.
[29] ATLAS Collaboration, Eur. Phys. J.
C73(2013) 2306, arXiv:1210.6210 [hep-ex].
[30] ATLAS Collaboration, Eur. Phys. J.
C73(2013) 2509, arXiv:1304.4739 [hep-ex].
Additional figures
[GeV]
pT
[ nb/GeV ] yd Tpd
jetN2 d 〉 AAT 〈evtN1
10-10
10-8
10-6
10-4
10-2
1 102
104
106
108
1010
1012
1014
1016
40 60 100 200 400
8 )
× 10 0 - 10 % (
6 )
× 10 10 - 20 % (
4 )
× 10 20 - 30 % (
2 )
× 10 30 - 40 % (
0 )
× 10 40 - 50 % (
-2 )
× 10 50 - 60 % (
-4 )
× 10 60 - 70 % (
-6 )
× 10 70 - 80 % (
Preliminary ATLAS
= 2.76 TeV sNN
= 0.4 jets,
tR k anti-
= 0.14 nb-1
Lint
2011 Pb+Pb data, = 4.0 pb-1
Lint
data, pp 2013
| < 2.1 y
|
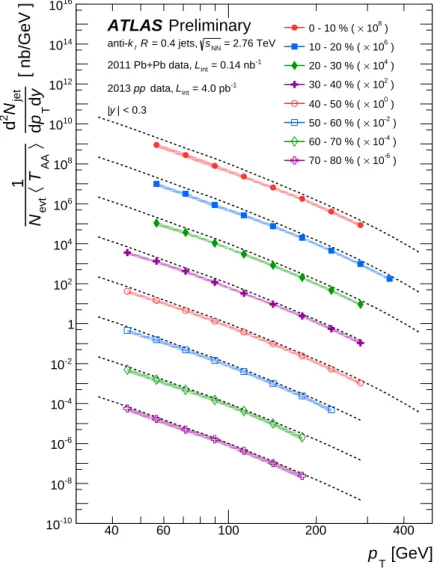
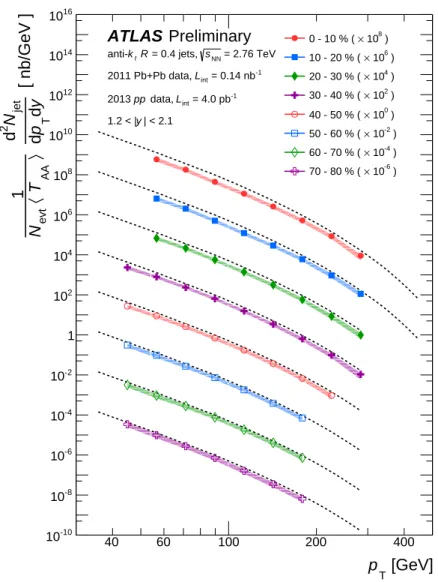
Figure 5: The jet yield in Pb+Pb collisions, after unfolding and efficiency correction, scaled by
Nevt× hTAAi, shown as a function ofpTfor jets in the range
|y|<2.1 for various centrality bins. The statistical and systematic uncertainties are indicated by the error bars and shaded bands respectively. Each spectrum is scaled by an overall multiplicative factor for presentation purposes and the dashed lines represent the
pp
jet cross section for the same rapidity interval scaled by the same factor.
[GeV]
pT
[ nb/GeV ] yd Tpd
jetN2 d 〉 AAT 〈evtN1
10-10
10-8
10-6
10-4
10-2
1 102
104
106
108
1010
1012
1014
1016
40 60 100 200 400
8 )
× 10 0 - 10 % (
6 )
× 10 10 - 20 % (
4 )
× 10 20 - 30 % (
2 )
× 10 30 - 40 % (
0 )
× 10 40 - 50 % (
-2 )
× 10 50 - 60 % (
-4 )
× 10 60 - 70 % (
-6 )
× 10 70 - 80 % (
Preliminary ATLAS
= 2.76 TeV sNN
= 0.4 jets,
tR k anti-
= 0.14 nb-1
Lint
2011 Pb+Pb data, = 4.0 pb-1
Lint
data, pp 2013
| < 0.3 y
|
Figure 6: The jet yield in Pb+Pb collisions, after unfolding and efficiency correction, scaled by
Nevt× hTAAi, shown as a function ofpTfor jets in the range
|y|<0.3 for various centrality bins. The statistical and systematic uncertainties are indicated by the error bars and shaded bands respectively. Each spectrum is scaled by an overall multiplicative factor for presentation purposes and the dashed lines represent the
pp
jet cross section for the same rapidity interval scaled by the same factor.
[GeV]
pT
[ nb/GeV ] yd Tpd
jetN2 d 〉 AAT 〈evtN1
10-10
10-8
10-6
10-4
10-2
1 102
104
106
108
1010
1012
1014
1016
40 60 100 200 400
8 )
× 10 0 - 10 % (
6 )
× 10 10 - 20 % (
4 )
× 10 20 - 30 % (
2 )
× 10 30 - 40 % (
0 )
× 10 40 - 50 % (
-2 )
× 10 50 - 60 % (
-4 )
× 10 60 - 70 % (
-6 )
× 10 70 - 80 % (
Preliminary ATLAS
= 2.76 TeV sNN
= 0.4 jets,
tR k anti-
= 0.14 nb-1
Lint
2011 Pb+Pb data, = 4.0 pb-1
Lint
data, pp 2013
| < 0.8 y 0.3 < |
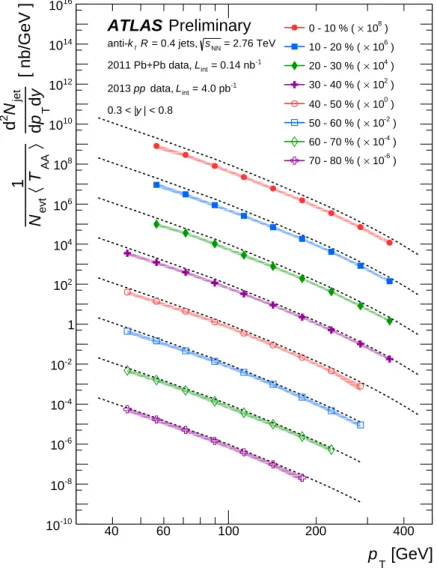
Figure 7: The jet yield in Pb+Pb collisions, after unfolding and efficiency correction, scaled by
Nevt× hTAAi, shown as a function of pTfor jets in the range 0.3
< |y| <0.8 for various centrality bins. The statistical and systematic uncertainties are indicated by the error bars and shaded bands respectively.
Each spectrum is scaled by an overall multiplicative factor for presentation purposes and the dashed
lines represent the
ppjet cross section for the same rapidity interval scaled by the same factor.
[GeV]
pT
[ nb/GeV ] yd Tpd
jetN2 d 〉 AAT 〈evtN1
10-10
10-8
10-6
10-4
10-2
1 102
104
106
108
1010
1012
1014
1016
40 60 100 200 400
8 )
× 10 0 - 10 % (
6 )
× 10 10 - 20 % (
4 )
× 10 20 - 30 % (
2 )
× 10 30 - 40 % (
0 )
× 10 40 - 50 % (
-2 )
× 10 50 - 60 % (
-4 )
× 10 60 - 70 % (
-6 )
× 10 70 - 80 % (
Preliminary ATLAS
= 2.76 TeV sNN
= 0.4 jets,
tR k anti-
= 0.14 nb-1
Lint
2011 Pb+Pb data, = 4.0 pb-1
Lint
data, pp 2013
| < 1.2 y 0.8 < |
Figure 8: The jet yield in Pb+Pb collisions, after unfolding and efficiency correction, scaled by
Nevt× hTAAi, shown as a function of pTfor jets in the range 0.8
< |y| <1.2 for various centrality bins. The statistical and systematic uncertainties are indicated by the error bars and shaded bands respectively.
Each spectrum is scaled by an overall multiplicative factor for presentation purposes and the dashed
lines represent the
ppjet cross section for the same rapidity interval scaled by the same factor.
[GeV]
pT
[ nb/GeV ] yd Tpd
jetN2 d 〉 AAT 〈evtN1
10-10
10-8
10-6
10-4
10-2
1 102
104
106
108
1010
1012
1014
1016
40 60 100 200 400
8 )
× 10 0 - 10 % (
6 )
× 10 10 - 20 % (
4 )
× 10 20 - 30 % (
2 )
× 10 30 - 40 % (
0 )
× 10 40 - 50 % (
-2 )
× 10 50 - 60 % (
-4 )
× 10 60 - 70 % (
-6 )
× 10 70 - 80 % (
Preliminary ATLAS
= 2.76 TeV sNN
= 0.4 jets,
tR k anti-
= 0.14 nb-1
Lint
2011 Pb+Pb data, = 4.0 pb-1
Lint
data, pp 2013
| < 2.1 y 1.2 < |
Figure 9: The jet yield in Pb+Pb collisions, after unfolding and efficiency correction, scaled by
Nevt× hTAAi, shown as a function of pTfor jets in the range 1.2
< |y| <2.1 for various centrality bins. The statistical and systematic uncertainties are indicated by the error bars and shaded bands respectively.
Each spectrum is scaled by an overall multiplicative factor for presentation purposes and the dashed
lines represent the
ppjet cross section for the same rapidity interval scaled by the same factor.
AAR
0 0.5 1
| < 2.1 y
|
Preliminary
ATLAS anti-ktR = 0.4 jets = 2.76 TeV sNN
= 0.14 nb-1
Lint
2011 Pb+Pb data,
= 4.0 pb-1
Lint
data, pp 2013
AAR
0 0.5 1
| < 0.8 y 0.3 < |
0 - 1 % 10 - 20 % 40 - 50 %
[GeV]
pT
AAR
0 0.5 1
40 60 100 200 400
40 60 100 200 400
40 60 100 200 400
| < 2.1 y 1.2 < |
0 - 1 % 10 - 20 % 40 - 50 %
Figure 10: Jet
RAAas a function of
pTfor three centrality bins: 0–1% (red circles), 10–20% (blue
squares) and 40–50% (green diamonds). Each panel indicates a di
fferent range in
|y|: |y| <2.1 (top),
0.3
< |y| <0.8 (middle) and 1.2
< |y| <2.1 (bottom). The fractional uncertainties from the luminosity
and the
hTAAifactors are indicated separately as a shaded box centered at one. The solid lines indicate
the uncertainties due to the unfolding and are partially correlated in
pT. The remaining uncertainties are
fully correlated in
pTand are indicated by boxes. The statistical uncertainties are represented by error
bars.
AAR
0 0.5 1
| < 2.1 y
|
Preliminary
ATLAS anti-ktR = 0.4 jets = 2.76 TeV sNN
= 0.14 nb-1
Lint
2011 Pb+Pb data,
= 4.0 pb-1
Lint
data, pp 2013
AAR
0 0.5 1
| < 0.8 y 0.3 < |
1 - 5 % 20 - 30 % 50 - 60 %
[GeV]
pT
AAR
0 0.5 1
40 60 100 200 400
40 60 100 200 400
40 60 100 200 400
| < 2.1 y 1.2 < |
1 - 5 % 20 - 30 % 50 - 60 %
Figure 11: Jet
RAAas a function of
pTfor three centrality bins: 1–5% (red circles), 20–30% (blue
squares) and 50–60% (green diamonds). Each panel indicates a di
fferent range in
|y|: |y| <2.1 (top),
0.3
< |y| <0.8 (middle) and 1.2
< |y| <2.1 (bottom). The fractional uncertainties from the luminosity
and the
hTAAifactors are indicated separately as a shaded box centered at one. The solid lines indicate
the uncertainties due to the unfolding and are partially correlated in
pT. The remaining uncertainties are
fully correlated in
pTand are indicated by boxes. The statistical uncertainties are represented by error
bars.
AAR
0 0.5 1
< 80 GeV pT
63 < | y | < 2.1
Preliminary ATLAS
= 0.4 jets
tR k anti-
= 2.76 TeV sNN
< 100 GeV pT
80 < | y | < 2.1
part〉
〈N
0 50 100 150 200 250 300 350 400
AAR
0 0.5 1
< 126 GeV pT
100 < | y | < 2.1
= 0.14 nb-1
Lint
2011 Pb+Pb data, = 4.0 pb-1
Lint
data, pp 2013
part 〉
〈N
0 50 100 150 200 250 300 350 400
< 158 GeV pT
126 < | y | < 2.1
Figure 12: The
RAAas a function of
hNpartifor jets with
|y|<2.1 in di
fferent
pTranges. All systematic
errors are represented by the shaded boxes, except for the
hTAAiuncertainties, which are correlated from
point-to-point and are indicated by the black lines. The fractional luminosity uncertainties are indicated
separately by a shaded box centered at one.
AAR
0 0.5 1
< 80 GeV pT
63 < | y | < 0.3
Preliminary ATLAS
= 0.4 jets
tR k anti-
= 2.76 TeV sNN
< 100 GeV pT
80 < | y | < 0.3
part〉
〈N
0 50 100 150 200 250 300 350 400
AAR
0 0.5 1
< 126 GeV pT
100 < | y | < 0.3
= 0.14 nb-1
Lint
2011 Pb+Pb data, = 4.0 pb-1
Lint
data, pp 2013
part 〉
〈N
0 50 100 150 200 250 300 350 400
< 158 GeV pT
126 < | y | < 0.3
Figure 13: The
RAAas a function of
hNpartifor jets with
|y|<0.3 in di
fferent
pTranges. All systematic
errors are represented by the shaded boxes, except for the
hTAAiuncertainties, which are correlated from
point-to-point and are indicated by the black lines. The fractional luminosity uncertainties are indicated
separately by a shaded box centered at one.
AAR
0 0.5 1
< 80 GeV pT
63 < 0.3 < | y | < 0.8
Preliminary ATLAS
= 0.4 jets
tR k anti-
= 2.76 TeV sNN
< 100 GeV pT
80 < 0.3 < | y | < 0.8
part〉
〈N
0 50 100 150 200 250 300 350 400
AAR
0 0.5 1
< 126 GeV pT
100 < 0.3 < | y | < 0.8
= 0.14 nb-1
Lint
2011 Pb+Pb data, = 4.0 pb-1
Lint
data, pp 2013
part 〉
〈N
0 50 100 150 200 250 300 350 400
< 158 GeV pT
126 < 0.3 < | y | < 0.8
Figure 14: The
RAAas a function of
hNpartifor jets with 0.3
< y| <0.8 in di
fferent
pTranges. All
systematic errors are represented by the shaded boxes, except for the
hTAAiuncertainties, which are cor-
related from point-to-point and are indicated by the black lines. The fractional luminosity uncertainties
are indicated separately by a shaded box centered at one.
AAR
0 0.5 1
< 80 GeV pT
63 < 0.8 < | y | < 1.2
Preliminary ATLAS
= 0.4 jets
tR k anti-
= 2.76 TeV sNN
< 100 GeV pT
80 < 0.8 < | y | < 1.2
part〉
〈N
0 50 100 150 200 250 300 350 400
AAR
0 0.5 1
< 126 GeV pT
100 < 0.8 < | y | < 1.2
= 0.14 nb-1
Lint
2011 Pb+Pb data, = 4.0 pb-1
Lint
data, pp 2013
part 〉
〈N
0 50 100 150 200 250 300 350 400
< 158 GeV pT
126 < 0.8 < | y | < 1.2