ATLAS-CONF-2019-056 14November2019
ATLAS CONF Note
ATLAS-CONF-2019-056
13th November 2019
Measurement of suppression of large-radius jets and its dependence on substructure in Pb+Pb at
5.02 TeV with the ATLAS detector
The ATLAS Collaboration
This note presents measurement of the nuclear modification factor of large-radius jets in
√ s
NN= 5 . 02 TeV Pb+Pb collisions by the ATLAS experiment. The measurement is performed using 1.72 nb
−1and 257 pb
−1of Pb+Pb and pp data, respectively. The large-radius jets are reconstructed with the anti- k
talgorithm using a radius parameter of R = 1 . 0, by re-clustering anti- k
tR = 0 . 2 jets having transverse momenta, p
T> 35 GeV. After applying a trimming procedure, the large-radius jet constituents are re-clustered using the k
talgorithm in order to obtain the splitting parameter,
√ d
12, which characterizes the transverse momentum scale for the hardest splitting in the jet. The yield of the R = 1 . 0 jets is measured as a function of p
Tand
√ d
12over the rapidity and transverse momentum ranges, | y| < 2 and 156 < p
T< 1000 GeV, respectively. The nuclear modification factor, R
AA, obtained by comparing the Pb+Pb jet yields to those in √ pp collisions, is measured as a function of jet transverse momentum and
d
12. A significant evolution of R
AAwith
√ d
12is observed at small
√ d
12values, indicating a significant difference in the quenching of large-radius jets having single sub-jet and those with more complex substructure. The inclusive jet R
AA, integrated over
√
d
12, is qualitatively similar to that obtained in previous measurements for R = 0 . 4 jets.
© 2019 CERN for the benefit of the ATLAS Collaboration.
Reproduction of this article or parts of it is allowed as specified in the CC-BY-4.0 license.
1 Introduction
Heavy-ion collisions at high energies are performed in order to produce and study hot, strongly-interacting matter often referred to as quark-gluon plasma (QGP) [1–4]. Hard-scattering processes that take place during the initial stages of the nuclear collisions produce high-energy quarks and gluons that subsequently lose their energy through interactions with the plasma. The fragmentation of high-transverse momentum ( p
T) quarks and gluons results in groups of angularly-correlated hadrons, referred to as jets, whose momenta and structure can also be modified at momenta and structure level by the energy-loss process. Measurements of the yield and properties of jets can provide insight into the energy-loss process and, ultimately, the properties of the QGP itself.
The ATLAS Collaboration measured correlated production of nearby jets in Pb+Pb collisions at 2.76 TeV, reporting centrality dependent suppression of the conditional neighbouring jet yields with respect to yields in pp collisions [5]. Recently, the ATLAS Collaboration published a measurement of the yields of charged particles associated with anti- k
tjets with radius parameter R = 0.4 up to an angular distance of ∆R = 0 . 8 from the jet axis showing jet broadening for low transverse momentum ( p
T) particles inside the jet in central Pb+Pb collisions compared to those in pp collisions. In contrast, for higher- p
Tparticles, the angular distributions were found to be narrower in Pb+Pb collisions than in pp collisions [6]. This observation suggests a dependence of modification of production of jets based on their internal structure and modification of production of neighboring jets. This measurement allows also an interpretation in which jets having large-angle hard splittings could be more suppressed relative to those with small-angle or only soft splittings. A similar observation was obtained by the CMS Collaboration using a different approach [7]. Such behavior is predicted [8–11] in descriptions of jet quenching where coherent parton branching plays a role. In this picture, the medium can only resolve partonic fragments at a certain transverse resolution scale below which they act coherently as a single emitter.
The ATLAS Collaboration has also presented a preliminary measurement of jet suppression in Pb+Pb collisions evaluated as a function of m/p
Tfor R = 0 . 4 jets, where m represents the jet mass [12]. This measurement could be sensitive to color coherence/decoherence effects. The R
AAvalues showed an overall suppression of jet yields compatible with the inclusive study without significant dependence on m/p
T. The precision of that measurement was limited due to larger systematical uncertainties. A similar measurement was also performed by the ALICE Collaboration [13]. Furthermore, CMS Collaboration published a measurement of the per-jet normalized splitting function, z
g, in pp and Pb+Pb collisions where R = 0 . 4 jets are used which have soft wide-angle radiation removed using a soft-drop method [14]. A steeper distribution of z
gis observed with depletion of jets with higher z
gvalues in Pb+Pb collisions. However, these measurements are intrinsically limited by the small radii used for the jets since the jet size automatically limits the kinematics of the internal splitting that can be measured. Furthermore, measurement of yields is directly sensitive to the energy loss contrarily to per-jet normalized measurements.
To address the above-described limitations of previous measurements, ATLAS has measured jets in Pb+Pb collisions using a large radius, R = 1 . 0. The R = 1 . 0 jets are clustered from small-radius, R = 0 . 2, anti- k
tjets with p
T> 35 GeV reconstructed using the standard ATLAS heavy-ion jet reconstruction algorithm described in Section 4. This procedure limits the impact of the underlying event (UE) on the measurement but also does not allow recovering the energy transferred outside the R = 0 . 2 sub-jets via jet quenching.
Therefore, this measurement studies the hard parton splittings. The k
tjet finding algorithm [15] is used
to re-cluster R = 1 . 0 jet constituents to obtain the k
tsplitting scales. The splitting scales are determined
by clustering objects together according to their distance from each other with the following distance
definition:
d
i j= min (p
2T,i
, p
2T,j
) · ∆R
i j2, ∆R
i j= q
∆φ
2i j+ ∆y
i j2,
where input objects are labeled with an index corresponding to the i -th and j -th momentum in the list of inputs, for all possible permutations of i and j in the given clustering step. This note presents the measurement of the splitting scale
√ d
12where indices 1 and 2 refer to the two jets before the final clustering step. For large-radius jets with only a single sub-jet,
√ d
12is defined to be 0.
The jet yield measured in Pb+Pb collisions is compared to that measured in pp collisions using the nuclear modification factor, R
AA. R
AAis measured as a function of jet p
Tand
√ d
12in different Pb+Pb centrality intervals and is defined as
R
AA= 1 N
evtd
3N
jetd p
Td
√ d
12d y
centhT
AAi d
3σ
jetd p
Td
√ d
12d y
p p,
where N
jetand σ
jetare the jet yield in Pb+Pb collisions and the jet cross section in pp collisions, respectively, y is the jet rapidity
1, and N
evtis the total number of Pb+Pb collisions within a given centrality interval.
hT
AAi represents the mean nuclear thickness function that accounts for an enhancement of hard-scattering rate due to the larger geometric overlap between the colliding nuclei [16].
2 ATLAS detector
The measurements presented in this note are performed using the ATLAS calorimeter, inner detector, trigger, and data acquisition systems [17]. The calorimeter system consists of a sampling liquid-argon (LAr) electromagnetic (EM) calorimeter covering |η| < 3 . 2, a steel–scintillator sampling hadronic calorimeter covering |η| < 1 . 7, LAr hadronic calorimeters covering 1 . 5 < |η| < 3 . 2, and two LAr forward calorimeters (FCal) covering 3 . 1 < |η | < 4 . 9. The EM calorimeters are segmented longitudinally in shower depth into three layers with an additional pre-sampler layer. The hadronic calorimeters have three sampling layers longitudinal in shower depth in |η| < 1 . 7 and four sampling layers in 1 . 5 < |η| < 3 . 2, with a slight overlap.
The inner detector measures charged particles within the pseudorapidity interval |η| < 2 . 5 using a combination of silicon pixel detectors, silicon microstrip detectors (SCT), and a straw-tube transition radiation tracker (TRT), all immersed in a 2 T axial magnetic field [17]. Each of the three detectors is composed of a barrel and two symmetric end-cap sections. The pixel detector is composed of four layers including the Insertable B-Layer [18, 19]. The SCT barrel section contains four layers of modules with sensors on both sides, and each end-cap consists of nine layers of double-sided modules with radial strips.
The TRT contains layers of staggered straws interleaved with the transition radiation material.
1ATLAS uses a right-handed coordinate system with its origin at the nominal interaction point (IP) in the centre of the detector, and thez-axis along the beam pipe. Thex-axis points from the IP to the centre of the LHC ring, and they-axis points upward.
Cylindrical coordinates(r, φ)are used in the transverse plane,φbeing the azimuthal angle around thez-axis. The pseudorapidity is defined in terms of the polar angleθasη=−ln tan(θ/2). The rapidity is defined asy=0.5ln[(E+pz)/(E−pz)]whereE andpzare the energy andz-component of the momentum along the beam direction respectively. Transverse momentum and transverse energy are defined aspT=psinθandET=Esinθ, respectively. The angular distance between two objects with relative differences∆ηand∆φin pseudorapidity and azimuth respectively is given by
p(∆η)2+(∆φ)2.
The zero-degree calorimeters (ZDCs) are located symmetrically at z = ± 140 m and cover |η| > 8 . 3. The ZDCs use tungsten plates as absorbers and quartz rods sandwiched between the tungsten plates as the active medium. In Pb+Pb collisions, the ZDCs primarily measure “spectator” neutrons that do not interact hadronically when the incident nuclei collide. A ZDC coincidence trigger is implemented by requiring the pulse height from both ZDCs to be above a threshold that is set to accept the signal corresponding to the energy deposition from a single neutron.
Events used in this analysis were selected by a two-level trigger system. The first, a hardware-based trigger stage named Level-1, is implemented with custom electronics. The next level is the software-based High-Level Trigger (HLT). The events were selected by the HLT, which was seeded by a L1 jet trigger performing a simple sliding window algorithm to find jet candidates and requiring minimum thresholds of 15, 20, and 30 GeV. The HLT jet triggers use a jet reconstruction algorithm similar to that used in the offline analysis and applies cuts on the minimum transverse energy, E
T, of R = 0 . 4 jets of 60, 75, and 85 GeV with exception of the highest- E
Ttrigger in pp collisions requiring a large-radius, R = 1 . 0, jet with E
T> 110 GeV. The analysis is done in the region of jet p
Tfor which the triggers are fully efficient. In addition to the jet triggered sample, a minimum-bias (MB) triggered sample is used, which is defined by a logical OR of the following two triggers: a total energy Level-1 trigger of at least 50 GeV; a veto on the total-energy trigger, plus requirements of a ZDC coincidence trigger at Level-1 and at least one track in the HLT. More details about the jet triggering in heavy-ion collisions can be found in Ref. [20].
3 Event and data selection
This analysis utilizes 1.72 nb
−1of Pb+Pb data at √
s
NN= 5 . 02 TeV recorded in 2018 and 257 pb
−1of pp data collected in 2017 at the same collision energy. All events are required to have at least one reconstructed vertex, to have been collected during stable beam conditions, and to satisfy detector and data-quality requirements that include the detector subsystems being in nominal operating conditions. The number of inelastic interactions per bunch crossing is smaller than 3 × 10
−3in Pb+Pb collisions, resulting in a small fraction of events ( < 0 . 5%) containing multiple collisions, know as “pileup”. The anticorrelation between the total transverse energy deposited in the FCal, ΣE
FCalT
, and the number of neutrons detected in the ZDC is used to suppress these pileup events. Events with a much higher number of ZDC neutrons than the number expected from the bulk of events for a given value of ΣE
FCalT
are rejected. The pp data were collected with the average number of inelastic interactions per bunch crossing ranging from 1.4 to 4.4. No pileup rejection is applied in the analysis of pp data.
In Pb+Pb collisions, the event centrality reflects the overlap area of the two colliding nuclei and is characterized by the ΣE
FCalT
[21]. The five centrality intervals used in this analysis are defined according to successive percentiles of the ΣE
FCalT
distribution obtained in MB collisions, ordered from the most central (highest ΣE
FCalT
) to the most peripheral (lowest ΣE
FCalT
) collisions: 0–10%, 10–20%, 20–40%, 40–60%, and 60–80%. The values of the mean nuclear thickness function, hT
AAi , and the number of nucleons participating in the collision, N
part, in each centrality interval are evaluated by a Glauber model analysis of the ΣE
FCalT
distribution and tabulated in Ref. [5]. The total number of minimum-bias events in the centrality interval of 0-80%, that are used to estimate the per-event yields, corresponds to 10.2 billion.
This analysis uses several Monte Carlo (MC) samples to evaluate the performance of the detector and analysis procedure, and to correct the measured distributions for detector effects. The pp MC used in this analysis includes 32 × 10
6Pythia8 [22] pp jet events at
√ s = 5 . 02 TeV with the A14 ATLAS tune [23]
and the NNPDF23LO parton distribution functions [24]. Pileup from additional pp collisions is generated
by Pythia8, with parameter values set to the A2 tune [25] and using the MSTW2008 [26] PDF set, with a distribution of the number of extra collisions matching that of data.
The Pb+Pb MC sample uses 32 × 10
6pp Pythia8 events with the same tune and PDFs as in pp MC samples that are overlayed on top of events from a dedicated sample of Pb+Pb data events. This sample was recorded with combination of MB trigger and total energy triggers requiring 1.5 TeV or 6.5 TeV to enhance the number of central collisions. This “MC overlay” sample was reweighted on an event-by-event basis such that it has the same centrality distribution as the jet-triggered data sample. The detector response in all MC samples was simulated using Geant4 [27, 28].
4 Jet reconstruction and analysis procedure
The jet reconstruction procedures closely follow those used by ATLAS for previous jet measurements in Pb+Pb collisions. Jets were reconstructed using the anti- k
talgorithm [29] implemented in the FastJet software package [15]. The jets with radius parameter R = 0 . 2 were formed by clustering calorimetric
“towers” of spatial size ∆ η × ∆ φ = 0 . 1 ×
π32
. The energies in the towers are obtained by summing the energies of calorimeter cells at the electromagnetic energy scale [30] within the tower boundaries. A background subtraction procedure was applied that uses the UE average transverse energy density, ρ(η, φ) , where the φ dependence is due to global azimuthal correlations in the particle production typically referred to as “flow” [31]. The modulation accounts for the contribution of the second, third, and fourth-order azimuthal anisotropy harmonics characterized by values of flow coefficients v
n. The UE is also corrected for η - and φ -dependent non-uniformities of the detector response by multiplicative correction factor derived in MB Pb+Pb data. An iterative procedure was used to remove the impact of jets on ρ and the v
nvalues.
The first estimate of the UE average transverse energy density, ρ(η) , was evaluated in 0.1 intervals of η excluding those within “seed” jets. In the first step of the iterative subtraction, the seeds are defined to be a conjunction of R = 0 . 2 jets and R = 0 . 4 track jets. Track jets are reconstructed by applying the anti- k
talgorithm with R = 0 . 4 to charged particles with p
T> 4 GeV. The R = 0 . 2 jets have to pass a cut on the value of maximal-over-mean tower energy, while the track jets are required to have p
T> 7 GeV. The background is then subtracted from each tower constituent, and the jets’ kinematics are recalculated.
After the first iteration, the ρ and v
nvalues are updated by excluding regions within ∆R < 0 . 4 from the newly reconstructed R = 0 . 2 jets with p
T> 25 GeV (8 GeV in pp collisions), and track jets. The updated ρ and v
nvalues are used to update the jets’ kinematics in the second iteration.
Following the subtraction procedure, a jet η - and p
T-dependent multiplicative correction factors, derived in the MC simulations, are applied to the jet four-vector to correct for the calorimeter energy response [32].
An additional correction based on in situ studies of jets recoiling against photons, Z bosons, and jets in other regions of the calorimeter is applied [33]. This calibration is followed by “cross-calibration” which relates the jet energy scale (JES) of jets reconstructed by the procedure outlined in this section with the JES of jets used in 13 TeV pp collisions [34]. The jet reconstruction in pp collisions is performed using the same procedure as in heavy-ion collisions but without correcting the UE for η and φ variation in the detector response and without azimuthal modulation of the UE.
Generator-level jets are built from particle four-vectors obtained from the MC generator. Truth jets are
defined by applying the anti- k
talgorithm with radius parameter R = 0 . 2 to stable particles with a proper
lifetime greater than 30 ps, but excluding muons and neutrinos, which do not leave significant energy
deposits in the calorimeter.
1 2 3 4 5 6 Sub-jet multiplicity
−7
10
−6
10
−5
10
−4
10
−3
10
−2
10
−1
10 dypd T 1
2 jetNd 〉 AAT〈1 evtN1
Preliminary ATLAS
257 pb-1
pp
-1, Pb+Pb 1.72 nb
= 5.02 TeV sNN
0-10%
10-20%
20-40%
40-60%
60-80%
pp
<251 GeV pT
|<2.0 200<
y
|
1.0 jets R = Reclustered
1 2 3 4 5 6
Sub-jet multiplicity
−8
10
−7
10
−6
10
−5
10
−4
10
−3
10
−2
dypd10T 2 jetNd 〉 AAT〈1 evtN1
Preliminary ATLAS
257 pb-1
pp
-1, Pb+Pb 1.72 nb
= 5.02 TeV sNN
0-10%
10-20%
20-40%
40-60%
60-80%
pp
<398 GeV pT
|<2.0 316<
y
|
1.0 jets R = Reclustered
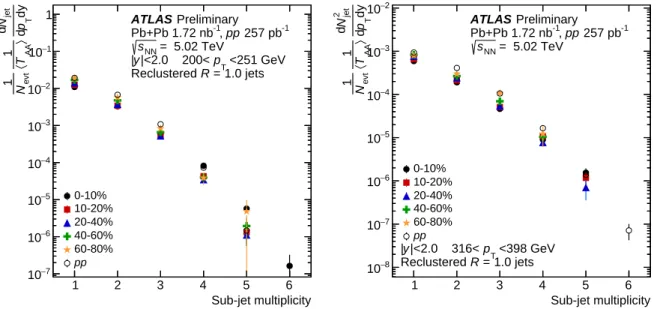
Figure 1: Uncorrected distributions of the number of sub-jets of the large-radius jets inppcollisions and five centrality intervals of Pb+Pb collisions for jet withpTin the range 200–251 GeV (left) and 316–398 GeV (right).
The reconstructed and truth large-radius jets used in this note are built by clustering the reconstructed and truth anti- k
tR = 0 . 2 jets, respectively, with p
T> 35 GeV and |η| < 3 . 0. The anti- k
talgorithm with distance parameter R = 1 . 0 is used. The resulting jets are referred to as large-radius jets in this note.
Reconstructed large-radius jets are matched to large-radius truth jets using the criterion ∆R < 0 . 75 for performance studies and deriving response matrices used in the unfolding. The k
tclustering of large-radius jet constituents with only single sub-jet results by convention in
√ d
12= 0. The intervals
√ d
12used in this analysis are designed in such that the first interval is populated only by large-radius jets with a single sub-jet (“SSJ”).
The measured uncorrected distributions of the number of sub-jets of large-radius jets in pp and Pb+Pb collisions for jets with p
Tof 200–251 GeV and 316–398 GeV are presented in Figure 1. The yields of large-radius jets sharply decrease with increasing sub-jets multiplicity with the most probable configuration of single sub-jet both in Pb+Pb and pp collisions. The centrality dependence shows an overall decrease in the yields of large-radius jets in more central collisions at lower multiplicities and an enhancement at higher multiplicities for lower p
Tlarge-radius jets. The enhancement can be attributed to the contribution of combinatorial jets from independent hard scatterings in one Pb+Pb collision and from jet energy resolution.
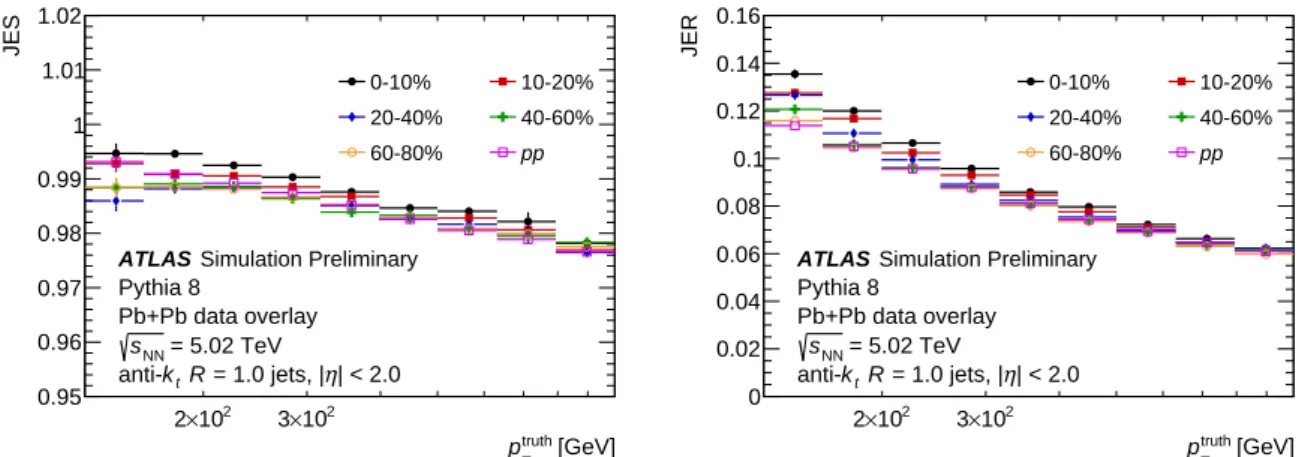
Performance of the reconstruction of large-radius jets is characterised by evaluating the JES and jet energy resolution (JER), which correspond to the mean and width of p
recoT
/p
truthT
distribution, respectively, where p
recoT
is the reconstructed large-radius jet p
Tand p
truthT
is transverse momentum of the matched large-radius truth jet. The JES and JER as a function of p
truthT
are shown in Figure 2 . The JES deviates from unity by
less than 1% for low- p
Tlarge-radius jets and up to 2% for high- p
Tlarge-radius jets with no significant
centrality dependence. Typically in HI collisions, increasing the value of R results in a larger JER as the
larger area jet includes more UE. In this case, because the R = 1 . 0 jets are reclustered from R = 0 . 2 jets and
have small sub-jet multiplicity, this effect is not very large and the resolution is similar to that of R = 0 . 2
jets [35].
102
×
2 3×10²
[GeV]
truth
pT
0.95 0.96 0.97 0.98 0.99 1 1.01 1.02
JES
0-10% 10-20%
20-40% 40-60%
60-80% pp
ATLAS Simulation Preliminary Pythia 8
Pb+Pb data overlay = 5.02 TeV sNN
| < 2.0 η = 1.0 jets, |
tR k anti-
102
×
2 3×10²
[GeV]
truth
pT
0 0.02 0.04 0.06 0.08 0.1 0.12 0.14 0.16
JER
0-10% 10-20%
20-40% 40-60%
60-80% pp
ATLAS Simulation Preliminary Pythia 8
Pb+Pb data overlay = 5.02 TeV sNN
| < 2.0 η = 1.0 jets, |
tR k anti-
Figure 2: The JES (left) and JER (right) as a function ofptruth
T evaluated inppand 5 centrality intervals of Pb+Pb MC events forR=1.0 jets within|y|<2.0.
The large-radius jet yields in Pb+Pb collisions and jet cross-section in pp collisions are measured in the rapidity range of | y | < 2 . 0. The
√ d
12-inclusive measurement is performed as a function of the large-radius jet p
Tfrom 156 GeV to 1 TeV. The measurement as a function of the
√ d
12is presented in coarser p
Tintervals ranging from 200 GeV to 500 GeV and for
√
d
12values from 0 to 172 GeV.
The measured distributions are fully corrected for detector effects by the unfolding procedure using the iterative Bayesian unfolding method [36] from the RooUnfold software package [37]. The unfolding removes the effects of bin migrations due to the jet energy resolution and residual jet energy scale non-closure. The unfolding also corrects for the combinatoric sub-jet contribution resulting in the migration in
√ d
12. The yields as a function of
√ d
12are unfolded using a two-dimensional unfolding simultaneously in p
Tand
√
d
12while the inclusive jet yields are unfolded using a one-dimensional unfolding in p
T. The response matrices are built from large-radius reconstructed jets matched to large-radius truth jets. The unmatched truth jets are incorporated as an efficiency correction. No reconstructed-to-truth jet matching requirement is imposed on sub-jets. The response matrices are generated separately for pp collisions and for each centrality interval in Pb+Pb collisions. To better represent the data, the response was re-weighted along the truth-jet axes by the reconstructed level data-to-MC ratio. The number of iterations in the unfolding was chosen so that the result is stable when changing the number of iterations while minimizing the amplification of statistical uncertainties. Four iterations are used to unfold inclusive large-radius yields and six iterations are used in the two-dimensional unfolding of the yields as a function of
√ d
12.
5 Systematic uncertainties
The following sources of systematic uncertainty are considered for this analysis: JES, JER, the sensitivity of the unfolding to the prior, the MC statistical uncertainty, the residual non-closure of the analysis procedure, the determination of the mean nuclear thickness function hT
AAi values, and the pp luminosity.
The uncertainties of JES and JER are applied to small-radius jets and propagated through reclustering to large-radius jets.
The systematic uncertainty on jets due to the JES has five components. First part is a centrality-independent
baseline component that is determined from in situ studies of the calorimeter response of jets reconstructed
with procedure used in 13 TeV pp collisions [38, 39]. The second centrality-independent component accounts for the relative energy scale difference between the jet reconstruction procedures used in this note and that in 13 TeV pp collisions [34]. Potential inaccuracies in the MC sample in the description of the relative abundances of jets initiated by quarks and gluons and of the calorimetric response to quark and gluon jets are accounted for by the third component. The fourth, centrality-dependent, component accounts for a different structure and possibly a different detector response of jets in Pb+Pb collisions that is not modeled by the MC. It is evaluated by the method used for 2015 and 2011 data [34] that compares calorimeter p
Tand the sum of the transverse momentum of charged particles within the jet in data and MC samples. The size of the centrality-dependent uncertainty on the JES reaches 0.8% in the most central collisions. The systematic uncertainties from JES discussed above are derived for R = 0 . 4 jets.
The last component does not depend on collision centrality and it accounts for the potential difference in uncertainties between R = 0 . 4 and R = 0 . 2 jets. Centrality-independent components affect the JES both in pp and Pb+Pb collisions and are correlated between the two colliding systems while the third component is applied only to Pb+Pb collisions. Each component is varied separately by ± 1 standard deviations in MC samples, applied as a function of p
Tand η , and the response matrix is recomputed. The data are then unfolded with the modified matrices. The resulting uncertainty from the JES on the inclusive jet spectra is at the level of 10% with a small increase with collision centrality and p
T. The size of the uncertainty due to the JES is significantly reduced when R
AAdistributions are evaluated and varies from 3% at low p
Tto 5%
at high p
T. The uncertainty on jet yields as a function of
√ d
12is similar to that on inclusive jet spectra except for an increase at the lowest intervals of
√ d
12.
The uncertainty due to the JER is evaluated by repeating the unfolding procedure with modified response matrices, where an additional contribution is added to the resolution of the reconstructed p
jetT
using a Gaussian smearing procedure. The smearing factor is evaluated using an in situ technique in 13 TeV pp data that involves studies of dijet energy balance [40, 41] with additional contributions accounting for differences in calibration procedures for jets used in this analysis and those from 13 TeV pp data. Further, uncertainty is included to account for differences between the tower-based jet reconstruction and the jet reconstruction used in analyses of 13 TeV pp data. Similarly to the JES, an additional uncertainty on the JER is added to account for differences between R = 0 . 2 and R = 0 . 4 jets. The resulting uncertainty from the JER is symmetrized. The size of the resulting uncertainty due to the JER typically reaches 3% on the inclusive large-radius jet yields, but it reaches up to 20% in the measurement of jet yields as a function of
√ d
12at lowest values of
√ d
12in the central Pb+Pb collisions.
The systematic uncertainty on the unfolding procedure is estimated by repeating the analysis with response matrices without the re-weighting to match the shapes of measured distributions in data. The difference between the nominal distribution and that unfolded with the un-reweighted response matrix is taken as the systematic uncertainty. This results in an uncertainty less than 1% on the inclusive jet spectra and R
AA(p
T) , but it is up to 20% for R
AA( √
d
12) at the lowest values of
√ d
12.
The uncertainty of the mean nuclear thickness function arises from geometric modeling uncertainties (nucleon–nucleon inelastic cross-section, Woods–Saxon parameterization of the nucleon distribution) and the uncertainty of the fraction of selected inelastic Pb+Pb collisions. The values of these uncertainties are taken from Ref. [42]. The integrated luminosity determined for 2017 pp data was calibrated using data from dedicated beam separation scans with the relative systematic uncertainty of 1.6%.
The sensitivity to the statistical limitations of the MC samples is determined through pseudo-experiments by re-sampling entries in the response matrices according to their uncertainty. The resulting uncertainty is smaller than 1% in the inclusive large-radius jet measurement and for low values of
√ d
12, and increases to up to 5% for the highest values of
√ d
12. Uncertainties arising from statistical fluctuations at the data
are evaluated using a similar procedure, by re-sampling the data distributions according to their statistical uncertainties.
An additional uncertainty to account for possible residual limitations in the analysis procedure is assigned by evaluating the non-closure of the unfolded distributions in simulations.
The correlations between the various components of the systematic uncertainty are considered in evaluating the R
AA. The uncertainties due to the mean nuclear thickness function, the limitation in MC statistics, pp luminosity, the centrality-dependent component of the JES, and the statistical uncertainty on the data are taken to be uncorrelated between pp and Pb+Pb collisions, while all others are taken to be correlated.
The partial cancellation of the resulting systematic uncertainties from correlated sources results in smaller uncertainties on the R
AAdistributions compared to those on the cross-sections and yields. Systematic uncertainties can be also categorised into two classes based on their point-to-point correlation: bin-wise correlated uncertainties and uncertainties that affect the overall normalisation of distributions. Uncertainties due to the determination of hT
AAi and pp luminosity belong to the second class, all other uncertainties belong to the first.
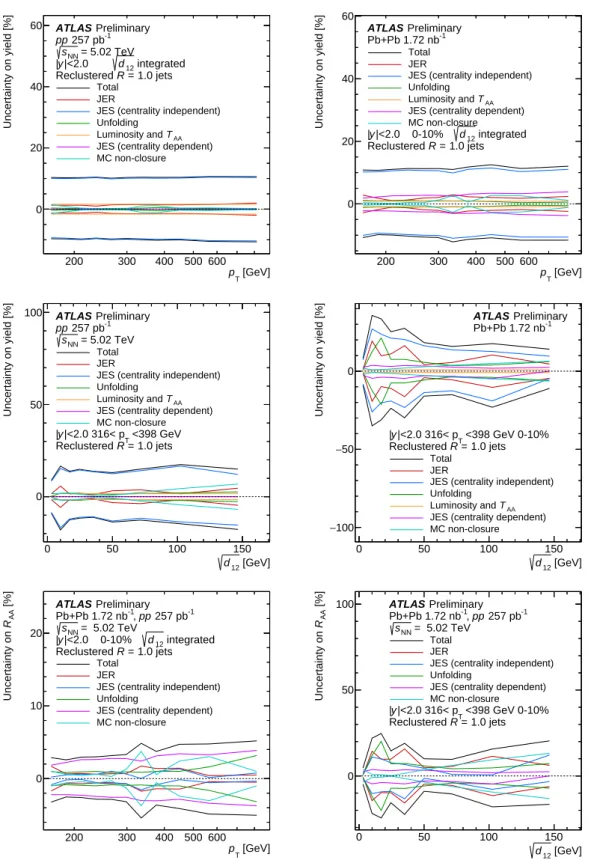
Examples of systematic uncertainties are shown in Figure 3 for the inclusive large-radius jet cross-sections and yields in pp and Pb+Pb collisions, for large-radius jet yields as a function of
√ d
12with p
Tin the interval of 316–398 GeV, and for R
AA. The total uncertainties for cross-sections and yields are dominated by the centrality independent uncertainty from the JES both in pp and Pb+Pb collisions, while the uncertainty for R
AAis dominated by the centrality dependent component. Uncertainties on unfolding and JER contribute significantly in low values of
√ d
12in Pb+Pb collisions.
6 Results
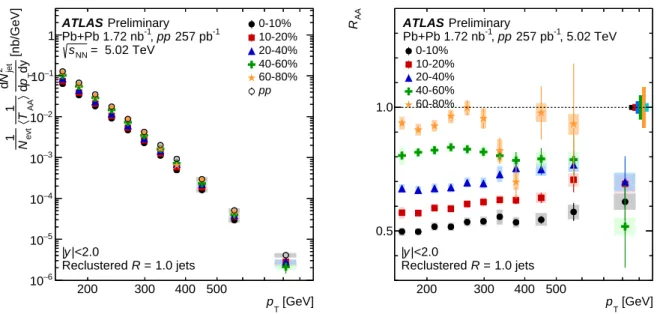
The inclusive large-radius jet cross-section in pp collisions and per-event Pb+Pb yields scaled by hT
AAi in five centrality intervals are shown in the left panel of Figure 4. The error bars in the figure represent statistical uncertainties while the shaded boxes represent systematic uncertainties. The systematic uncertainties also include the point-to-point correlated uncertainty of the luminosity and hT
AAi . The jet cross-section and jet yields are presented in a rapidity interval of | y | < 2 . 0 and for large-radius jets with p
Tbetween 158 GeV and 1000 GeV.
The nuclear modification factor, R
AA, evaluated as a function of jet p
Tin five centrality intervals is presented in the right panel of Figure 4. A clear suppression of the inclusive large-radius jet production in central Pb+Pb collisions with respect to pp collisions can be seen. In 0-10% central collisions the R
AAreaches a value of approximately 0.5 at p
T= 200 GeV while growing slowly with increasing jet p
T. It stays bellow 0.6 for jets with p
Tup to 600 GeV. These observations are in qualitative agreement with those reported in a similar measurement performed in Pb+Pb collisions at √
s
NN= 5 . 02 TeV for R = 0 . 4 jets [42].
However, the magnitude of the R
AAis lower compared to that for R = 0 . 4 jets which reaches a value of 0.6 around 300 GeV. The comparison of R
AAfor R = 0 . 4 and R = 1 . 0 is presented in Figure 5. Various theoretical calculations of the jet quenching where the jet energy is distributed to soft particles predict a smaller suppression when expanding the jet radius by recovering more lost energy [43, 44]. This is not the case for the re-clustered jets where the energy radiated between R = 0 . 2 sub-jets is removed and lost energy is not recovered.
The inclusive R = 1 . 0 jet cross-section in pp collision data compared with per-event-yields scaled by hT
AAi in Pb+Pb collisions as a function of the k
tsplitting scale
√ d
12in four intervals of jet p
Tranging from
200 300 400 500 600 [GeV]
pT
0 20 40 60
Uncertainty on yield [%]
Preliminary ATLAS
257 pb-1
pp
= 5.02 TeV sNN
Total JER
JES (centrality independent) Unfolding
TAA
Luminosity and JES (centrality dependent) MC non-closure
integrated d12
|<2.0 y
|
1.0 jets R = Reclustered
200 300 400 500 600
[GeV]
pT
0 20 40 60
Uncertainty on yield [%]
Preliminary ATLAS
Pb+Pb 1.72 nb-1 Total JER
JES (centrality independent) Unfolding
TAA
Luminosity and JES (centrality dependent) MC non-closure
integrated d12
|<2.0 0-10%
y
|
1.0 jets R = Reclustered
0 50 100 150
[GeV]
d12
0 50 100
Uncertainty on yield [%]
Preliminary ATLAS
257 pb-1
pp
= 5.02 TeV sNN
Total JER
JES (centrality independent) Unfolding
TAA
Luminosity and JES (centrality dependent) MC non-closure
<398 GeV
|<2.0 316< pT
y
|
1.0 jets R = Reclustered
0 50 100 150
[GeV]
d12
−100
−50 0
Uncertainty on yield [%]
Preliminary ATLAS
Pb+Pb 1.72 nb-1
Total JER
JES (centrality independent) Unfolding
TAA
Luminosity and JES (centrality dependent) MC non-closure
<398 GeV 0-10%
|<2.0 316< pT
y
|
1.0 jets R = Reclustered
200 300 400 500 600
[GeV]
pT
0 10 20 [%]AARUncertainty on
Preliminary ATLAS
257 pb-1
pp
-1, Pb+Pb 1.72 nb
= 5.02 TeV sNN
Total JER
JES (centrality independent) Unfolding
JES (centrality dependent) MC non-closure
integrated d12
|<2.0 0-10%
y
|
1.0 jets R = Reclustered
0 50 100 150
[GeV]
d12
0 50 [%]RUncertainty on AA 100
Preliminary ATLAS
257 pb-1
pp
-1, Pb+Pb 1.72 nb
= 5.02 TeV sNN
Total JER
JES (centrality independent) Unfolding
JES (centrality dependent) MC non-closure
<398 GeV 0-10%
|<2.0 316< pT
y
|
1.0 jets R = Reclustered
Figure 3: Relative size of the systematic uncertainties for inclusiveR =1.0 jet cross-sections and yields inpp (top-left panel) and Pb+Pb collisions (top-right panel), for large-radius jet yields measured as a function of
√d12
withpTin the range 316–398 GeV inppand Pb+Pb collisions (middle panels), and forRAAas function of jetpT (bottom-left) and
√d12(bottom-right). The systematic uncertainties due to centrality dependent and independent JES, JER, unfolding, MC non-closure, luminosity andhT iare shown. Uncertainty onhT iand luminosity is
200 300 400 500
[GeV]
pT
−6
10
−5
10
−4
10
−3
10
−2
10
−1
10 1 [nb/GeV] dy Tpd
2 jetNd 〉 AAT〈1 evtN1
Preliminary ATLAS
257 pb-1
pp
-1, Pb+Pb 1.72 nb
= 5.02 TeV sNN
0-10%
10-20%
20-40%
40-60%
60-80%
pp
|<2.0 y
|
1.0 jets R = Reclustered
200 300 400 500
[GeV]
pT
0.5 1.0
AAR PreliminaryATLAS
, 5.02 TeV 257 pb-1
pp
-1, Pb+Pb 1.72 nb
0-10%
10-20%
20-40%
40-60%
60-80%
|<2.0 y
|
1.0 jets R = Reclustered
Figure 4: Left: comparison ofhTAAinormalized per-event inclusiveR=1.0 jet yields in five centrality intervals in Pb+Pb collisions and cross-section inppcollisions. Right: The values ofRAAfor inclusiveR=1.0 jets as function ofpTin five centrality intervals. The vertical bars on the data points indicate statistical uncertainties, while the shaded boxes indicate systematic uncertainties. The systematic uncertainties on yields also include the uncertainty due to the luminosity andhTAAi, which is correlated for all the data points. The colored boxes atRAA= 1 represent fractional uncertainty onhTAAiandppluminosity (cyan), which both affect the overall normalisation. The widths of the boxes are not indicative of the bin size.
200 300 400 500
[GeV]
pT
0.4 0.6 0.8 1.0
AAR PreliminaryATLAS
, 5.02 TeV 257 pb-1
pp
-1, Pb+Pb 1.72 nb
=1.0 reclustered jets (this analysis) R= 0.4 (PLB 790 (2019) 108) R
|<2.0 y
|
Figure 5: Comparison ofRAAforR=1.0 jets as a function of jetpTto the same quantity measured withR=0.4 anti-ktjets [42] in 0–10% centrality interval. TheRAAforR=0.4 is evaluated for jets with|y| <2.8 while this analysis is done for jets with|y|<2.0. The vertical bars on the data points indicate statistical uncertainties, while the shaded boxes indicate systematic uncertainties. The colored boxes atRAA= 1 represent fractional uncertainty on hTAAi(black) andppluminosity in this measurement (cyan) andppluminosity in previous analysis [42](light-blue), which both affect the overall normalisation. The widths of the boxes are not indicative of the bin size.
50 100 150 [GeV]
d12 8
10− 6
10− 4
10− 2
10−
[nb/GeV] dy12dd Tpd
3 jet
Nd 〉AAT〈1 evtN1
Preliminary
ATLAS -1
257 pb pp
-1, Pb+Pb 1.72 nb
= 5.02 TeV sNN
0-10%
10-20%
20-40%
40-60%
60-80%
pp
<251 GeV pT
|<2.0 200<
y
| R =1.0 jets
Reclustered
SSJ 50 100 150
[GeV]
d12 7
10− 6
10− 5
10− 4
10− 3
10− 2
10−
[nb/GeV] dy12dd Tpd
3 jet
Nd 〉AAT〈1 evtN1
Preliminary
ATLAS -1
257 pb pp
-1, Pb+Pb 1.72 nb
= 5.02 TeV sNN
0-10%
10-20%
20-40%
40-60%
60-80%
pp
<316 GeV pT
|<2.0 251<
y
| R =1.0 jets
Reclustered SSJ
50 100 150
[GeV]
d12 7
10− 6
10− 5
10− 4
10− 3
10−
[nb/GeV] dy12dd Tpd
3 jet
Nd 〉AAT〈1 evtN1
Preliminary
ATLAS -1
257 pb pp
-1, Pb+Pb 1.72 nb
= 5.02 TeV sNN
0-10%
10-20%
20-40%
40-60%
60-80%
pp
<398 GeV pT
|<2.0 316<
y
| R =1.0 jets
Reclustered
SSJ 50 100 150
[GeV]
d12 7
10− 6
10− 5
10− 4
10−
[nb/GeV] dy12dd Tpd
3 jet
Nd 〉AAT〈1 evtN1
Preliminary
ATLAS -1
257 pb pp
-1, Pb+Pb 1.72 nb
= 5.02 TeV sNN
0-10%
10-20%
20-40%
40-60%
60-80%
pp
<500 GeV pT
|<2.0 398<
y
| R =1.0 jets
Reclustered SSJ
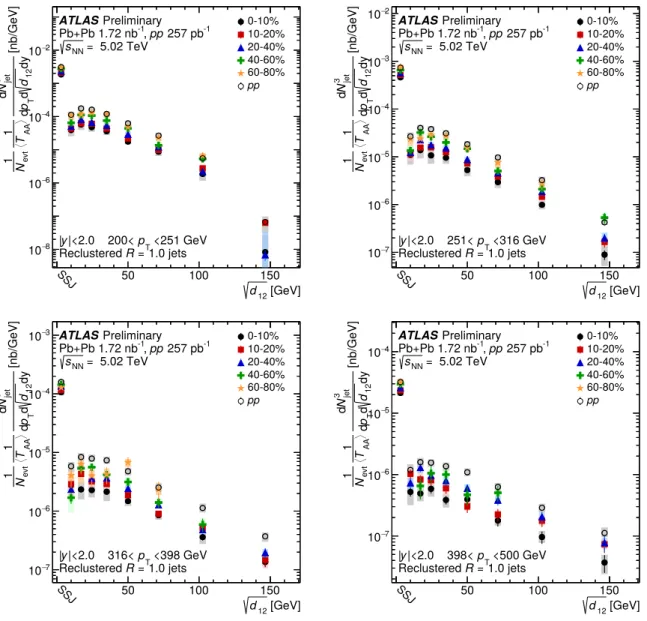
Figure 6: Comparison ofhTAAinormalized per-eventR=1.0 jet yields as function ofktsplitting scale,
√d12, in five
centrality and four jetpTintervals in Pb+Pb collisions and large-radius jet cross-section inppcollisions. The vertical bars on the data points indicate statistical uncertainties, while the shaded boxes indicate systematic uncertainties.
The systematic uncertainties also include the uncertainty due to the luminosity andhTAAi, which is correlated for all the data points. The widths of the boxes are not indicative of the bin size. The first interval is populated only by large-radius jets with a single sub-jet and labeled as “SSJ”.
200 GeV to 500 GeV is shown in Figure 6. The per-event hT
AAi normalized jet yields in Pb+Pb fall below cross-section in pp collisions, showing the jet suppression in all intervals of
√ d
12.
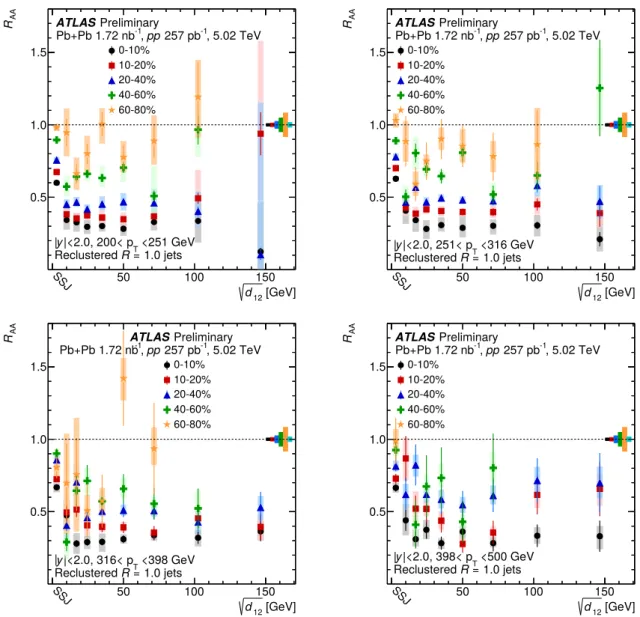
The nuclear modification factor evaluated as a function of the
√ d
12is shown in Figure 7. The R
AAvalues for large-radius jets with a single sub-jets is significantly different compared to the R
AAfor large-radius jets with more complex substructure with a non-zero
√ d
12. The R
AAsharply decreases with increasing
√ d
12for small values of the splitting scale followed by flattening for larger
√ d
12. This observation is
qualitatively consistent with the effects where the medium can not resolve partonic fragments below a
50 100 150 [GeV]
d12
0.5 1.0 1.5
AAR PreliminaryATLAS
, 5.02 TeV 257 pb-1
pp
-1, Pb+Pb 1.72 nb
0-10%
10-20%
20-40%
40-60%
60-80%
<251 GeV
|<2.0, 200< pT
y
| R =1.0 jets
Reclustered
SSJ 50 100 150
[GeV]
d12
0.5 1.0 1.5
AAR PreliminaryATLAS
, 5.02 TeV 257 pb-1
pp
-1, Pb+Pb 1.72 nb
0-10%
10-20%
20-40%
40-60%
60-80%
<316 GeV
|<2.0, 251< pT
y
| R =1.0 jets
Reclustered SSJ
50 100 150
[GeV]
d12
0.5 1.0 1.5
AAR PreliminaryATLAS
, 5.02 TeV 257 pb-1
pp
-1, Pb+Pb 1.72 nb
0-10%
10-20%
20-40%
40-60%
60-80%
<398 GeV
|<2.0, 316< pT
|y
1.0 jets R = Reclustered
SSJ 50 100 150
[GeV]
d12
0.5 1.0 1.5
AAR PreliminaryATLAS
, 5.02 TeV 257 pb-1
pp
-1, Pb+Pb 1.72 nb
0-10%
10-20%
20-40%
40-60%
60-80%
<500 GeV
|<2.0, 398< pT
y
| R =1.0 jets
Reclustered SSJ
Figure 7:RAAofR=1.0 jet yields as function ofktsplitting scale,
√d12, in five centrality and four jetpTintervals.
The vertical bars on the data points indicate statistical uncertainties, while the shaded boxes indicate systematic uncertainties. The colored boxes atRAA= 1 represent fractional uncertainty onhTAAiandppluminosity (cyan), which both affect the overall normalisation. The widths of the boxes are not indicative of the bin size. The first interval is populated only by large-radius jets with a single sub-jet and labeled as “SSJ”.
certain transverse scale [10]. However, the magnitude of the suppression is expected to depend no only on the energy loss but also on the shape of the initial jet production p
Tspectrum. This result is also consistent with the previous measurement of correlated production of pairs of nearby jets in Pb+Pb collisions [5].
The measurement reported suppression of yields of neighboring jets by 30% to 50% in the most central collisions with respect to the pp reference which suggests even larger suppression of per-event yields when the suppression of inclusive jet yields is taken into account.
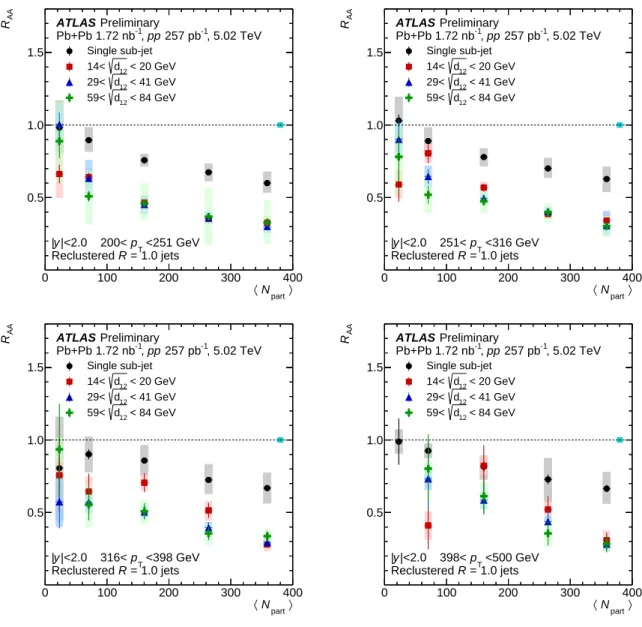
The nuclear modification factor, evaluated as a function of √ hN
parti , is shown in Figure 8 for four jet p
Tand
d
12intervals. The systematic uncertainties on data points include also the uncertainty from the hT
AAi . A
0 100 200 300 400
part〉
〈N 0.5
1.0 1.5
AAR PreliminaryATLAS
, 5.02 TeV 257 pb-1
pp
-1, Pb+Pb 1.72 nb
Single sub-jet < 20 GeV d12
14<
< 41 GeV d12
29<
< 84 GeV d12
59<
<251 GeV pT
|<2.0 200<
y
|
1.0 jets R = Reclustered
0 100 200 300 400
part〉
〈N 0.5
1.0 1.5
AAR PreliminaryATLAS
, 5.02 TeV 257 pb-1
pp
-1, Pb+Pb 1.72 nb
Single sub-jet < 20 GeV d12
14<
< 41 GeV d12
29<
< 84 GeV d12
59<
<316 GeV pT
|<2.0 251<
y
|
1.0 jets R = Reclustered
0 100 200 300 400
part〉
〈N 0.5
1.0 1.5
AAR PreliminaryATLAS
, 5.02 TeV 257 pb-1
pp
-1, Pb+Pb 1.72 nb
Single sub-jet < 20 GeV d12
14<
< 41 GeV d12
29<
< 84 GeV d12
59<
<398 GeV pT
|<2.0 316<
y
|
1.0 jets R = Reclustered
0 100 200 300 400
part〉
〈N 0.5
1.0 1.5
AAR PreliminaryATLAS
, 5.02 TeV 257 pb-1
pp
-1, Pb+Pb 1.72 nb
Single sub-jet < 20 GeV d12
14<
< 41 GeV d12
29<
< 84 GeV d12
59<
<500 GeV pT
|<2.0 398<
y
|
1.0 jets R = Reclustered
Figure 8: TheRAAvalues evaluated as a function ofhNpartifor four differentR=1.0 jetpTintervals and different intervals of
√d12. The vertical bars on the data points indicate statistical uncertainties, while the shaded boxes
indicate systematic uncertainties. The systematic uncertainties also include the uncertainty due to thehTAAi. The cyan box atRAA= 1 represents fractional uncertainty onppluminosity. The widths of the boxes are not indicative of the bin size.