ATLAS-CONF-2016-108 29September2016
ATLAS NOTE
ATLAS-CONF-2016-108
25th September 2016
Measurement of charged particle spectra in pp collisions and nuclear modification factor R pPb at √
s
NN= 5.02 TeV with the ATLAS detector at the LHC
The ATLAS Collaboration
Abstract
This note presents an analysis of the inclusive charged particle spectra in pp collisions at
√ s = 5.02 TeV that are measured with the ATLAS experiment at the LHC. The measure- ments are performed with pp data recorded in 2015 with an integrated luminosity of 25 pb
−1. The ratio of spectra measured in the p +Pb collisions to the pp cross section scaled by the number of binary nucleon–nucleon collisions, R
pPb, is evaluated to facilitate a comparison of the particle production in the two colliding systems. The nuclear modification factor does not show any significant deviation from unity in the probed transverse momentum region.
c
2016 CERN for the benefit of the ATLAS Collaboration.
1 Introduction
The partonic structure of nuclei has been studied extensively in deep inelastic scattering experiments [1].
These measurements have established di ff erences in the parton distribution functions (PDFs) in nuclei from those expected from an incoherent superposition of nucleons, which include the phenomena of shadowing, anti-shadowing [2] and the EMC effect [3]. These observations have inspired significant the- oretical work [4–8], but to date the underlying physics of these phenomena is not completely understood.
Proton-ion collisions at the LHC can be used to probe the nucleus at never before experimentally ac- cessible scales. This includes particle production from hard scattering processes with large momentum transfer Q
2, which may provide crucial insight into the large-Q
2structure of the nucleus or even reveal previously unobserved phenomena.
Nuclear modification effects are studied by comparing quantities in heavy ion collisions to a correspond- ing quantity obtained in pp collisions. The rates of hard scattering processes in heavy ion collisions are enhanced relative to pp collisions due to the increased flux of partons per collision because the nucleus contains many nucleons capable of participating in a hard scattering. This enhancement depends on the thickness of the target nucleus, T
pPb, at the impact parameter of the projectile. The nuclear modification factor, R
pPb, can be inferred from geometric models such as the Glauber model [9]. The particle yields in p +Pb collisions, once scaled by T
pPb, can then be compared directly to the cross section for the same process obtained in pp collisions. Nuclear modifications are expected to vary with the collision geometry, and thus it is desirable to study such effects while varying the collisions geometry. Typically, a relation- ship between the collision geometry and the total event activity is assumed. Events are assigned to a particular centrality class on the basis of total transverse energy, P
E
TPb, measured in the Pb-going side of the forward calorimeter. The yield in each centrality class is then scaled by the average T
pPbfor the corresponding centrality class. This leads to the definition of the nuclear modification factor:
R
pPb( p
T, y) = 1 hT
pPbi
1/N
evtd
2N
pPb/dydp
Td
2σ
pp/dyd p
T, (1)
where 1/N
evtd
2N/d p
Tdy is the per-event charged particle yield in p +Pb collisions at 5.02 TeV measured di ff erentially in transverse momentum p
Tand rapidity
1y and d
2σ/dp
Tdy is the cross section measured in pp collisions, also differentially in p
Tand y.
The CMS collaboration performed a measurement of inclusive charged particle production [10] that shows an enhancement of approximately 30% with respect to unity in R
pPbfor particles with p
T& 20 GeV.
Preliminary results from ATLAS [11] show an enhancement compatible both with the CMS result and with unity. The ALICE experiment measured R
pPbin somewhat lower p
Tregion [12]. Trends shown by ALICE does not support, but also does not fully exclude the enhancement seen by CMS. All these measurements used a reference which was derived by interpolating between pp data taken at other √
s as no pp data were available at √
s = 5.02 TeV at that time. This is referred to as the “interpolated reference"
in this note.
1ATLAS uses a right-handed coordinate system with its origin at the nominal interaction point (IP) in the center of the detector and thez-axis along the beam pipe. Thex-axis points from the IP to the center of the LHC ring, and theyaxis points upward.
Cylindrical coordinates (r, φ) are used in the transverse plane,φbeing the azimuthal angle around the beam pipe. For the p+Pb collisions, the incident Pb beam traveled in the+zdirection. The pseudorapidity is defined in laboratory coordinates in terms of the polar angleθasη=−ln tan(θ/2). Rapidity is definedy=0.5 ln
(E+pz)/(E−pz)
, whereEis the energy and pzis the longitudinal momentum. All rapidity values quoted in this note are defined in center-of-mass coordinates.
This note presents a measurement of the charged particle cross section in pp collisions at √
s = 5.02 TeV as a function of transverse momentum in the range from 4 to 189 GeV and in the rapidity range from -2 to 1.5. The results are compared to the p + Pb data presented in Ref. [11] in order to provide a direct comparison of charged particle production in the two systems using the data measured at the same center- of-mass energy.
2 The ATLAS detector
The measurements presented in this note are performed using the ATLAS Inner detector (ID), calorimeter system, trigger system and data acquisition systems [13]. The ID measures the trajectories of charged particles with a combination of silicon pixel detector (Pixel), silicon micro-strip detector (SCT), and a straw-tube transition radiation tracker (TRT), all of which are immersed in a 2 T axial magnetic field. A particle travelling from the interaction point with |η| < 2 crosses at least 4 pixel layers, 4 double sided micro-strip layers and typically 36 straw tubes.
The calorimeter system consists of a liquid argon (LAr) electromagnetic (EM) calorimeter covering |η| <
3.2, a steel-scintillator sampling hadronic calorimeter covering |η| < 1.7, a LAr hadronic calorimeter covering 1.5 < |η| < 3.2, and two LAr forward calorimeters (FCal) covering 3.2 < |η| < 4.9. The EM calorimeters are longitudinally segmented into three layers with an additional pre-sampler layer. Together, they provide 10 interaction lengths of material.
Data are recorded with a multi-stage trigger system. Events are selected using Level-1 triggers (L1) and then processed by a high-level trigger (HLT) to provide additional rejection.
3 Event selection and data samples
The pp data at √
s = 5.02 TeV were recorded in 2015 with a total luminosity of 25 pb
−1. The events used in the analysis were recorded with a minimum bias (MB) trigger and with several jet triggers. The MB trigger required an event to be randomly selected at L1 and a track to be reconstructed in the ID system.
The jet triggers used an anti-k
tjet algorithm [14] with a radius parameter of R = 0.4 and various thresh- olds. Different selections at L1 were used as described below.
The jet trigger with the lowest threshold required a randomly selected event at L1, and the presence of a jet with p
T> 20 GeV. At least 5 and 10 GeV, respectively, of total transverse energy in the calorimeter were required at L1 for jet thresholds of 30 and 40 GeV. For jet triggers with thresholds 50, 60, 75 and 85 GeV, events at L1 were required to deposit transverse energy above 12, 15, 20 and again 20 GeV, respectively, in an area of ∆ η × ∆ φ = 0.8× 0.8 in the calorimeter. The triggers were recorded with different prescales. The prescale determines which fraction of events that passed the trigger selection were selected for recording by the data acquisition system. A trigger with higher threshold has usually a lower prescale than a trigger with lower threshold.
In addition, the events were required to have a reconstructed vertex no further than 150 mm in the z
direction from the center of the detector.
To study the e ff ects of the detector response, Monte Carlo (MC) simulations were produced using the PYTHIA event generator [15]. The detector response was then simulated by GEANT4 [16, 17] and reconstructed and analyzed in the same way as the data
4 Reconstruction of charged particle spectra
Charged-particle tracks were reconstructed using the ID system in the pseudorapidity region |η| < 2.5 and over the full azimuth. At least one hit is required in one of the two inner layers of the Pixel detector. If the track passed an active module in the innermost layer a hit in this layer is required. Further, a track has to have no more than two holes in the Pixel and SCT detectors together. A hole is defined by the absence of a hit predicted by the track trajectory. In addition, a track is required to have at least 9 (11) Pixel and SCT hits together, if its |η| is lower (higher) than 1.65. In case there are less than 10 Pixel and SCT hits, no holes are allowed along the track. To ensure a good matching to the vertex, a p
T-dependent requirement on d
0, the distance of the closest approach to the vertex in the transverse direction, is imposed on tracks as well.
Tracks in events recorded by jet triggers are required to be matched to a jet within ∆ R = p
∆
2η + ∆
2φ <
0.4 and have p
T≤1.3 × p
Tjet, accounting for energy conservation and possible jet energy mismeasurement.
Only jets with su ffi cient energy to have a fully e ffi cient trigger are considered. The jet trigger with the lowest threshold becomes fully e ffi cient at p
Tjet= 26 GeV.
Tracks in different p
Tregions of the MB-equivalent spectra come from events taken with different triggers.
Tracks in MB triggered events are required to either not be matched to any jet, or to be matched to a jet with p
Tjet< 26 GeV. Tracks matched to jets with higher p
Tjetare excluded from the MB samples. Tracks in events recorded by the lowest jet trigger are required to be matched to a jet with 26 < p
Tjet< 35 GeV.
The upper bound of 35 GeV is the p
Tjetwhere the second lowest jet trigger becomes fully efficient. Thus, in the range 26 < p
Tjet< 35 GeV only the lowest jet trigger is fully e ffi cient. Tracks in events recorded by the second lowest jet trigger (threshold 30 GeV) are required to be matched to a jet with p
Tjetwhere the trigger is fully efficient, but the higher-threshold trigger is not. Following this procedure up to the jet trigger with the highest threshold, the whole p
trackT– p
Tjetphase space is populated by the best statistics available. No track is used twice even if an event was recorded by more than one trigger. After scaling the spectra of each trigger by the effective luminosity sampled by that trigger, which accounts for different prescales, an unbiased spectrum is obtained.
The measured charge particle spectra are corrected for several effects. The first correction is for secondary and fake tracks. Those are tracks matching to secondary particles
2or they are spurious combinations of hits not associated with a single particle. This correction is estimated as a function of rapidity (y) and p
T. It is around 1% at low p
Tand as much as 7% at high p
Tand high |y|. The second correction is for the p
Tresolution. Iterative Bayesian unfolding [18] is used to correct for possible p
Tmismeasurement. The unfolding introduces a change of about 5% at high p
T, while its e ff ect at low p
Tis much smaller. The third correction is for track reconstruction efficiency, and deals with the fact that some generated particles do not result in reconstructed tracks. This correction is estimated also as a function of y and p
T. The e ffi ciency is around 85% at low p
Tand mid-rapidity, increasing to 90% at high p
T. E ffi ciencies at higher
|y| are reduced by no more than 15%. Finally, a correction is applied to account for the fact that the pion
2Particles with a lifetime longer than 0.3×10⁻¹⁰s produced in proton–proton interactions or in decays of particles with shorter lifetimes are considered to be primary; this includes strange baryons. All other particles are considered to be secondary.
mass is used for all tracks to calculate the rapidity which gives a bias for other particles (mostly kaons and protons). This correction is determined using MC simulations using the true mass of each particle, and applied as function of y. It is up to 1% at p
T≈ 5 GeV and decreases with increasing p
T.
5 Systematic uncertainties
The systematic uncertainties of the measurement arise from several sources. They are evaluated by vary- ing individual sources and comparing the results to the results of the default analysis.
The uncertainty due to the track selection requirement reflects possible di ff erences in performance of the track reconstruction in data and MC simulations. The requirements mentioned in Sec. 4 were tightened or loosened in both data and MC simulation simultaneously and consistently in the whole analysis pro- cedure. This results in an uncertainty on the cross section of 2% at low p
Tand up to 5% at high p
T. The uncertainty in the particle composition is estimated by comparing the results obtained assuming the original composition of the MC simulations with those where the composition is taken from the ALICE measurement [19]. The di ff erence of at most 1% between the two results is due to di ff erences in the track reconstruction e ffi ciency for di ff erent types of particles.
The uncertainty on the fake and secondary track correction was estimated as 30% of the secondary and fake rate. The impact on the cross section is around 1% for the majority of the p
Trange and around 2%
at the highest p
Tmeasured. The efficiency, secondary and fake rate determinations rely on an accurate matching of the reconstructed tracks to generated particles. There are sometimes ambiguities in this matching procedure, and as a result of this an uncertainty of up to 2% on the cross section is taken.
The uncertainty on the unfolding procedure has been estimated by introducing statistical fluctuations to the migration matrices and comparing the resulting spectra to those obtained with the default migration matrices. This uncertainty is below 4% at high p
T. To check the e ff ects of the p
Tresolution, the measured p
Tof tracks in the simulation has been changed by the uncertainty on the sagitta, affecting migration matrices used in the unfolding procedure. The corrected spectra differ by at most 1%.
Additionally, the following sources of systematic uncertainties were also taken into account: the un- certainty of the luminosity determination (5.4%) which changes the overall scaling of the pp yield, the uncertainty associated with possible mis-modeling of the detector material (up to 4%) which affects the track reconstruction e ffi ciency, and the uncertainty on the determination of jet trigger e ffi ciencies (1%) that can also change the overall scaling of the spectra recorded by the jet triggers. The total systematic uncertainty is below 7% for p
T. 20 GeV, however at high p
Tand high |y|, it is as much as 15%. For the uncertainty of the R
pPbit is assumed an unfavorable option that the uncertainties on the numerator and denominator might be anticorrelated, and so the uncertainty of the ratio was estimated as a sum of systematic uncertainties of pp and p +Pb spectra. This yields a conservative estimate of the uncertainty as no cancellations of errors occur with this procedure.
6 Results
The cross section of charged particle production in pp collisions at √
s = 5.02 TeV is presented in Fig. 1.
It is shown together with p +Pb spectra that were taken from Ref. [11]. The p +Pb spectra are scaled by
hT
pPbi using the standard Glauber model [9]. The pp spectra are presented in the same p
Tand y ranges as were the p +Pb results.
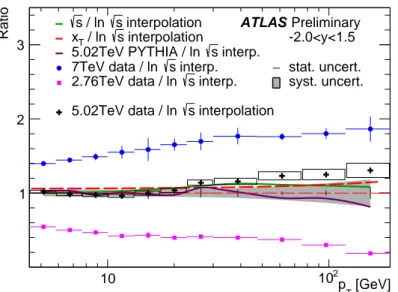
Figure 2 shows a comparison to the interpolated reference, used previously for the comparison of p + Pb data with the pp particle spectra [11]. The interpolation assumed that the particle spectra increase linearly with ln( √
s). Alternative interpolations assumed that it is linear in x
Tor √
s, and lastly an interpolation using PYTHIA was also done. All these are shown in Fig. 2 and they agree to within a few per cent at low p
Tand 20% at high p
T. The data agree well with the interpolations at low p
Tbut at high p
Tthey are about 30% higher than the default interpolation.
Figure 3 shows R
pPbin the 0–90% centrality interval. The p
Tdependence is substantially reduced com- pared to the previous estimate from ATLAS that relied upon interpolation.
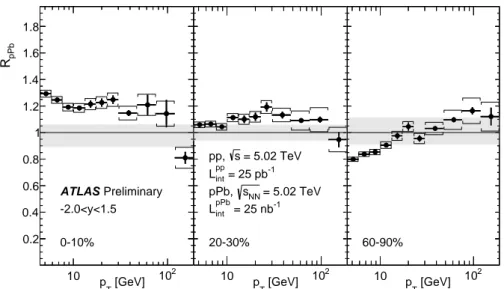
Figure 4 shows R
pPbin three di ff erent centrality intervals. While the central interval 0–10% shows an increase toward lower p
T, the peripheral interval shows a decrease. This low p
Tbehavior is consistent with previous ATLAS measurements [11, 20]. The large statistical uncertainties for the 0–10% centrality interval at high p
Tare due to poor statistics of the low-p
Tjettriggers that have high prescales and thus tracks coming from these few events get large weight. These low-p
Tjettriggers do not contribute to other centrality intervals at all.
[GeV]
pT
10 102
]-2 ) [mb GeV T/(dy dpσ2 ) d Tpπ1/(2
−18
10
−16
10
−14
10
−12
10
−10
10
−8
10
−6
10
−4
10
−2
10 1
pp
pPb〉
〈T pPb/
10-2
× 0-10%
10-4
× 20-30%
10-6
× 60-90%
Preliminary ATLAS
= 5.02 TeV s
pp,
= 25 pb-1 pp
Lint
= 5.02 TeV sNN
pPb,
= 25 nb-1 pPb
Lint
-2.0<y<1.5
Figure 1: Charged particle production cross section measured in ppcollisions at √
s =5.02 TeV. The statistical uncertainties are smaller than the marker size, and the boxes represent systematic uncertainties. Thep+Pb spectra were taken from Ref. [11].
[GeV]
pT
10 102
Ratio
1 2 3
interpolation s
/ ln s
interpolation s
/ ln xT
interp.
s 5.02TeV PYTHIA / ln
interp.
s 7TeV data / ln
interp.
s 2.76TeV data / ln
interpolation s
5.02TeV data / ln
-2.0<y<1.5 stat. uncert.
syst. uncert.
Preliminary ATLAS
Figure 2: Ratios to the interpolatedppreference. The ratios of the 7, 5.02 and 2.76 TeV are represented by circles, crosses and squares, respectively. The boxes around the crosses depict the systematic uncertainty of the presented 5.02 TeV measurement. The green and red lines show ratios of √
sand xT interpolation. The ratio to the cross section obtained from the PYTHIA simulation is shown by the purple line. The gray band and vertical lines around unity represent systematic and statistical uncertainty of the interpolated reference. Additional 10% systematic uncertainty imposed on the interpolation method is not shown.
[GeV]
pT
10 102
pPbR
0.2 0.4 0.6 0.8 1 1.2 1.4 1.6 1.8
Preliminary ATLAS
-2.0<y<1.5
= 5.02 TeV s
pp, = 25 pb-1 pp
Lint
= 5.02 TeV sNN
pPb, = 25 nb-1 pPb
Lint
0-90%
Figure 3: Nuclear modification factorRpPbmeasured in the 0–90% centrality interval. Statistical uncertainties are shown with vertical lines and brackets represent systematic uncertainties, with the exception of the fully correlated systematic uncertainty that is shown with the gray band around unity.
[GeV]
pT
10 102
pPbR
0.2 0.4 0.6 0.8 1 1.2 1.4 1.6 1.8
0-10%
Preliminary ATLAS
-2.0<y<1.5
[GeV]
pT
10 102
pPbR
0.2 0.4 0.6 0.8 1 1.2 1.4 1.6 1.8
20-30%
= 5.02 TeV s
pp, = 25 pb-1 pp
Lint
= 5.02 TeV sNN
pPb, = 25 nb-1 pPb
Lint
[GeV]
pT
10 102
pPbR
0.2 0.4 0.6 0.8 1 1.2 1.4 1.6 1.8
60-90%
Figure 4: Nuclear modification factorRpPbmeasured in three centrality intervals: 0–10%, 20–30% and 60–90%.
Statistical uncertainties are shown with vertical lines and brackets represent the systematic uncertainties, with the exception of the fully correlated systematic uncertainties that are shown with the gray bands around unity.
7 Conclusion
This note presents the measurement of charged particle production in pp collisions at √
s = 5.02 TeV by the ATLAS experiment at the LHC. The pp cross section is compared to the p + Pb data (at the same center-of-mass energy) presented in Ref. [11].
The pp cross section is, in the high-p
Tregion, higher than the interpolated result obtained in Ref. [11].
When using the pp cross section to calculate R
pPbno significant deviation from unity is observed in the centrality interval 0–90% for any transverse momentum.
The centrality dependence of R
pPbis similar to previous results at low p
T[20].
References
[1] M. Arneodo, Nuclear e ff ects in structure functions, Phys. Rept. 240 (1994) 301–393.
[2] C. Salgado, J. Alvarez-Muniz, F. Arleo, N. Armesto, M. Botje, et al., Proton-Nucleus Collisions at the LHC: Scientific Opportunities and Requirements, J. Phys. G39 (2012) 015010,
arXiv:1105.3919.
[3] EMC Collaboration, J. Aubert et al., The ratio of the nucleon structure functions F
N2for iron and deuterium, Phys. Lett. B123 (1983) 275 – 278.
[4] J. L. Albacete and C. Marquet, Single Inclusive Hadron Production at RHIC and the LHC from the
Color Glass Condensate, Phys. Lett. B687 (2010) 174–179, arXiv:1001.1378.
[5] P. Tribedy and R. Venugopalan, QCD saturation at the LHC: comparisons of models to p + p and A + A data and predictions for p + Pb collisions, Phys. Lett. B710 (2012) 125–133,
arXiv:1112.2445.
[6] J. Jalilian-Marian and A. H. Rezaeian, Hadron production in pA collisions at the LHC from the Color Glass Condensate, Phys. Rev. D85 (2012) 014017, arXiv:1110.2810.
[7] J. L. Albacete, A. Dumitru, H. Fujii, and Y. Nara, CGC predictions for p + Pb collisions at the LHC, Nucl. Phys. A897 (2013) 1–27, arXiv:1209.2001.
[8] J. Albacete et al., Predictions for p + Pb Collisions at √
s
NN= 5 TeV, Int. J. Mod. Phys. E22 (2013) 1330007, arXiv:1301.3395.
[9] B. Alver, M. Baker, C. Loizides, and P. Steinberg, The PHOBOS Glauber Monte Carlo, arXiv:0805.4411.
[10] CMS Collaboration, Nuclear E ff ects on the Transverse Momentum Spectra of Charged Particles in pPb Collisions at √
s
NN= 5.02 TeV, Eur. Phys. J. C75 (2015) 237, arXiv:1502.05387.
[11] ATLAS Collaboration, Charged hadron production in p + Pb collisions at √
s
NN= 5.02 TeV measured at high transverse momentum by the ATLAS experiment,
http://cds.cern.ch/record/1704978.
[12] ALICE Collaboration, J. Adam et al., Centrality dependence of the nuclear modification factor of charged pions, kaons, and protons in Pb-Pb collisions at √
s
NN= 2.76 TeV, Phys. Rev. C93 (2016) 034913, arXiv:1506.07287.
[13] ATLAS Collaboration, The ATLAS Experiment at the CERN Large Hadron Collider, JINST 3 (2008) S08003.
[14] M. Cacciari, G. P. Salam, and G. Soyez, The Anti-k(t) jet clustering algorithm, JHEP 0804 (2008) 063, arXiv:0802.1189.
[15] T. Sjöstrand et al., An introduction to PYTHIA 8.2, Computer Physics Communications 191 (2015) 159 – 177.
[16] S. Agostinelli et al., GEANT4: A simulation toolkit, Nucl. Instrum. Meth. A506 (2003) 250–303.
[17] ATLAS Collaboration, The ATLAS Simulation Infrastructure, Eur. Phys. J. C70 (2010) 823–874, arXiv:1005.4568.
[18] G. D’Agostini, A multidimensional unfolding method based on Bayes’ theorem, Nucl. Instrum.
Meth. A 362 (1995) 487.
[19] ALICE Collaboration, J. Adam et al., Multiplicity dependence of charged pion, kaon, and (anti)proton production at large transverse momentum in p-Pb collisions at √
s
NN= 5.02 TeV, Phys. Lett. B760 (2016) 720–735, arXiv:1601.03658.
[20] ATLAS Collaboration, Transverse momentum, rapidity, and centrality dependence of inclusive charged-particle production in √
s
NN= 5.02 TeV p + Pb collisions measured by the ATLAS
experiment, arXiv:1605.06436.
Appendix
[GeV]
pT
10 102
pPbR
0.2 0.4 0.6 0.8 1 1.2 1.4 1.6 1.8
ATLAS, interpolated reference ATLAS, this analysis
Preliminary ATLAS
-2.0<y<1.5
= 5.02 TeV s
pp, = 25 pb-1 pp
Lint
= 5.02 TeV sNN
pPb, = 25 nb-1 pPb
Lint
0-90%
Figure 5: Nuclear modification factorRpPbmeasured in the 0–90% centrality interval. Statistical uncertainties are shown with vertical lines and brackets represent systematic uncertainties, with an exception of the fully correlated systematic uncertainty that is shown with the gray band around unity. The result of this analysis is compared to that of the previous analysis [11] with used an interpolation method for deriving the ppspectra at √
s=5.02 TeV.
[GeV]
pT
1 10 102
pPbR
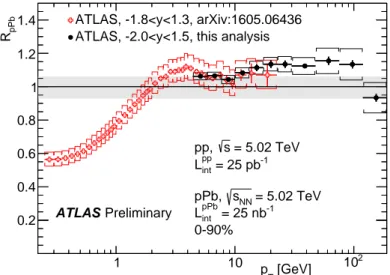
0.2 0.4 0.6 0.8 1 1.2
1.4 ATLAS, -1.8<y<1.3, arXiv:1605.06436 ATLAS, -2.0<y<1.5, this analysis
Preliminary ATLAS
= 5.02 TeV s
pp, = 25 pb-1 pp
Lint
= 5.02 TeV sNN
pPb, = 25 nb-1 pPb
Lint
0-90%
Figure 6: Nuclear modification factorRpPbmeasured in the 0–90% centrality interval. Statistical uncertainties are shown with vertical lines and brackets represent systematic uncertainties, with an exception of the fully correlated systematic uncertainty that is shown with the gray band around unity. The result of this analysis is compared to that of the previous analysis [20] with used an interpolation method for deriving the ppspectra at √
s=5.02 TeV.
[GeV]
pT
10 102
pPbR
0.2 0.4 0.6 0.8 1 1.2 1.4 1.6 1.8
0-10%
Preliminary ATLAS
-2.0<y<1.5
[GeV]
pT
10 102
pPbR
0.2 0.4 0.6 0.8 1 1.2 1.4 1.6 1.8
20-30%
= 5.02 TeV s
pp, = 25 pb-1 pp
Lint
= 5.02 TeV sNN
pPb, = 25 nb-1 pPb
Lint
[GeV]
pT
10 102
pPbR
0.2 0.4 0.6 0.8 1 1.2 1.4 1.6 1.8
60-90%
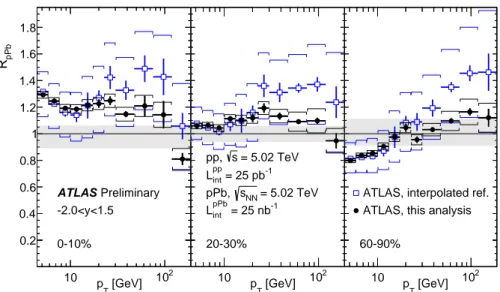
ATLAS, interpolated ref.
ATLAS, this analysis
Figure 7: Nuclear modification factorRpPb measured in three centrality intervals 0–10%, 20–30% and 60–90%.
Statistical uncertainties are shown with vertical lines and brackets represent systematic uncertainties, with an ex- ception of the fully correlated systematic uncertainties that are shown with the gray bands around unity. The result of this analysis is compared to that of the previous analysis [11] with used an interpolation method for deriving the ppspectra at √
s=5.02 TeV.
[GeV]
pT
1 10 102
pPbR
0.2 0.4 0.6 0.8 1 1.2 1.4 1.6
ATLAS, arXiv:1605.06436 5-10%, -1.8<y<1.3 ATLAS, this analysis 0-10%, -2.0<y<1.5
[GeV]
pT
1 10 102
pPbR
0.2 0.4 0.6 0.8 1 1.2 1.4 1.6
ATLAS, arXiv:1605.06436 20-30%, -1.8<y<1.3 ATLAS, this analysis 20-30%, -2.0<y<1.5
Preliminary ATLAS
[GeV]
pT
1 10 102
pPbR
0.2 0.4 0.6 0.8 1 1.2 1.4 1.6
ATLAS, arXiv:1605.06436 60-90%, -1.8<y<1.3 ATLAS, this analysis 60-90%, -2.0<y<1.5
= 5.02 TeV s
pp, = 25 pb-1 pp
Lint
= 5.02 TeV sNN
pPb, = 25 nb-1 pPb
Lint
Figure 8: Nuclear modification factorRpPb measured in three centrality intervals 0–10%, 20–30% and 60–90%.
Statistical uncertainties are shown with vertical lines and brackets represent systematic uncertainties, with an ex- ception of the fully correlated systematic uncertainties that are shown with the gray bands around unity. The result of this analysis is compared to that of the previous analysis [20] with used an interpolation method for deriving the ppspectra at √
s=5.02 TeV.
![Figure 2 shows a comparison to the interpolated reference, used previously for the comparison of p + Pb data with the pp particle spectra [11]](https://thumb-eu.123doks.com/thumbv2/1library_info/4007088.1540948/6.892.305.609.535.922/figure-comparison-interpolated-reference-previously-comparison-particle-spectra.webp)