ATLAS-CONF-2014-028 28/07/2014ATLAS-CONF-2014-028 21May2014
ATLAS NOTE
ATLAS-CONF-2014-028
May 20, 2014
Measurement of the production of neighbouring jets in lead-lead collisions at √
s
NN= 2.76 TeV with the ATLAS detector
The ATLAS Collaboration
Abstract
This note presents the measurement of correlated production of nearby jets in Pb+Pb col- lisions at
√sNN=
2.76 TeV using the ATLAS detector at the Large Hadron Collider (LHC).
The measurement was performed using 0.14 nb
−1of data recorded in 2011. The jets were measured in the ATLAS calorimeter and were reconstructed using the anti-k
talgorithm with radius parameters
d=0.2,
d=0.3, and
d=0.4. The production of correlated jet pairs was quantified using the rate
R∆Rof “neighbouring” jets within a restricted transverse momen- tum interval that accompany “test” jets within a given range of angular distance,
∆R, in thepseudorapidity-azimuthal angle plane.
R∆Rwas measured as a function of Pb+Pb collision centrality, characterized by the total transverse energy measured in the forward calorimeters.
A centrality dependence of
R∆Ris observed for jet radii between
d=0.2 and
d=0.4 with
R∆Rlower in central collisions. The ratio of the
R∆Rvalues between collisions of different centrality and the values in the 40
−80% centrality bin is evaluated and presented.
c
Copyright 2014 CERN for the benefit of the ATLAS Collaboration.
Reproduction of this article or parts of it is allowed as specified in the CC-BY-3.0 license.
1 Introduction
Experimental studies of jet production in Pb
+Pb collisions at the LHC can directly reveal the properties of the quark gluon plasma created in the collisions through the mechanism of “jet quenching”. That term generically refers to the modification of parton showers initiated by hard scattering processes which take place in the quark gluon plasma. Measurements of dijet pairs at the LHC provided the first direct evidence of jet quenching resulting in the enhanced transverse momentum imbalance of dijets observed in central Pb+Pb collisions [1, 2]. Measurements at the LHC of inclusive jet suppression [3] and the variation of the suppression with jet azimuthal angle with respect to the elliptic flow plane [4] have shown that the energies of jets are significantly degraded and that the energy loss depends on the path length of the parton shower in the plasma. The dijet and single jet measurements provide complementary information about the jet quenching process. The single jet measurements are sensitive to the average energy loss while the dijet measurements probe di
fferences in the quenching between the two parton showers traversing the medium. Those differences can arise from the unequal path lengths of the two showers in the medium or from fluctuations in the energy loss process itself.
To help disentangle the contributions of these factors to the observed dijet asymmetries the mea- surement of the correlations between jets that are at small relative angles was performed. Neighbouring jet pairs include jets originating from the same hard interaction, but also jets from di
fferent hard inter- actions. The latter are not of interest in this analysis, and are subtracted statistically. The remaining neighbouring jet pairs result primarily from hard radiation in the parton shower that occurs early in the shower. Generally, two jets originating from the same hard scattering and propagating in approximately the same direction should have similar path lengths in the medium. Therefore measuring neighbouring jets can probe differences in the quenching of the two jets that do not result from difference in path length.
In principle, measurements of the correlated production of jets in the same parton shower may provide more detailed insight on the modification of the parton shower in the quark gluon plasma beyond the subsequent quenching of the resulting jets.
This note presents measurements of the production of neighbouring jets in Pb+Pb collisions at
√sNN =
2.76 TeV using 0.14 nb
−1of data recorded by the ATLAS experiment in 2011. Jets used in the measurements were reconstructed with the anti-k
t[5] algorithm using distance parameter values
d=0.2,
d=0.3, and
d=0.4. In events with high
ET“test” jet, further jets are searched for within a certain distance from the test jet. The distance in the pseudorapidity-azimuth (η-φ) plane
1is defined as
∆R= p
∆η2+ ∆φ2
. The rate of the neighbouring jets that accompany a test jet,
R∆R, is defined as
R∆R =
1 dN
jettest/dEtestTNjettest X
i=1
dN
jet,inbrdE
testT(E
testT ,EnbrT,min,∆R),(1) where
EtestTand
EnbrTare the transverse energies of the test and neighbouring jet, respectively;
Njettestis the number of test jets in a given
ETtestbin and
Njetnbris number of neighbouring jets. For each choice of
d, neighbouring jets are considered if they lie within a specific annulus in∆Raway from the test jet:
0.5
<∆R<1.6, 0.6
<∆R<1.6, and 0.8
<∆R<1.6 for
d=0.2,
d=0.3, and
d =0.4 jets, respectively.
The lower limit on
∆Ris chosen so as to avoid that the test and neighbouring jets overlap, the upper limit to limit the acceptance to jets which are not too far from the test jet.
The
R∆Rmeasurement is performed di
fferentially in collision centrality, transverse energy of the test jet,
EtestT, and transverse energy of the neighbouring jet,
EnbrT. The bins in
EtestTcover five intervals in
ET:
1ATLAS uses a right-handed coordinate system with its origin at the nominal interaction point (IP) in the centre of the detector and thez-axis along the beam pipe. Thex-axis points from the IP to the centre of the LHC ring, and theyaxis points upward. Cylindrical coordinates (r, φ) are used in the transverse plane,φbeing the azimuthal angle around the beam pipe. The pseudorapidity is defined in terms of the polar angleθasη=−ln tan(θ/2).
70–80, 80–90, 90–110, 110–140, and 140–300 GeV. The bins in
EnbrTcover four intervals in
ET: 30–45, 45–60, 60–80, and 80–130 GeV. Other configurations have also been examined where all the bins in
EtestThave the same upper bound of 300 GeV or all the bins in
ETnbrhave the same upper bound of 300 GeV.
The raw
R∆Rdistributions are corrected for a contribution from neighbouring jets that originate from di
fferent hard partonic interaction in the same Pb
+Pb collision. This combinatorial background repre- sents a substantial contribution to the measured rates of neighbouring jets at
EnbrT <45 GeV where the signal-to-background ratio can be as low as 0.15.
To quantify a possible centrality dependence of the neighbouring jet yields, the ratio
ρR∆Ris calculated from
R∆Rmeasured in each centrality bin excluding the peripheral bin to
R∆Rmeasured in the 40–80%, peripheral, bin.
Previous measurements of the correlated production of neighbouring jets were performed by the D∅
experiment in
p- ¯pcollisions at the Tevatron [6]. The measurements by D
∅were intended to measure the strong coupling constant,
αs, and to test its running over a large range of momentum transfers.
The measurements presented in this note use similar techniques and follow notations introduced in that measurement.
2 Experimental setup
The measurements presented in this note are based on data taken using the ATLAS detector [7]. The ATLAS calorimeter system consists of a liquid argon (LAr) electromagnetic (EM) calorimeter covering
|η|<
3.2, a steel-scintillator sampling hadronic calorimeter covering
|η|<1.7, a LAr hadronic calorimeter covering 1.5
< |η| <3.2, and two LAr forward calorimeters (FCal) covering 3.2
< |η| <4.9. The hadronic calorimeter has three longitudinal sampling layers and has a
∆η×∆φgranularity of 0.1
×0.1 for
|η|<
2.5 and 0.2
×0.2 for 2.5
<|η|<4.9
2. The EM calorimeters are longitudinally segmented into three compartments with an additional pre-sampler layer. The inner detector [8] measures charged particles within the pseudorapidity interval
|η|<2.5. The inner detector is composed of silicon pixel detectors in the innermost layers, followed by silicon microstrip detectors and a straw-tube tracker, all immersed in a 2 T axial magnetic field provided by a solenoid.
Minimum-bias Pb+Pb collisions were identified using triggers based on the zero-degree calorimeters (ZDC) and the minimum-bias trigger scintillator (MBTS) counters [7]. The ZDCs are located symmet- rically at
z= ±140 m and cover|η|>8.3. In Pb
+Pb collisions the ZDCs measure primarily “spectator”
neutrons, which originate from the incident nuclei and do not interact hadronically. The MBTS detects charged particles over 2.1
< |η| <3.9 using two counters placed at
z =±3.6 m. Each counter is dividedinto 16 sections, each of which provides measurements of both the pulse heights and arrival times of ionization energy deposits.
Events with high-p
Tjets were selected using High Level Trigger (HLT) triggering on jets which is seeded by a minimum bias L1 trigger. The Level-1 trigger required a total transverse energy measured in the calorimeter of greater than 10 GeV. The HLT jet trigger ran the offline Pb+Pb jet reconstruction, described below, for
d =0.2 jets, except for the application of the final hadronic energy scale correction.
The HLT trigger selected events containing a
d=0.2 jet with transverse energy,
ET >20 GeV.
3 Event selection and data sets
This analysis uses data from Pb
+Pb collisions recorded by ATLAS in 2011. A total integrated luminosity of 0.14 nb
−1is used for events triggered by the HLT, a total luminosity of 7
µb−1is used for events triggered by the minimum-bias trigger. Events selected by the HLT jet trigger were required to have
2An exception is the third sampling layer that has a segmentation of 0.2×0.1 up to|η|=1.4.
a reconstructed primary vertex and a difference between arrival time of pulses from the two sides of the MBTS detector measured in the central trigger processor of less than 7 ns. Events selected by the minimum-bias trigger were required to fulfill the same selection criteria. A total of 14.2 million and 39 million events passing the described selections from the jet-triggered sample and minimum-bias sample, respectively, were used in the analysis.
The centrality of Pb+Pb collisions was characterized by
ΣEFCalT, the total transverse energy measured in the FCal [9]. The neighbouring jet production was measured in four centrality bins defined according to successive percentiles of the
ΣETFCaldistribution ordered from the most central to the most peripheral collisions: 0–10%, 10–20%, 20–40%, and 40–80%. The percentiles were defined after correcting the
ΣEFCalTdistribution for a 2% minimum-bias trigger inefficiency that affects the most peripheral events, which are not included in this analysis.
The performance of the ATLAS detector and offline analysis in measuring jets in the environment of Pb+Pb collisions was evaluated using a high-statistics Monte Carlo (MC) sample obtained by overlay- ing simulated [10] PYTHIA [11] hard-scattering events onto randomly selected minimum-bias Pb
+Pb events, taken from a sample of 1.2 million events recorded in 2011. PYTHIA version 6.423 with the AUET2B tune [12] is used. Three million PYTHIA events were produced for each of five intervals of the transverse momentum of outgoing partons in the 2
→2 hard-scattering process, with boundaries 17, 35, 70, 140, 280, and 560 GeV. The detector response to the PYTHIA events was simulated using GEANT4 [13], and the simulated hits were combined with the data from the minimum-bias Pb+Pb events before performing the reconstruction algorithm.
4 Jet reconstruction and selection
Jets were reconstructed over the pseudorapidity interval of
|η| <2.8. The jet reconstruction techniques described in Ref. [3] were employed, which are briefly summarized here. The anti-k
talgorithm was first run in four-vector recombination mode, on
∆η×∆φ=0.1
×0.1 logical towers and for three values of the anti-k
tdistance parameter,
d=0.2,
d=0.3, and
d=0.4. For the remainder of this note the term “radius”
will refer to the distance parameter,
d. The tower kinematics were obtained by summing EM-scaleenergies of calorimeter cells within the tower boundaries. Then, an iterative procedure was used to estimate a layer and
η-dependent underlying event (UE) energy density while excluding actual jets fromthat estimate. The UE energy was subtracted from each calorimeter cell within the towers included in the reconstructed jet. The subtraction accounts for a cos 2φ modulation in the UE energy density due to collective flow [9] of the medium using a measurement of the amplitude and phase of that modulation in the calorimeter. The final jet kinematics were calculated via a four-vector sum of all (assumed massless) cells contained within the jets using
ETvalues after the UE subtraction. A correction was applied to the reconstructed jet to account for jets not excluded or only partially excluded from the UE estimate.
This correction has a magnitude of few percent. Then, a final
ηand jet
ET-dependent hadronic energy scale calibration factor was applied [3]. After the reconstruction, additional selections were applied for the purpose of this analysis. “UE jets” generated by fluctuations in the underlying event, were removed using the techniques described in [3]. The choice of the maximum
∆Rof 1.6 restricts the pseudorapidity range of test jets to
|η| <1.2 yielding in total 87 100
d=0.4 test jets with
pT >80 GeV analyzed in 0–10% central events and 37 300 test jets in 40–80% peripheral events.
In the MC sample, the kinematics of the reference PYTHIA generator-level jets (hereafter called
“truth jets”) were reconstructed from PYTHIA final-state particles with the anti-k
talgorithm with radius
d=0.2, 0.3, and 0.4 using the same techniques as applied in
ppanalyses [14].
[GeV]
nbr T, truth
E
40 60 80 100 120
Efficiency
0.5 0.6 0.7 0.8 0.9 1 1.1
1.2 ATLAS simulation Preliminary
= 2.76 TeV sNN
Pb+Pb MC
d=0.4 kT
anti-
<1.6
∆R 0.8<
>90 GeV
test
ET
0-10%
10-20%
20-40%
40-80%
[GeV]
nbr
ET
40 60 80 100 120
Correction factor
0.6 0.8 1 1.2 1.4 1.6 1.8 2 2.2
2.4 ATLAS simulation Preliminary
d=0.4 kT
anti-
<1.6
∆R 0.8<
>90 GeV
test
ET
[GeV]
nbr T, truth
E
40 60 80 100 120
Efficiency
0.5 0.6 0.7 0.8 0.9 1 1.1
1.2 ATLAS simulation Preliminary
= 2.76 TeV sNN
Pb+Pb MC
d=0.2 kT
anti-
<1.6
∆R 0.5<
>90 GeV
test
ET
0-10%
10-20%
20-40%
40-80%
[GeV]
nbr
ET
40 60 80 100 120
Correction factor
0.6 0.8 1 1.2 1.4 1.6 1.8 2 2.2
2.4 ATLAS simulation Preliminary
d=0.2 kT
anti-
<1.6
∆R 0.5<
>90 GeV
test
ET
Figure 1: Reconstruction efficiency (left) of neighbouring jets as a function of neighbouring jet truth
ETand bin-by-bin correction factors for
R∆Rdistributions (right) as a function of reconstructed neighbouring jet
ETfor two di
fferent jet radii,
d=0.4 (upper plots) and
d=0.2 (lower plots). The four di
fferent centrality bins are denoted by different markers in each plot. The vertical errors represent statistical uncertainties.
5 Neighbouring jet rates and corrections
The raw neighbouring jet rates are affected by an uninteresting contribution from neighbouring jets that originate from di
fferent hard partonic interaction in the same Pb
+Pb collision. This combinatorial back- ground is present both in the MC sample and in the data. It contributes most significantly in low
EnbrTbins and increases with increasing centrality of the collision, since the probability for the presence of two independent hard scatterings in one Pb
+Pb collision is expected to increase with the number of binary collisions,
Ncoll. The combinatorial background is estimated using the di
fferential yield of inclusive jets
(d
3Njet/dηdφdET) evaluated in minimum-bias Pb+Pb events. This estimated background needs to be
corrected for a geometrical bias present in the case when the combinatorial jet overlaps with the real neighbouring jet or when two combinatorial jets overlap. These biases are removed by applying multi- plicative correction factors to background distributions prior to the subtraction. This multiplicative factor was derived from reconstruction e
fficiency of two neighbouring jets evaluated as a function of their an- gular separation in the annulus. In that evaluation, one jet was required to originate from PYTHIA hard scattering and the other jet was required to originate from the minimum-bias data in the overlay. The magnitude of the resulting correction is smaller than 0.5% of the magnitude of final subtracted distribu- tion.
Further, events containing jets in the data have a centrality distribution different from that in the
MB samples. To get the correct combinatorial contribution for the data each event in the MB Pb
+Pb
sample was reweighted by a centrality dependent factor. The background is subtracted from raw
R∆Rdistributions both in the data and in the MC sample allowing an evaluation of the performance of the subtraction. The signal-to-background ratio strongly depends on centrality of the collision and
ETnbr. In the most extreme case of 0–10% central collisions and in the region 30
< EnbrT <45 GeV, the signal- to-background ratio can be as low as 0.15. For neighbouring jets in the range of 60
< EnbrT <80 GeV reconstructed in 0–10% central collisions, the signal-to-background ratio is approximately 0.8.
The raw subtracted
R∆Rdistributions are affected by the finite jet energy resolution (JER), jet re- construction e
fficiency, and jet position resolution. To correct for these e
ffects PYTHIA truth jets were matched to the closest reconstructed jet of the same jet radius within
∆R=0.2. The combination of the finite JER and the steeply falling
ETspectrum produces a net migration of jets from lower
ETto higher
ETvalues such that a jet reconstructed with a given
ErecTwill correspond, on average, to a lower truth jet
ET,
hEtruthT i. The relationship between
hETtruthiand
ErecThas been evaluated from the MC events for the different centrality bins and three jet radii used in the analysis. The extracted relationships have been used to correct for the average shift in the test jet energy. No correction due to the jet reconstruction e
fficiency for the test jets is needed since the analysis operates in the transverse energy region where the jet reconstruction is fully efficient. No correction due to jet trigger efficiency is needed either since the plateau of the jet trigger e
fficiency is reached for all test jets except for
d=0.4 jets with
ETtest<90 GeV in the 0–10% and 10–20% centrality bins. In the region 70
< ET <90 GeV, the jet trigger e
fficiency is
>85%. The effect of not reaching the plateau is covered by the systematic uncertainty discussed in Sec. 6.
The impact of the finite JER, reconstruction e
fficiency and position resolution on neighbouring jets is corrected for by applying bin-by-bin correction factors in transverse energy to the raw
R∆Rdistributions.
The bin-by-bin correction factors are derived from the MC data set where the reconstructed jets were matched to the truth jets for three di
fferent configurations with respect to the impact of finite jet position resolution: 1) both the reconstructed and truth jet are found within the same annulus; 2) the truth jet is found within the given annulus, but the reconstructed jet falls outside of the annulus; 3) the reconstructed jet is found within the given annulus but the truth jet falls outside the annulus. It was found that the correction factors derived using the last two cases differ by less then 1% which implies that the impact of the finite jet position resolution on the migration into and out of the annulus approximately cancel and one set of the correction factors can be used.
Example bin-by-bin correction factors and jet reconstruction efficiencies for neighbouring jets are shown in Fig. 1 for different centrality selections and for two choices of jet radii,
d=0.4 and
d=0.2.
The JER in central (0–10%) collisions for
d=0.4 jets has comparable contributions from UE fluctu- ations and “intrinsic” resolution of the calorimetric jet measurement. The fluctuations in the UE are approximately two times smaller for
d=0.2 jets than they are for
d=0.4 jets. Thus, the distributions measured using
d=0.2 jets are far less sensitive to the e
ffects of the JER and the resulting bin-by-bin correction factors for those distributions exhibit only a modest centrality dependence. The difference in the jet reconstruction efficiency between the two choices of jet radii is also significant – the efficiency for
d=0.2 jets is already high at 30 GeV, whereas it is still turning on there for
d=0.4 jets
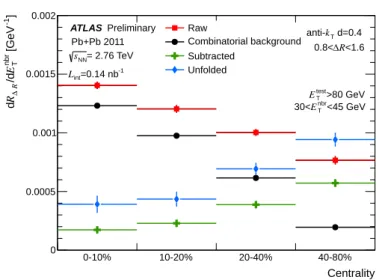
The impact of corrections on
R∆Rdistributions in different centrality bins is shown in Fig.2. The figure shows the impact of corrections for
d=0.4 jets with the lowest thresholds on transverse energy,
EtestT >80 GeV and 30
< ETnbr<45 GeV.
6 Systematic uncertainties
Systematic uncertainties in the measurement of
R∆Rdistributions and their ratios,
ρR∆R, arise due to
the uncertainty on the: jet energy scale (JES), jet energy resolution (JER), angular resolution, bin-by-
bin unfolding, and jet trigger efficiency. The uncertainties on JES, JER and jet angular resolution also
Centrality
0-10% 10-20% 20-40% 40-80%
]-1 [GeVnbr TE/d R ∆Rd
0 0.0005 0.001 0.0015 0.002
ATLAS
=0.14 nb-1
Lint
Preliminary
= 2.76 TeV sNN
Pb+Pb 2011
d=0.4 kT
anti-
<1.6
∆R 0.8<
>80 GeV
test
ET
<45 GeV
nbr
ET
30<
Raw
Combinatorial background Subtracted
Unfolded
Figure 2: Summary of the impact of corrections on
R∆Rdistribution in different centrality bins. The
R∆Ris shown for
d =0.4 jets for
ETtest>80 GeV and in the range 30
<EnbrT <45 GeV. Squares show the raw
R∆Rprior to the UE subtraction, circles show the combinatorial background, crosses show the subtracted
R∆Rprior to unfolding by applying the bin-by-bin correction factors, and diamonds show the unfolded
R∆R. Vertical error bars on the combinatorial background, raw and subtracted distributions represent statistical uncertainties. Vertical error bars on the unfolded distribution represent the combined statistical uncertainty from the unfolding.
influence the bin-by-bin correction factors. The resulting uncertainties on
R∆Rand
ρR∆Rwere evaluated from the changes of
R∆Rand
ρR∆Rwhen systematically varied correction factors are used. To avoid additional statistical fluctuations, the weak
EnbrTdependence of the uncertainty distributions is smoothed by fitting a second order polynomial.
The systematic uncertainty due to the JES has two contributions, an absolute, centrality-independent JES uncertainty and an uncertainty in the variation of the JES from peripheral to central collisions.
The overall centrality-independent uncertainty in the JES is determined from ATLAS in-situ studies of the calorimeter response and systematic variations of the jet response in the MC simulation [14]. The magnitude of the uncertainty on the
R∆Rfrom the absolute JES uncertainty varies from 5% to 12% as a function of
ETand radius of the jet. The evaluation of the centrality-dependent component of JES uncertainty uses estimates based on a comparison of MC simulations with modified jet fragmentation measured by ATLAS [15] and CMS [16]. The MC simulations use the PYQUEN MC generator [17].
The centrality-dependent JES uncertainty reaches 1% for 0–10% central collisions and less than 0.25%
for 40–80% peripheral collisions. The uncertainty on
R∆Roriginating from the centrality-dependent component of the JES uncertainty increases from less than 1% in peripheral collisions to 3% in central collisions.
The effect of the JER uncertainty was evaluated by applying modified bin-by-bin factors where the reconstructed jet
ETwas smeared. The smearing factor is evaluated using an in-situ technique involving studies of dijet energy balance [14]. The systematic uncertainty on
R∆Rdue to the JER varies from 1%
to 4% depending on the jet
ET. The overall centrality-independent JES uncertainty and the uncertainty from JER tend to cancel in the
ρR∆Rratios since both the numerator and denominator in the ratios are affected to a similar degree by the variations accounting for uncertainties.
The systematic uncertainty associated with the bin-by-bin unfolding is connected with the difference
in the spectral shape between the data and the MC sample. Conservatively, the entire change in
R∆Rand
ρR∆Rinduced by the use of reweighted bin-by-bin correction factors is taken as a systematic uncertainty.
[GeV]
nbr
ET
40 50 60 70 80 90 100 110
[%] R ∆Rδ
-10 -5 0 5 10 15 20
JES JERAngular resolution Unfolding Trigger MC non-closure Total
ATLAS Preliminary sNN= 2.76 TeV Pb+Pb 2011
d=0.4 kT
anti-
<1.6
∆R 0.8<
>70 GeV
test
ET
Centrality: 0-10%
[GeV]
nbr
ET
40 50 60 70 80 90 100 110
[%] R∆Rρδ
-10 -5 0 5 10 15 20
JES JER Angular resolution Unfolding Trigger MC non-closure Total
ATLAS Preliminary sNN= 2.76 TeV Pb+Pb 2011
d=0.4 kT
anti-
<1.6
∆R 0.8<
>70 GeV
test
ET
Centrality: 0-10%
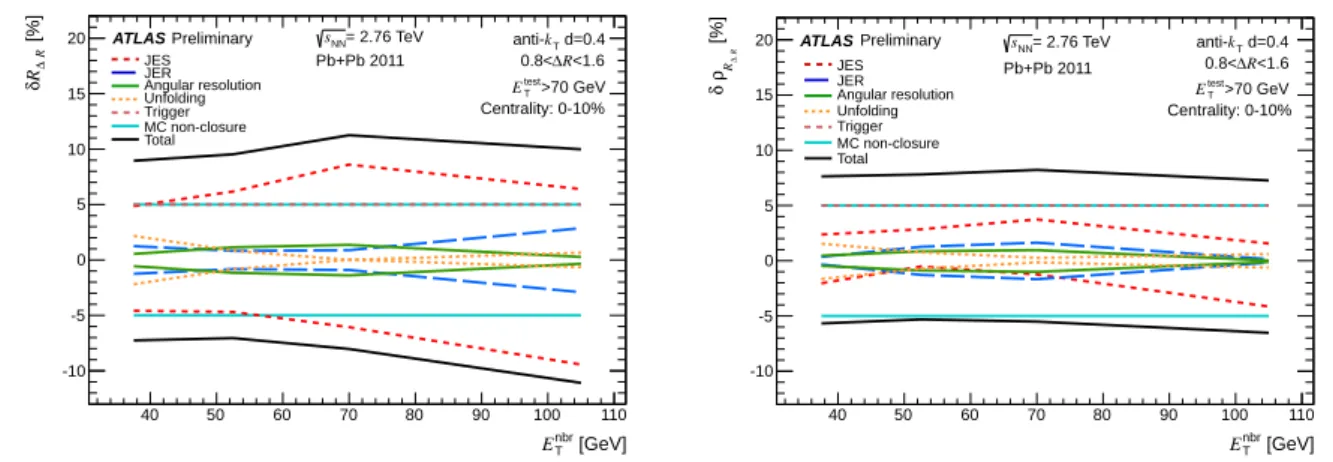
Figure 3: Left: Summary of the systematic uncertainties on the
R∆Rdistributions (δR
∆R). Right: Sum- mary of systematic uncertainties on the
ρR∆Rdistributions (δρ
R∆R). The systematic uncertainties due to jet energy scale (JES), jet energy resolution (JER), jet angular resolution, unfolding, jet trigger efficiency, and MC non-closure are shown for
d=0.4 jets with
EtestT >70 GeV in 0–10% central collisions.
This results typically in 1–2% uncertainty on the
R∆R. A maximal uncertainty of 6% is reached in 0–10%
central collisions for
R∆Revaluated for neighbouring jets with
EnbrT >30 GeV.
The uncertainty associated with the jet angular resolution is estimated using modified bin-by-bin correction factors where the reconstructed jet position in
ηand
φis smeared to reflect a 20% uncertainty on the position resolution estimated in MC studies. The jet position resolution is determined in MC as a standard deviation of the difference in angles between truth and reconstructed jets. It reaches 0.008 in 0–10% collisions and 0.005 in the 40–80% centrality bin for
d=0.4 jets with
ET =30 GeV, both in
ηand
φ. The angular resolution improves with increasing jetETand reaches 0.004 (resolution in
η) and0.002 (resolution in
φ) atET =200 GeV, independently of centrality. The magnitude of uncertainty from the jet angular resolution is smaller than 2%.
The systematic uncertainty on the jet trigger e
fficiency covers for a possible bias caused by selecting test jets in the region where the jet trigger is not fully efficient. This is the case for the
d =0.4 jets with
ETtest <90 GeV reconstructed in the 0–10% and 10–20% centrality bins. For that
ETregion, the systematic uncertainty was determined as a di
fference in the trigger e
fficiency between inclusive jets and jets that were required to have a neighbouring jet. Such difference in trigger efficiency is less than 5%
and is independent of the energy of the neighbouring jet.
An additional test for a presence of other potential systematic uncertainties due to all aspects of the analysis was obtained by evaluating the deviation from unity of the MC truth to reconstructed fully corrected distributions. The systematic uncertainty for
R∆Rand
ρR∆Rdue to this “MC non-closure” varies from 0% to 5%. Thus, a conservative estimate of 5% uncertainty was assigned to all the distributions.
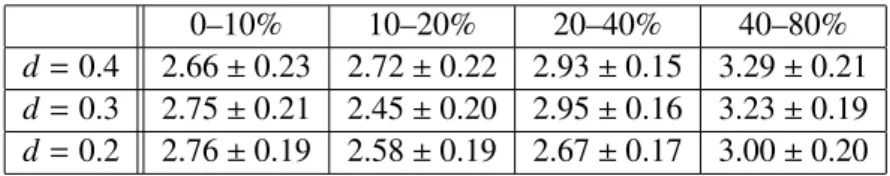
Systematic uncertainties on
R∆Rand
ρR∆Rare summarized in Fig. 3 for
d=0.4 jets reconstructed in 0–10% central collisions and in Table 1 for
d=0.4 jets reconstructed in two different centrality bins. The table shows the maximal uncertainties for
d=0.4 jets. Systematic uncertainties for jets with the other two jet radii are smaller than those shown in the table.
7 Results
The
R∆Rmeasurement is performed di
fferentially in collision centrality, transverse energy of the test jet,
EtestT, and transverse energy of the neighbouring jet,
ETnbr. The measured distributions are divided into
four centrality bins, 0–10%, 10–20%, 20–40%, and 40–80%. The bins in
ETtestcover five intervals in
ET:
δR∆R δρR∆R
0–10% 40–80% 0–10%
JES 12% 6% 5 %
JER 4% 2% 2%
Angular
2% 0.5% 2%
resolution
Unfolding 6% 2% 5%
MC 5% 5% 5%
Trigger 5% – 5%
Table 1: Maximal systematic uncertainties on
R∆R(δR
∆R) and
ρR∆R(δρ
R∆R) for
d =0.4 jets in 0–10% and 40–80% centrality bins. The systematic uncertainty on the trigger is applicable only for
ETtest<90 GeV.
70–80, 80–90, 90–110, 110–140, and 140–300 GeV. The bins in
EnbrTcover four intervals in
ET: 30–45, 45–60, 60–80, and 80–130 GeV. Other configurations have also been examined where all the bins in
EtestThave the same upper bound of 300 GeV or all the bins in
ETnbrhave the same upper bound of 300 GeV. A subset of the distributions corresponding to these di
fferent configurations is presented here.
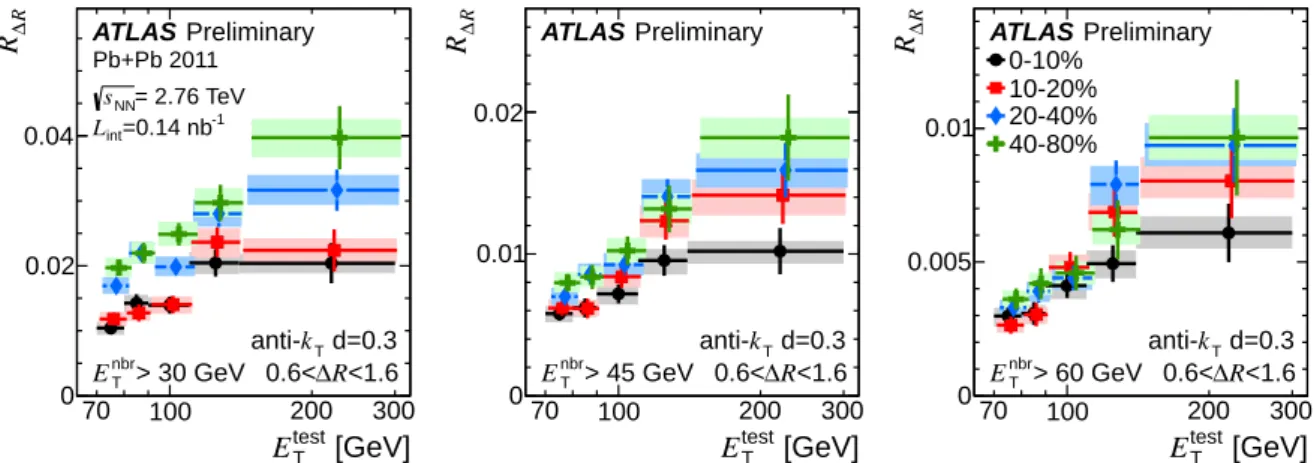
Fig. 4 shows the fully corrected
R∆Rdistributions for
d=0.4 and
d=0.2 jets evaluated as a function of
EtestT. The distributions are shown for four centrality selections and three selections on minimum transverse energy of neighbouring jets,
ETnbr>30, 45, and 60 GeV. The shaded error bands on the plots
ATLAS
=0.14 nb-1
Lint
Preliminary
= 2.76 TeV sNN
Pb+Pb 2011
d=0.4 kT
anti-
<1.6
∆R 0.8<
>80 GeV
test
ET
ATLAS
=0.14 nb-1
Lint
Preliminary
= 2.76 TeV sNN
Pb+Pb 2011
d=0.4 kT
anti-
<1.6
∆R 0.8<
>80 GeV
test
ET
ATLAS
=0.14 nb-1
Lint
Preliminary
= 2.76 TeV sNN
Pb+Pb 2011
d=0.4 kT
anti-
<1.6
∆R 0.8<
>80 GeV
test
ET
ATLAS simulation
=0.14 nb-1
Lint
Preliminary
= 2.76 TeV sNN
Pb+Pb MC
d=0.4 kT
anti-
<1.6
∆R 0.8<
>80 GeV
test
ET
ATLAS simulation
=0.14 nb-1
Lint
Preliminary
= 2.76 TeV sNN
Pb+Pb MC
d=0.4 kT
anti-
<1.6
∆R 0.8<
>80 GeV
test
ET
ATLAS simulation
=0.14 nb-1
Lint
Preliminary
= 2.76 TeV sNN
Pb+Pb MC
d=0.4 kT
anti-
<1.6
∆R 0.8<
>80 GeV
test
ET
ATLAS
=0.14 nb-1
Lint
Preliminary
= 2.76 TeV sNN
Pb+Pb 2011
d=0.4 kT
anti-
<1.6
∆R 0.8<
> 30 GeV
nbr
ET
ATLAS
=0.14 nb-1
Lint
Preliminary
= 2.76 TeV sNN
Pb+Pb 2011
d=0.4 kT
anti-
<1.6
∆R 0.8<
> 30 GeV
nbr
ET
[GeV]
test
ET
70 100 200 300
R∆R
0 0.05
ATLAS
=0.14 nb-1
Lint
Preliminary
= 2.76 TeV sNN
Pb+Pb 2011
d=0.4 kT
anti-
<1.6
∆R 0.8<
> 30 GeV
nbr
ET
ATLAS Preliminary
d=0.4 kT
anti-
<1.6
∆R 0.8<
>90 GeV
test
ET
ATLAS Preliminary
d=0.4 kT
anti-
<1.6
∆R 0.8<
>90 GeV
test
ET
ATLAS Preliminary
d=0.4 kT
anti-
<1.6
∆R 0.8<
>90 GeV
test
ET
ATLAS simulation Preliminary
d=0.4 kT
anti-
<1.6
∆R 0.8<
>90 GeV
test
ET
ATLAS simulation Preliminary
d=0.4 kT
anti-
<1.6
∆R 0.8<
>90 GeV
test
ET
ATLAS simulation Preliminary
d=0.4 kT
anti-
<1.6
∆R 0.8<
>90 GeV
test
ET
ATLAS Preliminary
d=0.4 kT
anti-
<1.6
∆R 0.8<
> 45 GeV
nbr
ET
ATLAS Preliminary
d=0.4 kT
anti-
<1.6
∆R 0.8<
> 45 GeV
nbr
ET
[GeV]
test
ET
70 100 200 300
R∆R
0 0.01 0.02
ATLAS Preliminary
d=0.4 kT
anti-
<1.6
∆R 0.8<
> 45 GeV
nbr
ET
ATLAS Preliminary
d=0.4 kT
anti-
<1.6
∆R 0.8<
>110 GeV
test
ET
ATLAS Preliminary
d=0.4 kT
anti-
<1.6
∆R 0.8<
>110 GeV
test
ET
ATLAS Preliminary
d=0.4 kT
anti-
<1.6
∆R 0.8<
>110 GeV
test
ET
ATLAS simulation Preliminary
d=0.4 kT
anti-
<1.6
∆R 0.8<
>110 GeV
test
ET
ATLAS simulation Preliminary
d=0.4 kT
anti-
<1.6
∆R 0.8<
>110 GeV
test
ET
ATLAS simulation Preliminary
d=0.4 kT
anti-
<1.6
∆R 0.8<
>110 GeV
test
ET
ATLAS Preliminary
d=0.4 kT
anti-
<1.6
∆R 0.8<
0-10%
10-20%
20-40%
40-80%
> 60 GeV
nbr
ET
ATLAS Preliminary
d=0.4 kT
anti-
<1.6
∆R 0.8<
0-10%
10-20%
20-40%
40-80%
> 60 GeV
nbr
ET
[GeV]
test
ET
70 100 200 300
R∆R
0 0.005 0.01
ATLAS Preliminary
d=0.4 kT
anti-
<1.6
∆R 0.8<
0-10%
10-20%
20-40%
40-80%
> 60 GeV
nbr
ET
ATLAS
=0.14 nb-1
Lint
Preliminary
= 2.76 TeV sNN
Pb+Pb 2011
d=0.2 kT
anti-
<1.6
∆R 0.5<
>80 GeV
test
ET
ATLAS
=0.14 nb-1
Lint
Preliminary
= 2.76 TeV sNN
Pb+Pb 2011
d=0.2 kT
anti-
<1.6
∆R 0.5<
>80 GeV
test
ET
ATLAS
=0.14 nb-1
Lint
Preliminary
= 2.76 TeV sNN
Pb+Pb 2011
d=0.2 kT
anti-
<1.6
∆R 0.5<
>80 GeV
test
ET
ATLAS simulation
=0.14 nb-1
Lint
Preliminary
= 2.76 TeV sNN
Pb+Pb MC
d=0.2 kT
anti-
<1.6
∆R 0.5<
>80 GeV
test
ET
ATLAS simulation
=0.14 nb-1
Lint
Preliminary
= 2.76 TeV sNN
Pb+Pb MC
d=0.2 kT
anti-
<1.6
∆R 0.5<
>80 GeV
test
ET
ATLAS simulation
=0.14 nb-1
Lint
Preliminary
= 2.76 TeV sNN
Pb+Pb MC
d=0.2 kT
anti-
<1.6
∆R 0.5<
>80 GeV
test
ET
ATLAS
=0.14 nb-1
Lint
Preliminary
= 2.76 TeV sNN
Pb+Pb 2011
d=0.2 kT
anti-
<1.6
∆R 0.5<
> 30 GeV
nbr
ET
ATLAS
=0.14 nb-1
Lint
Preliminary
= 2.76 TeV sNN
Pb+Pb 2011
d=0.2 kT
anti-
<1.6
∆R 0.5<
> 30 GeV
nbr
ET
[GeV]
test
ET
70 100 200 300
R∆R
0 0.02 0.04
ATLAS
=0.14 nb-1
Lint
Preliminary
= 2.76 TeV sNN
Pb+Pb 2011
d=0.2 kT
anti-
<1.6
∆R 0.5<
> 30 GeV
nbr
ET
ATLAS Preliminary
d=0.2 kT
anti-
<1.6
∆R 0.5<
>90 GeV
test
ET
ATLAS Preliminary
d=0.2 kT
anti-
<1.6
∆R 0.5<
>90 GeV
test
ET
ATLAS Preliminary
d=0.2 kT
anti-
<1.6
∆R 0.5<
>90 GeV
test
ET
ATLAS simulation Preliminary
d=0.2 kT
anti-
<1.6
∆R 0.5<
>90 GeV
test
ET
ATLAS simulation Preliminary
d=0.2 kT
anti-
<1.6
∆R 0.5<
>90 GeV
test
ET
ATLAS simulation Preliminary
d=0.2 kT
anti-
<1.6
∆R 0.5<
>90 GeV
test
ET
ATLAS Preliminary
d=0.2 kT
anti-
<1.6
∆R 0.5<
> 45 GeV
nbr
ET
ATLAS Preliminary
d=0.2 kT
anti-
<1.6
∆R 0.5<
> 45 GeV
nbr
ET
[GeV]
test
ET
70 100 200 300
R∆R
0 0.01 0.02
ATLAS Preliminary
d=0.2 kT
anti-
<1.6
∆R 0.5<
> 45 GeV
nbr
ET
ATLAS Preliminary
d=0.2 kT
anti-
<1.6
∆R 0.5<
>110 GeV
test
ET
ATLAS Preliminary
d=0.2 kT
anti-
<1.6
∆R 0.5<
>110 GeV
test
ET
ATLAS Preliminary
d=0.2 kT
anti-
<1.6
∆R 0.5<
>110 GeV
test
ET
ATLAS simulation Preliminary
d=0.2 kT
anti-
<1.6
∆R 0.5<
>110 GeV
test
ET
ATLAS simulation Preliminary
d=0.2 kT
anti-
<1.6
∆R 0.5<
>110 GeV
test
ET
ATLAS simulation Preliminary
d=0.2 kT
anti-
<1.6
∆R 0.5<
>110 GeV
test
ET
ATLAS Preliminary
d=0.2 kT
anti-
<1.6
∆R 0.5<
0-10%
10-20%
20-40%
40-80%
> 60 GeV
nbr
ET
ATLAS Preliminary
d=0.2 kT
anti-
<1.6
∆R 0.5<
0-10%
10-20%
20-40%
40-80%
> 60 GeV
nbr
ET
[GeV]
test
ET
70 100 200 300
R∆R
0 0.01
ATLAS Preliminary
d=0.2 kT
anti-
<1.6
∆R 0.5<
0-10%
10-20%
20-40%
40-80%
> 60 GeV
nbr
ET