ATLAS-CONF-2012-050 26May2012
ATLAS NOTE
ATLAS-CONF-2012-050
May 26, 2012
Measurement of the centrality dependence of open heavy flavour production in lead-lead collisions at √
s = 2.76 TeV with the ATLAS detector
The ATLAS Collaboration
Abstract
Measurements of heavy quark production and suppression in ultra-relativistic nuclear collisions probe the interactions of heavy quarks with the hot, dense medium created in the collisions. ATLAS has measured heavy quark production in
√s =
2.76 TeV Pb
+Pb colli- sions via semi-leptonic decays of open heavy flavour hadrons to muons. Results obtained from an integrated luminosity of approximately 7
µb−1collected in 2010 are presented for the per-event muon yield as a function of muon transverse momentum,
pT, over the range of 4
< pT <14 GeV. Over that momentum range single muon production results largely from heavy quark decays. The centrality dependence of the muon yields is characterized by the
“central to peripheral” ratio,
RCP. Using this measure, muon production from heavy quark
decays is found to be suppressed by a centrality-dependent factor that increases smoothly
from peripheral to central collisions. Muon production is suppressed by approximately a
factor of two in central collisions relative to peripheral collisions. Within the experimental
errors, the observed suppression is independent of muon
pTfor all centralities.
1 Introduction
Collisions between lead ions at the LHC are thought to produce strongly interacting matter at temper- atures well above the QCD critical temperature. At such temperatures, strongly interacting matter is expected to take the form of “quark-gluon plasma.” High- p
Tquarks and gluons generated in hard- scattering processes during the initial stages of the nuclear collisions are thought to lose energy in the quark-gluon plasma resulting in “jet quenching” [1] . Since the energy loss results from the interaction of a quark or gluon with the medium, jet quenching is thought to provide a valuable tool for probing the properties of the quark-gluon plasma [2–4].
Measurements of heavy quarks are an important complement to studies of light quark and gluon quenching. The contributions from radiative [5] and collisional [6, 7] energy loss in weakly coupled calculations are expected to depend on the heavy quark mass. In particular, the mass of heavy quarks is expected to reduce radiative energy loss for quark transverse momenta less than or comparable to the quark mass (m), p
T .m, through the dead-cone effect [8]. However, measurements of heavy quark production at RHIC via semi-leptonic decays to electrons showed a combined charm and bottom sup- pression in Au
+Au collisions comparable to that observed for inclusive hadron production [9–11]. There is disagreement in the theoretical literature regarding the interpretation of the RHIC heavy quark sup- pression measurements [6,12–14] particularly regarding the role of non-perturbative e
ffects [15–17]. It is clear that measurements of heavy quark quenching at the LHC are an essential complement to inclusive jet [18, 19] or single hadron measurements [20, 21].
The rates for hard scattering processes in nucleus-nucleus (A
+A) collisions are frequently compared to p
+p measurements using the “nuclear modification factor”, R
AA, defined
R
AA ≡dn
A+AT
AAdσ
p+p = σNNN
colldn
A+Adσ
p+p.(1)
Here, dn
A+Arepresents the per-event di
fferential rate for producing some hard-scattering final state in A
+A collisions, dσ
p+prepresents the corresponding cross-section in p
+p collisions, and the nuclear overlap function, T
AA, represents the integrated partonic luminosity of the A+A collision relative to that in p
+p collisions. N
coll, the “number of collisions”, is defined N
coll =T
AAσNN, where
σNNis the nucleon-nucleon total inelastic cross-section. T
AAand N
collrepresent equivalent evaluations of the geometric enhancement of hard scattering processes in A+A collisions, though N
collis more often used in the literature. If factorization were to hold in A
+A collisions and in the absence of nuclear modifications of nucleon parton distribution functions, R
AAwould be unity.
T
AAand N
colldepend on the collision “centrality”, the degree of overlap between the nuclei during the collision. That overlap is frequently characterized by the number of “participating” nucleons, N
part– the number of nucleons that undergo at least one hadronic scattering during the A
+A collision. N
partcan vary from a few nucleons in “peripheral” collisions – collisions with little overlap between the nuclei – to
≈
2A in “central” collisions – collisions with nearly complete overlap between the nuclei. In cases where reference p
+p data are not available, the “central-to-peripheral” ratio, R
CP, is commonly used. R
CPis defined
R
CP≡N
collperiphN
collcentdn
centdn
periph,(2)
where dn
centand dn
periphrepresent the per-event differential rate for the same hard-scattering observable
in central and peripheral collisions, respectively. N
collcentand N
collcentrepresent N
collvalues calculated for
the corresponding centralities (see Sec. 3). The use of R
CPis motivated by the presumption that nuclear
effects such as jet quenching have little impact in peripheral collisions, in which case R
CPand R
AAshould, in principle, provide similar evaluation of nuclear modifications of hard scattering observables in
central collisions. In practice, R
CPmeasurements are typically limited by the statistics of the peripheral
measurement due to the small T
AAor N
collvalues in such collisions. However, R
CPhas the advantage that systematic uncertainties often partially cancel when taking ratios between measurements within the same data set.
This note presents ATLAS measurements of inclusive muon production in Pb+Pb collisions at
√s
=2.76 TeV from an integrated luminosity of approximately 7
µb−1collected in 2010. The measurements were performed for several intervals of collision centrality over the muon transverse momentum range 4
<p
T <14 GeV and the yields compared to those in a peripheral bin using R
CP. Over this p
Trange, muon production in p
+p collisions results predominantly from a combination of charm and bottom quark semi-leptonic decays; all other sources including J/ψ decays contribute less than 1% of the prompt muon yield [22]. The results presented here complement previous measurements by the CMS Collabo- ration [23] of bottom quark suppression performed using measurements of non-prompt J/ψ production.
2 Experimental setup
The measurements presented in this note were obtained using the ATLAS muon spectrometer (MS), inner detector (ID), calorimeter, trigger and data acquisition systems. A detailed description of these detectors and their performance in proton-proton collisions can be found in Refs. [24, 25]. Muons were detected by combining independent measurements of the muon trajectories from the ID and the MS. The ID mea- sures charged particles within the pseudo-rapidity
1interval
|η|<2.5 using silicon pixel detectors, silicon microstrip detectors, and a straw tube tracker, all immersed in a 2 T axial magnetic field. A charged particle typically traverses three layers of silicon pixel detectors, four layers of double-sided microstrip sensors, and 36 straws. The inner detector is surrounded by electromagnetic and hadronic calorime- ters that absorb efficiently the copious charged and neutral hadrons produced in Pb+Pb collisions. A muon loses typically 3 to 5 GeV of energy, depending on the muon pseudorapidity, while crossing the calorimeters. The MS surrounds the calorimeters and provides tracking for muons within
|η| <2.7 in the magnetic field produced by three air-core toroid systems. Muon momenta were measured in the MS using three stations of precision drift chambers.
Two forward calorimeters [24] placed symmetrically with respect to z
=0 and covering 3.2
< |η|<4.9 are used in this analysis to characterize Pb+Pb collision centrality. They are composed of tungsten and copper absorbers with liquid argon as the active medium; each calorimeter has a total thickness of about 10 interaction lengths.
Minimum bias Pb+Pb collisions were identified using measurements from the zero degree calorime- ters (ZDCs) and the minimum-bias trigger scintillator (MBTS) counters [24]. The ZDCs are located symmetrically at z
= ±140 m and cover |η| >8.3. In Pb
+Pb collisions the ZDCs measure primarily
“spectator” neutrons, which originate from the incident nuclei and do not interact hadronically. The MBTS detects charged particles over 2.1
< |η| <3.9 using two counters placed at z
= ±3.6 m. Eachcounter is azimuthally divided into 16 sections, and the MBTS provides measurements of both the pulse heights and arrival times of ionization energy deposits in each section.
Events used in this analysis were selected for recording by the data acquisition system using a logical
OR of ZDC and MBTS coincidence triggers. The MBTS coincidence required at least one hit in both
sides of the detector, and the ZDC coincidence trigger required the summed pulse height from each
calorimeter to be above a threshold set below the single neutron peak.
Table 1: Results of Glauber model evaluation of
hNparti,
hNcolli, and the N
collratio, R
collfor each central- ity. The quoted uncertainties represent the systematic uncertainties in the Glauber calculation.
Centrality
hNparti hNcolliR
coll0–10% 356
±2 1498
±133 56.7
±6.2 10–20% 261
±4 923
±83 34.9
±3.8 20–40% 158
±4 441
±37 16.7
±1.5 40–60% 69.3
±3.5 130
±10 4.9
±0.2 60–80% 22.6
±2.3 26.5
±2 1
3 Event selection and centrality
In the offline analysis, Pb+Pb collisions were required to have a primary vertex reconstructed from charged particle tracks with p
T>500 MeV. The tracks were reconstructed from hits in the inner de- tector using the standard track reconstruction algorithm [26] with settings optimized for the high hit density in heavy ion collisions [27]. Additional requirements of at least one hit in each MBTS counter, a time difference between the two MBTS detectors of less than 3 ns, and a ZDC coincidence were im- posed, yielding a total of 53 million minimum-bias Pb
+Pb events. The combination of the MBTS, ZDC, and the primary vertex requirements eliminates e
fficiently both beam-gas interactions and photo-nuclear collisions [28]. Previous studies [27] indicate that this combination of ZDC trigger and offline require- ments select minimum-bias hadronic Pb
+Pb collisions with an e
fficiency of 98
±2%. The ine
fficiency is concentrated in the very most peripheral collisions not used in this analysis.
The centrality of Pb+Pb collisions was characterized by
ΣE
FCalT, the total transverse energy measured in the forward calorimeters (FCal). For the results presented in this note, the minimum-bias
ΣE
TFCaldistribution was divided into centrality intervals according to the following percentiles of the
ΣE
TFCaldistribution ordered from the most central to the most peripheral collisions: 0-10%, 10-20%, 20-40%, 40-60%, and 60-80%. The centrality intervals were determined after accounting for very peripheral events lost due to the minimum-bias trigger e
fficiency. A standard Glauber Monte-Carlo analysis [29,30]
was used to estimate the average number of participating nucleons,
hNparti, and the average number ofnucleon-nucleon collisions,
hNcolli, for Pb+Pb collisions in each of the centrality bins. The results are shown in Table 1. The R
CPmeasurements presented in the note use the 60-80% centrality bin as a common peripheral reference.
The R
CPcalculation uses the ratio R
coll ≡ hNcolli/hNcoll60−80i, wherehNcoll60−80iis the average number of collisions in the 60-80% centrality bin. The R
colluncertainties have been directly calculated by eval- uating the changes in R
collunder variations of the minimum-bias trigger efficiency, variations of the parameters of the Glauber calculation such as the nucleon-nucleon cross-section, the nuclear radius, and nuclear thickness, and variations in the modeling of the
ΣE
TFCaldistribution [27]. The R
collvalues and uncertainties are also reported in Table 1.
4 Muon reconstruction
Muons used in this analysis were obtained by combining separate measurements of the muon trajectory in the ID and the MS using the same algorithms that were developed for p
+p collisions [22]. The ID tracks were required to have a hit in the first pixel layer, at least 7 hits in the microstrip detector, no missing hits in the microstrip detector in active sensors, and a maximum of one missing hit in the pixel detector.
The tracks were also required to point to within 5 mm of the primary vertex in both the transverse and
longitudinal directions.
Table 2: Approximate number of reconstructed muon candidates in the pseudorapidity interval
|η|<1.05 in each p
Tand centrality bin.
Centrality [%]
p
T[GeV] 0–10 10–20 20–40 40–60 60–80
4–5 49k 36k 43k 17k 4.7k
5–6 19k 15k 18k 7.4k 2.0k
6–7 8.6k 6.5k 8.2k 3.4k 0.93k 7–8 4.1k 3.1k 3.9k 1.6k 0.46k 8–9 2.2k 1.7k 2.1k 0.78k 0.21k 9–10 1.2k 0.93k 1.1k 0.46k 0.13k 10–14 1.7k 1.31k 1.5k 0.62k 0.15k
The reconstructed muon momenta were obtained from a combined fit to the muon trajectories in the ID and MS. The results presented here use muons having 4
<p
T <14 GeV and
|η| <1.05. The lower limit of the p
Trange was chosen to be near the plateau of the muon e
fficiency curve. The upper p
Tlimit results both from the limited statistics of the data and the desire to limit this measurement to a muon p
Trange where the contribution of W decays to the muon spectrum is less than 1% [22, 31]. The muon
ηinterval was chosen to avoid transitional regions in calorimeter coverage where the muon performance is degraded. The momentum resolution is 5% over the measured p
Trange. The number of reconstructed muons passing the described cuts in each p
Tand centrality bin are listed in Table 2.
The performance of the ATLAS detector and o
ffline analysis in measuring muons in Pb
+Pb colli- sions was evaluated using a Monte Carlo (MC) data set [32] originally prepared for studies of jet perfor- mance. The sample also provides enough events containing high-p
Tmuons from heavy flavour decays and background sources for the purposes of this analysis. The MC data set was obtained by overlaying GEANT4-simulated [33]
√s
=2.76 TeV p
+p dijet events on to 1 million GEANT4-simulated minimum- bias Pb+Pb events obtained from version 1.38b of the HIJING event generator [34]. HIJING was run with default parameters, except for the disabling of jet quenching. To simulate the effects of elliptic flow [27] in Pb
+Pb collisions, a parameterized cos 2φ modulation that varies with centrality,
ηand p
Tas determined by previous ATLAS measurements [27] was imposed on the particles after generation [35].
The p
+p events were obtained from the ATLAS MC09 tune [36] of the PYTHIA event generator [37].
One million PYTHIA hard scattering events were generated for each of five intervals of ˆ p
T, the trans- verse momentum of outgoing partons in the 2
→2 hard scattering, with boundaries 17, 35, 70, 140, 280 and 560 GeV. The p
+p events for each ˆ p
Tinterval were overlaid on the same sample of HIJING events.
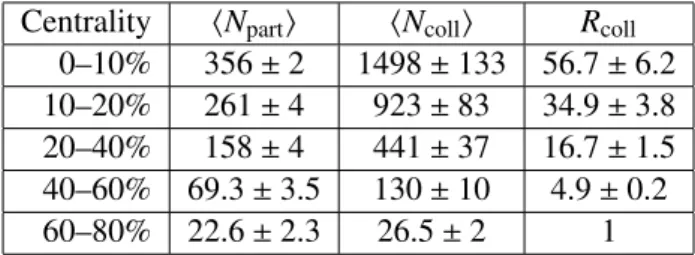
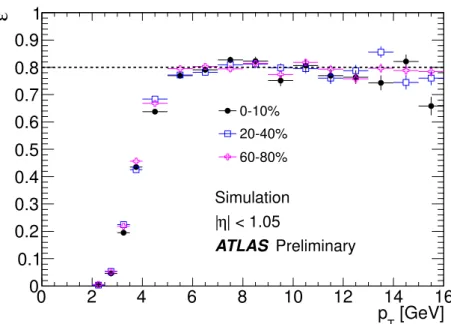
The e
fficiency for reconstructing muons associated with heavy flavour decays was evaluated using
the MC sample described above for different bins in collision centrality. Figure 1 shows the fraction
of muons from semi-leptonic charm and bottom decays reconstructed as a function of muon p
T,
ε(p
T),
for a subset of the centrality bins: 0-10%, 20-40%, and 60-80%. For p
T &5 GeV, the reconstruction
efficiency is found to be constant within the statistical uncertainties. The
ε(p
T) values for each centrality
bin were fit to a constant over the range 5
<p
T <14 GeV to estimate the “plateau” efficiency. The
results for all centrality bins were consistent with
εplat =0.80
±0.02. For 4
<p
T<5 GeV, a statistically
significant variation of
εwith centrality is observed and the efficiencies were taken directly from the
results shown in Fig. 1. Those vary between 0.67
±0.02 in peripheral collisions (60-80%) to 0.64
±0.02
in central collisions (0-10%).
[GeV]
p
T0 2 4 6 8 10 12 14 16
ε
0 0.1 0.2 0.3 0.4 0.5 0.6 0.7 0.8 0.9 1
0-10%
20-40%
60-80%
Simulation
| < 1.05
|η
Preliminary ATLAS
Figure 1: E
fficiency (ε) for reconstructing heavy flavour semi-leptonic decay muons as a function of muon p
Tfor three collision centrality bins. The efficiency is shown over a wider p
Trange than that used in the analysis. The dotted line indicates the plateau efficiency value,
ε=0.8.
5 Muon signal extraction
The measured muons consist of both “signal” muons and background muons. The signal muons are those that originate directly from the Pb+Pb collision, from vector meson decays, and from heavy quark decays. The background muons arise from pion and kaon decays, muons produced in hadronic show- ers in the calorimeters, and mis-associations of MS and ID tracks. Previous studies have shown that the signal and background contributions to the reconstructed muon sample can be discriminated sta- tistically [22, 38]. For this analysis a weighted combination of two discriminant quantities has been used [38]. The fractional momentum imbalance,
∆p
loss/p
ID, quantifies the difference between the ID and MS measurements of the muon momentum after accounting for the energy loss of the muon in the calorimeters [39]. It is defined as:
∆
p
lossp
ID =p
ID−p
MS−∆p
calo( p, η, φ)
p
ID ,(3)
where p
IDand p
MSrepresent the reconstructed muon momenta from the ID and MS, respectively and
∆
p
calorepresents a momentum and angle-dependent average energy loss of muons in the calorimeter ob- tained from MC simulations. The “scattering significance”, S , characterizes deflections in the trajectory resulting from (e.g.) decays in flight. For each measurement along the muon trajectory, i, the deviation in azimuthal angle of the measured hit position from the fitted trajectory,
∆φi, was calculated and compared to the expected deviation from multiple scattering,
φmsc, to obtain the signed quantity s
i ≡q
∆φi/φmsc, where q represents the track charge. The TRT measurements were not used when calculating s
idue to the high occupancy of the TRT in Pb
+Pb collisions. Then, the scattering significance at the kth layer, S (k), was calculated according to:
S (k)
=1
√
n
k
X
i=1
s
i−n
X
j=k+1
s
j
.
(4)
C 0 0.1 0.2 0.3 0.4 0.5 0.6 0.7
C d dP
0 1 2 3 4 5 6 7 8 9 10
Signal, 0-80%
Signal, 0-10%
Signal, 60-80%
Background, 0-80%
Background, 0-10%
Background, 60-80%
Simulation < 6 GeV 5 < p
T| < 1.05
| η
ATLAS Preliminary
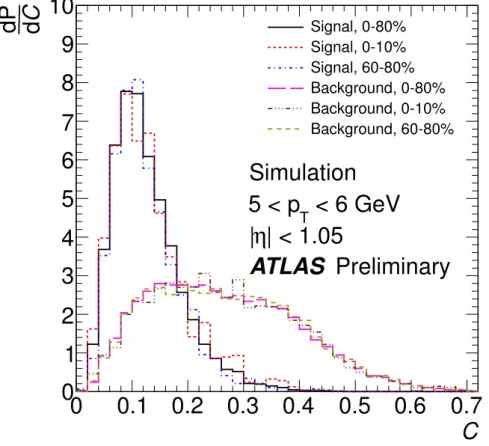
Figure 2: Simulated C distributions, dP/dC, for signal and background muons for the full (0-80%)
centrality range and for the 0-10% and 60-80% centrality bins for muons in the momentum range of 5 –
6 GeV.
Here n represents the total number of measurements of the muon trajectory; typically n
=16. S (k) yields a statistically significant value when the muon is deflected between measurements k and k
+1. An overall scattering significance, S , was obtained from the maximum value of S (k):
S
=max
{|S(k)|, k
=1, 2, ...}. (5)
The effectiveness of
∆p
loss/pIDand S in discriminating between signal and background muons varies with momentum in a complementary manner. S is more e
ffective at lower muon momenta where the deflections resulting from (e.g.) in-flight decays are greater.
∆p
loss/pIDis more e
ffective at larger muon momenta where in-flight decays are less important and a larger fraction of the muons are generated in hadronic showers. To take advantage of the complementarity of the two discriminants, a “composite”
discriminant was formed [38] according to:
C
=∆
p
lossp
ID
+
rS (6)
where r is a parameter that controls the relative contribution of the two discriminants to C. MC studies indicate that r
=0.07 provides optimal separation between signal and background muons over the muon momentum range studied here [38].
Distributions for C were obtained from the PYTHIA
+HIJING Monte Carlo sample for the di
fferent centrality and muon p
Tbins used in this analysis. The C distributions were obtained separately for signal muons from charm and bottom decays and for background muons generated by pions and kaons.
Figure 2 shows the resulting C distributions for muons with 5
<p
T <6 GeV in the 0-10% and 60-80%
centrality bins. As demonstrated by the figure, the signal and background C distributions were found to vary only weakly with collision centrality. As a result, for the template fitting procedure described below, the analysis was carried out using centrality-integrated (0-80%) signal and background C distributions which are also shown in Fig. 2.
The MC signal and background C distributions were used to perform a template fit to the C distri- butions in the data. Specifically, a hypothetical probability density distribution for C, dP/dC is formed assuming that a fraction, f
S, of the measured muons is signal,
dP
dC
=f
SdP dC
S+
(1
−f
S) dP dC
B,
(7)
where dP/dC|
Sand dP/dC|
Brepresent the Monte Carlo C distributions from signal and background sources, respectively.
To account for possible di
fferences in the C distribution between data and MC due to (e.g.) in- accuracies in the MC description of multiple scattering, the fits allow for limited adaptation of the MC templates to the data. In particular, the fit allows a shift and re-scaling of the C distribution, C
0 =a
+hCi+b (C
− hCi), where hCiis the usual mean of the C distribution. In addition, a Gaus- sian smearing of the MC C distribution was included such that the data C distribution was fit to
dP
0dC
0 ≡f
SdP dC
0S+
(1
−f
S) dP dC
0 B!
⊗
e
−C02/2σ2√
2πσ (8)
A kernel estimation method [40] was used to produce the unbinned probability density distribution,
dP
0/dC0from the MC signal and background samples. The signal fraction, f
S, was then evaluated for
each centrality and muon p
Tbin using unbinned maximum likelihood fits with four free parameters, f
S,
a, b, and
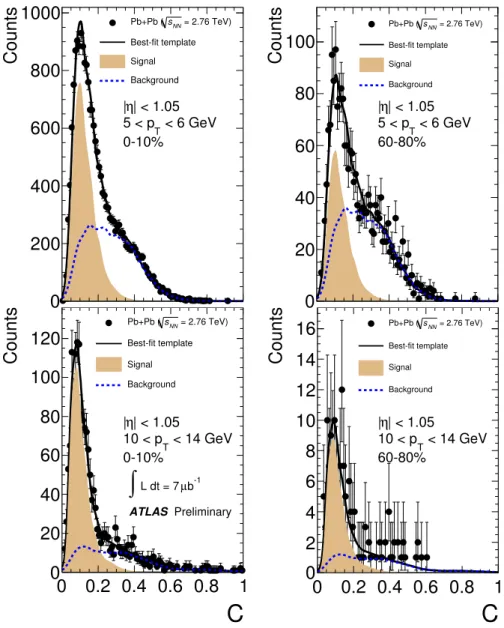
σ. The fits were performed using MINUIT [41] as implemented inRooFit [42]. Examples of
the resulting template fits are shown in Fig. 3 for the 0-10% and 60-80% centrality bins and for two muon
p
Tintervals. Typical fitted values for the a, b, and
σparameters in Eq. 8 are, a
∼0.02, b
∼0.95
−1.05,
C
0 0.2 0.4 0.6 0.8 1
Counts
0 20 40 60 80 100 120
= 2.76 TeV) sNN
Pb+Pb ( Best-fit template Signal Background
| < 1.05 η
|
< 14 GeV 10 < pT
0-10%
b-1
µ L dt = 7
∫
ATLAS Preliminary
0 0.2 0.4 0.6 0.8 1
Counts
0 200 400 600 800
1000
Pb+Pb (sNN = 2.76 TeV)Best-fit template Signal Background
| < 1.05 η
|
< 6 GeV 5 < pT
0-10%
C
0 0.2 0.4 0.6 0.8 1
Counts
0 2 4 6 8 10 12 14
16
Pb+Pb (sNN = 2.76 TeV)Best-fit template Signal Background
| < 1.05 η
|
< 14 GeV 10 < pT
60-80%
0 0.2 0.4 0.6 0.8 1
Counts
0 20 40 60 80 100
= 2.76 TeV) sNN
Pb+Pb ( Best-fit template Signal Background
| < 1.05 η
|
< 6 GeV 5 < pT
60-80%
Figure 3: Examples of the template fits to measured C distributions (see text) in 0-10% (left) and 60- 80% (right) centrality bins for two p
Tintervals: 5
<p
T <6 GeV (top) and 10
<p
T <14 GeV (bottom).
The curves show the contributions of signal and background sources based on the corresponding C
distributions obtained from MC including the shift, re-scaling, and smearing modifications (see text).
and
σ∼0.002. The combination of the MC signal and background C distributions are found to describe well the measured C distributions. The description remains good even if the adaptation of the template described in Eq. 8 is removed, though the fit results may change (see below).
The signal muon fractions extracted from the template fits for all p
Tand centrality bins are shown in Fig. 4. The statistical uncertainties on f
Sfrom the fits represent 1σ confidence intervals that account for the limited statistics in the data C distributions and correlations between the fit parameters. The uncertainties in the fit results due to the finite MC statistics were evaluated using a pseudo-experiment technique in which new pseudo-MC C distributions with the same number of counts as the original MC C distributions were obtained by statistically sampling the MC distributions. The resulting pseudo-MC distributions were then used to perform template fits. The procedure was repeated eight times for each p
Tand centrality bin and the standard deviation of the resulting f
Svalues in each bin was combined in quadrature with the statistical uncertainty from the original fit to produce a combined statistical uncer- tainty on f
S. The fractional uncertainties on f
Sdue to MC statistics are found to be below 2% and are typically much smaller than the uncertainties from the template fits.
The sensitivity of the measured f
Svalues to the adaptation of the MC C distributions to the data was evaluated by performing the fits fixing the a and
σparameters to zero and b to one. Those fits yielded systematically lower f
Svalues than the values obtained from the default fits. The reductions varied from as much as 18% for the 60-80%, 4–5 GeV bin to about 3% for the highest p
Tbins. The di
fferences between the two values for each centrality and p
Tbin were used to estimate systematic uncertainties on the fit due to data-MC matching of the C distributions. Typically, those errors are largest for the lowest p
Tbin and decrease with increasing p
T, but the 6–7 GeV and 7–8 GeV bins also show enhanced sensitivity to the template adaptation. That is particularly true for the 60-80% 7–8 GeV p
Tbin which suffers from low statistics.
The use of the centrality-integrated MC C distributions in the template fitting provides another po- tential source of data-MC mismatch. To evaluate the impact of this choice, the analysis was performed using centrality-selected MC C distributions. The reduction in template statistics worsened the statistical accuracy of the fits, particularly for the most peripheral bin. However, in all cases the di
fferences from the default results were within the uncertainty estimates described in the preceding paragraph. Based on that observation and the judgment that the adaptation of the template distribution can likely account for the small centrality di
fferences observed in the C distributions, no additional systematic error is assigned to account for the use of the centrality-integrated templates.
The MC background C distributions depend on the primary hadron composition, particularly the relative proportions of kaons and pions (K/π) which may di
ffer from that in the data. To test the sensitiv- ity of the results to such a difference, new MC background C distributions were obtained by separately doubling the
πand K contributions. The new C
Bdistributions were used in the template fits and the resulting di
fferences in extracted f
Sused to estimate the K/π systematic uncertainties on the f
Svalues.
The resulting (fractional) uncertainties are typically of order 1%, but they can be as large as 5% in the lowest p
Tbin.
Potential systematic uncertainties resulting from the template fitting procedure were evaluated using a simple cut procedure applied to the C distributions. For a given centrality and p
Tbin, a cut was applied at a chosen value of C, C
cut, and the fraction of muons in the data below the cut, f
<was calculated. For an appropriate choice of cut, that fraction represents most of the signal muons with a modest contamination of background muons. The MC signal and background C distributions were used to evaluate the fraction of the signal (background) muons below the cut, f
S<( f
B<). Then, the fraction of signal muons evaluated using this cut method, f
S(C
cut), was estimated:
f
S(C
cut)
=f
<−f
B<f
S<−f
B<.(9)
[GeV]
p
T4 6 8 10 12 14
S
f
0 0.2 0.4 0.6
60-80%
S
f
0 0.2 0.4 0.6
40-60%
S
f
0 0.2 0.4 0.6
20-40%
S
f
0 0.2 0.4 0.6
10-20%
ATLAS Preliminary
S
f
0 0.2 0.4
0.6
|η| < 1.050-10%
=2.76 TeV sNN
Pb+Pb, b-1
µ L dt = 7
∫
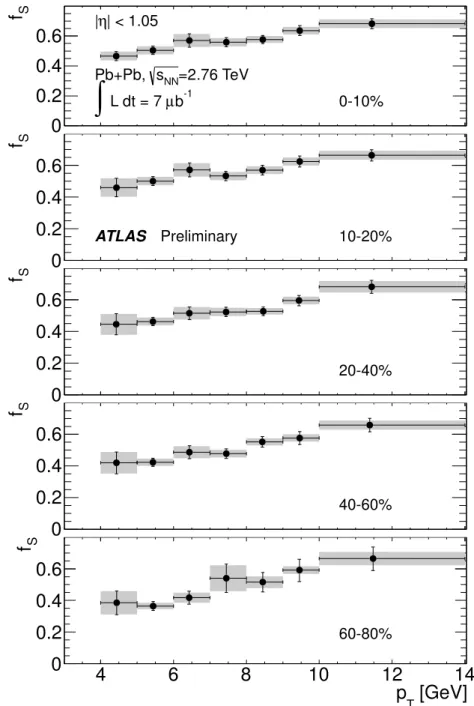
Figure 4: Fractions of signal muons, f
S, in the measured muon yields as a function of muon p
Tin dif-
ferent bins of collision centrality. The points are shown at the mean transverse momentum of the muons
in the given p
Tbin. The shaded boxes indicate systematic errors (see text) due to possible data-MC tem-
plate matches and the template fitting (i.e. combination of dP/dC and “Fit” entries in Table 3), which
can vary from point-to-point. The error bars show combined statistical and total systematic uncertainties
including the e
fficiency and hadron composition (K/π), some of which are also too small to be visible.
[GeV]
pT
4 5 6 7 8 9 10 11 12 13 14
ηd T dp TpN2 d evtN1
10-7
10-6
10-5
10-4
10-3
Pb+Pb
= 2.76 TeV sNN
| < 1.05 η
|
b-1
L dt = 7 µ
∫
ATLAS
0-10%
10-20%
20-40%
40-60%
60-80%
Preliminary
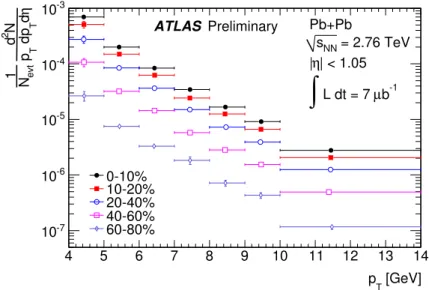
Figure 5: Invariant differential muon per-event yields calculated according to Eq. 10 as a function of muon p
Tfor di
fferent bins in collision centrality. The points are shown at the mean transverse momentum of the muons in the given p
Tbin. The statistical errors are smaller than the sizes of the points in all bins and are not shown. The error bars indicate combined statistical and systematic errors (see text).
f
Scutvalues were obtained using C
cutvalues of 0.15, 0.2, and 0.25. The results from the three C
cutvalues agree typically to within a few %. The averages of the three f
Scutvalues for each p
Tand centrality bin were compared to the results of the template fit where the adaptation was disabled. These two different estimates of the signal fraction agreed typically to better than 1%, but di
fferences as large as 5% were observed for the 60-80% centrality bin. These differences were used to establish systematic uncertainties associated with the template fitting procedure.
Table 3 summarizes the contributions to the systematic error in the determination of the signal frac- tion, f
S, for three sample p
Tbins in 0-10% and 60-80% centrality bins.
6 Results
The invariant di
fferential per-event muon yields for a given centrality bin were obtained according to 1
N
evtd
2N p
Td p
Tdη
cent
=
1
N
evtcentN
Scent( p
T)
εcent
( p
T) p
T∆p
T∆η(10)
where N
evtis the number of sampled Pb
+Pb collisions in the centrality interval, N
Scentis the number of signal muons in the centrality bin and
εcentis the muon reconstruction efficiency discussed in the previous section. Figure 5 shows the resulting distributions for the five centrality bins included in this analysis.
The yields increase by more than an order of magnitude between peripheral and central collisions as expected from the geometric enhancement of hard scattering rates.
The muon R
CPis calculated from the ratio of the invariant differential yields between a given cen- trality bin and the 60-80% bin multiplied by 1/R
coll. Since the kinematic and phase space factors cancel between the numerator and denominator, the R
CPcalculation reduces to
R
CP(p
T)|
cent =1 R
centcoll
1 N
evtcentN
Scent εcent1
N
evt60−80N
S60−80ε60−80
.
(11)
Table 3: Systematic uncertainty contributions from different sources for sample p
Tbins in 0-10% and 60-80% centrality bins. “dP/dC” represents the systematic uncertainties due to potential data-MC mis- matches in the template, “Fit” represents the estimated systematic on the fitting procedure evaluated using the cut method. “K/π” represents the uncertainty due to the hadron composition and “ε” represents the uncertainty on the efficiency estimation.
Centrality p
TUncertainty [%]
[%] [GeV] dP/dC Fit K/π ε Total
0-10
4–5 4 0 5 3 7
7–8 5 0.5 0.5 2 5.5
10–14 4 1 1 2 5
60-80
4–5 18 1 5 3 19
7–8 14 5 0.5 2 15
10–14 4 4 2 2 6
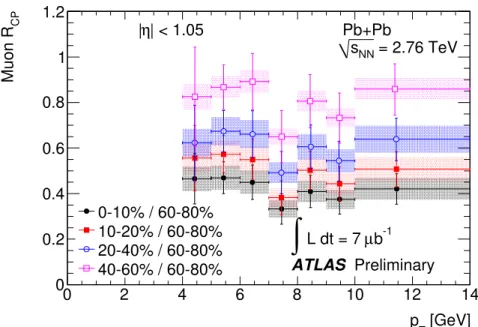
The resulting R
CPvalues are shown in Fig. 6. The R
CPvalues vary weakly with p
Tand the points for each centrality interval are consistent with a p
T-independent R
CPwithin the uncertainties on the points.
The R
CPvaries strongly with centrality, increasing from about 0.4 in the 0-10% centrality bin to about 0.85 in the 40-60% bin.
One disadvantage of R
CPis the poor statistics in peripheral bins, which have small geometric en- hancement of hard scattering processes compared to central collisions. Statistical errors in the reference peripheral p
Tbin then influence the R
CPresults for that bin for all centralities. Such an effect can be observed in Fig. 6 for the 7–8 GeV p
Tbin. Alternatively, the centrality variation can be characterized by comparing different centrality bins to the most central bin which has the highest statistics producing a peripheral-to-central ratio, R
PC. The R
PCis defined analogously to Eq. 11 but with the 60-80% reference replaced by the 0-10% centrality bin. Figure 7 shows the resulting R
PCvalues as a function of p
Tfor dif- ferent collision centralities. The figure provides similar insights as Fig. 6, but the R
PCallows a stronger statement about the p
Tdependence of the suppression. Namely, the shape of the muon spectra in the 0-10%, 10-20%, 20-40% and 40-60% centrality bins remains the same, within uncertainties, while over those centrality bins the suppression is changing by a factor of nearly 2.
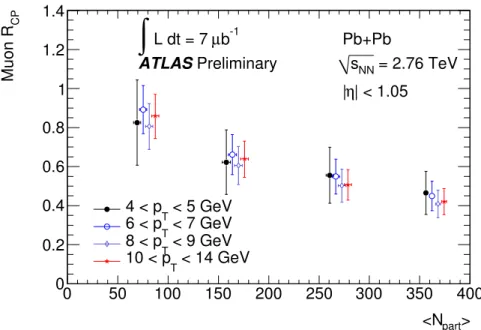
The variation of R
CPwith centrality as characterized by the average number of participants,
hNparti,is shown in Fig. 8 for the di
fferent p
Tbins included in the analysis. The R
CPdecreases smoothly from peripheral to central collisions. The centrality dependence is observed to be the same for all p
Tbins within the experimental uncertainties.
7 Discussion
CMS has previously reported measurements of R
AAfor non-prompt J/ψ produced in b decays in
√s
=2.76 TeV Pb
+Pb collisions [23]. The R
AAin the 0-20% centrality bin (hN
parti=308) is consistent with
the 0-10% (hN
parti=356) muon R
CPpresented here in the 10
<p
T <14 GeV bin, for which the muon
yield is expected to be dominated by b decay contributions. However, the R
AAreported by CMS in
the 20-100% bin (hN
parti =64) falls well below the R
CPmeasurements presented here. Since the CMS
results are in terms of R
AAand this analysis uses centrality 60-80% as the peripheral reference, we have
[GeV]
pT
0 2 4 6 8 10 12 14
CPMuon R
0 0.2 0.4 0.6 0.8 1 1.2
0-10% / 60-80%
10-20% / 60-80%
20-40% / 60-80%
40-60% / 60-80%
Pb+Pb
= 2.76 TeV sNN
| < 1.05 η
|
b-1
µ L dt = 7
∫
ATLAS PreliminaryFigure 6: Muon R
CPas a function of p
Tcalculated according to Eq. 11 for di
fferent centrality bins. The points are shown at the mean transverse momentum of the muons in the given p
Tbin. The error bars include both statistical and systematic uncertainties. The contribution of the systematic uncertainties from R
colland
ε, which are fully correlated betweenp
Tbins, are indicated by the shaded boxes.
[GeV]
pT
0 2 4 6 8 10 12 14
PCMuon R
0 0.5 1 1.5 2 2.5 3 3.5 4
10-20% / 0-10%
20-40% / 0-10%
40-60% / 0-10%
60-80% / 0-10%
Pb+Pb
= 2.76 TeV sNN
| < 1.05 η
|
b-1
µ L dt = 7
∫
ATLAS PreliminaryFigure 7: Muon peripheral to central ratio, R
PC, as a function of p
Tcalculated according to Eq. 11 for
di
fferent centrality bins. The points are shown at the mean transverse momentum of the muons in the
given p
Tbin. The error bars include both statistical and systematic uncertainties. The contribution of the
systematic uncertainties from R
colland
ε, which are fully correlated betweenp
Tbins, are indicated by
the shaded boxes.
part>
<N
0 50 100 150 200 250 300 350 400
CPMuon R
0 0.2 0.4 0.6 0.8 1 1.2 1.4
Pb+Pb
= 2.76 TeV sNN
| < 1.05 η
| b-1
µ L dt = 7
∫
ATLAS< 5 GeV 4 < pT
< 7 GeV 6 < pT
< 9 GeV 8 < pT
< 14 GeV 10 < pT
Preliminary
Figure 8: Muon R
CPas a function of
hNparticalculated according to Eq. 11 for di
fferent bins in muon p
T. The error bars show combined statistical and systematic uncertainties. The sets of points for the different
p
Tbins are successively displaced by
∆N
part=6 for clarity of presentation.
di
ffer appreciably from measurements of single hadron suppression at the LHC at comparable transverse momenta [20, 21, 43]. The single hadron R
CPreported by CMS [20] in the 0-5% centrality bin relative to the 50-90% centrality interval is a factor of approximately two smaller than the 0-10% muon R
CPvalue reported here, while that in the 5-10% centrality bin is lower by about 50%. The single hadron R
CPis also observed to vary much more rapidly with p
Tthan the muon R
CPshown in Fig. 6. Interpretation of this difference may be complicated by the indirect relationship between the transverse momentum of the observed particle and the parent parton for both the hadrons and the muons. Nonetheless, the clear difference between semi-leptonic muon and charged hadron suppression at the LHC should be contrasted with the situation at RHIC where the experimental data do not indicate such a difference [10].
PHENIX has reported a semi-leptonic electron R
AAfor p
T >4 GeV in the 0-10% centrality bin of 0.30
±0.02(stat)
±0.04(syst) [11]. STAR has reported similar results for R
AA( p
T) [10]. The RHIC semi- leptonic electron results show more suppression than the measurements reported here, while the natural expectation would be that the suppression would be greater in Pb
+Pb collisions at the LHC due to the higher initial energy densities [44].
8 Conclusions
This note has presented ATLAS measurements of muon production and suppression in
√s
=2.76 TeV
Pb+Pb collisions in a transverse momentum range dominated by heavy flavor decays, 4
<p
T <14 GeV,
and over the pseudo-rapidity range
|η| <1.05. The fraction of prompt muons was estimated using
template fits to the distribution of a quantity capable of distinguishing statistically between signal and
background. The p
Tspectra of signal muons were evaluated in five centrality bins: 0-10%, 10-20%,
(0-10%) collisions compared to the most peripheral collisions included in the analysis (60-80%). No significant variation of R
CPwith muon p
Tis observed. The R
CPdecreases smoothly from peripheral to central collisions. The central muon R
CPfor 10
<p
T <14 GeV agrees with the central (0-10%) non-prompt J/ψ R
AAmeasured by CMS. The central R
CPis 1.5-2 times larger than that measured for charged hadrons in a comparable p
Trange and using comparable, though not identical, centrality ranges.
The central R
CPindicates weaker suppression than observed in the semi-leptonic electron R
AAmeasured over the same p
Trange in
√s
=200 GeV Au+Au collisions at RHIC.
References
[1] A. Majumder and M. Van Leeuwen, The Theory and Phenomenology of Perturbative QCD Based Jet Quenching, Prog. Part. Nucl. Phys.
A66(2011) 41–92, arXiv:1002.2206.
[2] X.-N. Wang, M. Gyulassy, and M. Plumer, The LPM e
ffect in QCD and radiative energy loss in a quark gluon plasma, Phys. Rev.
D51(1995) 3436–3446, arXiv:hep-ph/9408344.
[3] R. Baier, Y. L. Dokshitzer, A. H. Mueller, and D. Schi
ff, Radiative energy loss of high energy partons traversing an expanding QCD plasma, Phys. Rev.
C58(1998) 1706–1713,
arXiv:hep-ph/9803473.
[4] M. Gyulassy, P. Levai, and I. Vitev, Non-Abelian energy loss at finite opacity, Phys. Rev. Lett.
85(2000) 5535–5538, arXiv:nucl-th/0005032.
[5] M. Djordjevic and M. Gyulassy, Heavy quark radiative energy loss in QCD matter, Nucl. Phys.
A733
(2004) 265–298, arXiv:nucl-th/0310076.
[6] S. Wicks, W. Horowitz, M. Djordjevic, and M. Gyulassy, Elastic, inelastic, and path length fluctuations in jet tomography, Nucl. Phys.
A784(2007) 426–442, arXiv:nucl-th/0512076.
[7] M. Djordjevic, Collisional energy loss in a finite size QCD matter, Phys. Rev.
C74(2006) 064907, arXiv:nucl-th/0603066 [nucl-th].
[8] Y. L. Dokshitzer and D. Kharzeev, Heavy quark colorimetry of QCD matter, Phys. Lett.
B519(2001) 199–206, arXiv:hep-ph/0106202 [hep-ph].
[9] PHENIX Collaboration, A. Adare et al., Energy Loss and Flow of Heavy Quarks in Au
+Au Collisions at
√s
NN =200 GeV , Phys. Rev. Lett.
98(2007) 172301, arXiv:nucl-ex/0611018.
[10] STAR Collaboration, B. Abelev et al., Transverse momentum and centrality dependence of high-p
Tnon-photonic electron suppression in Au
+Au collisions at
√s
=200 GeV,
Phys. Rev. Lett.
98(2007) 192301, arXiv:nucl-ex/0607012. Erratum-ibid. 106 (2011) 159902.
[11] PHENIX Collaboration, A. Adare et al., Heavy Quark Production in p
+p and Energy Loss and Flow of Heavy Quarks in Au
+Au Collisions at
√s
NN
=200 GeV , Phys. Rev.
C84(2011) 044905, arXiv:1005.1627 [nucl-ex].
[12] M. Djordjevic, Jet suppression of pions and single electrons at Au
+Au collisions at RHIC, Phys.Rev.
C85(2012) 034904, arXiv:1105.6082 [nucl-th].
[13] P. Gossiaux and J. Aichelin, Towards an understanding of the RHIC single electron data,
Phys. Rev.
C78(2008) 014904, arXiv:0802.2525.
[14] J. Uphoff, O. Fochler, Z. Xu, and C. Greiner, Elliptic flow and energy loss of heavy quarks in ultra-relativistic heavy ion collisions, Phys. Rev.
C84(2011) 024908, arXiv:1104.2295.
[15] A. Adil and I. Vitev, Collisional dissociation of heavy mesons in dense QCD matter, Phys. Lett.
B649
(2007) 139–146, arXiv:hep-ph/0611109 [hep-ph].
[16] H. van Hees, M. Mannarelli, V. Greco, and R. Rapp, Nonperturbative heavy-quark di
ffusion in the quark-gluon plasma, Phys. Rev. Lett.
100(2008) 192301, arXiv:0709.2884.
[17] W. Horowitz and M. Gyulassy, Testing AdS
/CFT Drag and pQCD Heavy Quark Energy Loss, J. Phys. G
G35(2008) 104152, arXiv:0804.4330.
[18] ATLAS Collaboration, Observation of a Centrality-Dependent Dijet Asymmetry in Lead-Lead Collisions at
√s
NN =2.76 TeV with the ATLAS Detector at the LHC, Phys. Rev. Lett.
105(2010) 252303, arXiv:1011.6182.
[19] CMS Collaboration, Observation and studies of jet quenching in PbPb collisions at
√s
NN=2.76 TeV., Phys. Rev. C
84(2011) 024906, 1102.1957.
[20] CMS Collaboration, Study of high-p
Tcharged particle suppression in PbPb compared to pp collisions at
√s
NN =2.76 TeV , arXiv:1202.2554 [nucl-ex].
[21] ALICE Collaboration, Suppression of Charged Particle Production at Large Transverse Momentum in Central Pb–Pb Collisions at
√s
NN =2.76 TeV , Phys. Lett.
B696(2011) 30–39, arXiv:1012.1004 [nucl-ex].
[22] ATLAS Collaboration, Measurements of the electron and muon inclusive cross-sections in proton-proton collisions at
√s
=7 TeV with the ATLAS detector, Phys. Lett.
B707(2012) 438–458, arXiv:1109.0525.
[23] CMS Collaboration, Suppression of non-prompt J/ψ, prompt J/ψ, and Y(1S ) in PbPb collisions at
√
s
NN =2.76 TeV, arXiv:1201.5069 [nucl-ex].
[24] ATLAS Collaboration, The ATLAS Experiment at the CERN Large Hadron Collider, JINST
3(2008) S08003.
[25] ATLAS Collaboration, Expected Performance of the ATLAS Experiment - Detector, Trigger and Physics, CERN-OPEN-2008-20.
[26] T. Cornelissen, M. Elsing, I. Gavrilenko, W. Liebig, E. Moyse, et al., The new ATLAS track reconstruction (NEWT), J. Phys. Conf. Ser.
119(2008) 032014.
[27] ATLAS Collaboration, Measurement of the pseudorapidity and transverse momentum dependence of the elliptic flow of charged particles in lead-lead collisions at
√s
NN=2.76 TeV with the ATLAS detector, Phys. Lett.
B707(2012) 330–348, arXiv:1108.6018.
[28] O. Djuvsland and J. Nystrand, Single and Double Photonuclear Excitations in Pb
+Pb Collisions at
√s
NN =2.76 TeV at the CERN Large Hadron Collider, Phys. Rev.
C83(2010) 041901, arXiv:1011.4908.
[29] B. Alver, M. Baker, C. Loizides, and P. Steinberg, The PHOBOS Glauber Monte Carlo,
[31] ATLAS Collaboration, Measurements of W Boson Yields in Pb
+Pb at 2.76 TeV
/nucleon via single muons with the ATLAS detector, https://cdsweb.cern.ch/record/1353227.
ATLAS-CONF-2011-078.
[32] ATLAS Collaboration, The ATLAS Simulation Infrastructure, Eur. Phys. J.
C70(2010) 823–874, arXiv:1005.4568.
[33] S. Agostinelli et al., GEANT4: A simulation toolkit, Nucl. Instrum. Meth.
A506(2003) 250–303.
[34] X.-N. Wang and M. Gyulassy, HIJING: A Monte Carlo model for multiple jet production in p p, p A and A A collisions, Phys. Rev.
D44(1991) 3501–3516.
[35] M. Masera, G. Ortona, M. Poghosyan, and F. Prino, Anisotropic transverse flow introduction in Monte Carlo generators for heavy ion collisions, Phys. Rev.
C79(2009) 064909.
[36] ATLAS Collaboration, Charged-particle multiplicities in pp interactions measured with the ATLAS detector at the LHC, New J. Phys.
13(2010) 053033, arXiv:1012.5104.
[37] T. Sjostrand, S. Mrenna, and P. Z. Skands, PYTHIA 6.4 Physics and Manual, JHEP
05(2006) 026, arXiv:hep-ph/0603175.
[38] ATLAS Collaboration, Di-muon composition in ATLAS at 7 TeV,
http://cdsweb.cern.ch/record/1326960. ATLAS-CONF-2011-003.
[39] ATLAS Collaboration, Extraction of the prompt muon component in inclusive muons produced at
√
s
=7 TeV, http://cdsweb.cern.ch/record/1281366. ATLAS-CONF-2010-075.
[40] K. S. Cranmer, Kernel estimation in high-energy physics, Comput. Phys. Commun.
136(2001) 198–207, arXiv:hep-ex/0011057.
[41] F. James and M. Roos, Minuit: A System for Function Minimization and Analysis of the Parameter Errors and Correlations, Comput. Phys. Commun.
10(1975) 343–367.
[42] W. Verkerke and D. P. Kirkby, The RooFit toolkit for data modeling, eConf
C0303241(2003) MOLT007, arXiv:physics/0306116.
[43] ATLAS Collaboration, Measurement of the centrality dependence of charged particle spectra and R
CPin lead-lead collisions at
√s
NN =2.76 TeV with the ATLAS detector at the LHC, https://cdsweb.cern.ch/record/1355702. ATLAS-CONF-2011-079.
[44] W. Horowitz and M. Gyulassy, The Surprising Transparency of the sQGP at LHC, Nucl. Phys.
A872