ATLAS-CONF-2013-107 05November2013
ATLAS NOTE
ATLAS-CONF-2013-107
November 5, 2013
Transverse momentum, rapidity, and centrality dependence of inclusive charged-particle production in √
s
NN= 5.02 TeV p + Pb collisions measured by the ATLAS experiment
The ATLAS Collaboration
Abstract
Measurements of transverse momentum distributions of charged particles were per- formed using
p+Pb collision data collected by the ATLAS experiment at a centre-of-mass energy of
√sNN =
5.02 TeV. Charged particles were reconstructed over pseudorapidity
|η|<
2.5 and transverse momentum between 0.1 GeV and 22 GeV in a data set corresponding to an integrated luminosity of 1
µb−1. The
p+Pb collision centrality was characterized by the total transverse energy measured in 3.1
< η <4.9, which is in the direction of the outgo- ing lead beam. The
p+Pb charged particle multiplicities were compared to charged particleproduction in
ppcollisions obtained by interpolating measurements at
√s =
2.76 TeV and 7 TeV to 5.02 TeV. Results are presented in the form of charged particle nuclear modifica- tion factors,
RpPb, and the central to peripheral ratios,
RCP. The
RpPband
RCPvalues are found to vary significantly as a function of rapidity and transverse momentum. A broad peak is observed for all centralities and rapidities in
RpPb(
pT) and
RCP(
pT) in the vicinity of
pT ∼3 GeV. However, the magnitude of the peak increases for more central collisions and rapidity ranges closer to the direction of the outgoing lead nucleus.
c
Copyright 2013 CERN for the benefit of the ATLAS Collaboration.
1 Introduction
Proton-nucleus collisions at high energies provide an ideal environment for understanding the role of the nuclear environment in modifying hard scattering rates. Several physics effects are expected to induce deviations from a simple proportionality with the number of binary nucleon-nucleon collisions, relative to a proton-nucleon reference system. For an extensive review of predictions, see [1]. Nuclear shadowing has been long-observed in both deep inelastic scattering (DIS) on nuclei, as well as in proton-nucleus col- lisions, indicating that nucleons embedded in a nucleus have a modified structure. This tends to suppress hadron production at low to moderate momentum, and is addressed by a variety of approaches [2, 3].
Some theoretical approaches parametrize the relative cross sections per nucleon as a modification of the nuclear parton distribution functions (nPDF) [4–8]. Approaches based on parton saturation in high density QCD at low Bjorken
x, commonly known as the “Color Glass Condensate” (CGC), are used topredict nuclear e
ffects from first principles. These typically lead to a suppression of the nuclear gluon density at low Bjorken
xand moderate
Q2[9–14].
At the same time, relative enhancements in hadron production have been observed in proton-nucleus collisions, known as the “Cronin e
ffect”, which have generally been attributed to initial state scattering of the incoming nucleon [15, 16]. Finally, many theoretical approaches include energy loss in “cold nuclear matter”, which is expected to modify hadron production rates at high
pT[17]. These e
ffects can be explored experimentally by the measurement of charged hadrons as a function of transverse momentum (
pT .20 GeV), where Cronin, shadowing, energy loss, and Color Glass effects are all expected to contribute.
For proton-lead (p
+Pb) collisions the expected particle production rate is determined by the product σ
NN × hTPbi, whereσ
NNis the inelastic nucleon-nucleon cross section. Neglecting isospin effects, σ
NN ≈σ
pp, the
ppcross section. The
hTPbiis the average value of the nuclear thickness function (in units of inverse barns) over a distribution of proton impact parameters incident on the nuclear target. The impact parameter
bis not a directly measurable quantity, but it is well defined in Glauber Monte-Carlo simulations [18], which are then used to estimate the centrality of the events. The “nuclear modification factor”
RpPbcan be written as:
RpPb
(
pT, y
?)
=1
hTPbi1/N
evtd
2Np+Pb/dy
?dp
Td
2σ
pp/dy
?d
pT. (1)
where the numerator is the per-event yield (N
p+Pb/N
evt) of charged particles. Both numerator and de- nominator are presented in terms of y
?, the rapidity in the nucleon-nucleon centre-of-mass. In the ab- sence of nuclear effects, the ratio
RpPbwill be unity at high
pT. Alternatively, a similar nuclear mod- ification factor comparing central to peripheral events,
RCP, can be constructed without the need for a
ppreference spectrum and knowledge of y using yields from peripheral
p+Pb collisions, scaled by the appropriate
hTPbi, as the denominator.
RCPis defined as
RCP
(
pT, η)
= hTPb,Pi hTPb,Ci(1/N
evt,C)d
2Np+Pb,C/dηdp
T(1/N
evt,P)d
2Np+Pb,P/dηd
pT, (2) where indices “P” and “C” correspond to peripheral (large impact parameter) and central (small impact parameter) centrality intervals, respectively. This nuclear modification factor is presented as a function of η rather than y since both numerator and denominator are from systems with the same longitudinal boosts.
This note presents measurements of per-event charged particle yields in
√sNN =
5.02 TeV
p+Pbcollisions as a function of
pT, η and y
?. Results are also presented in intervals of collision centrality.
The collision centrality is estimated using the sum of transverse energy measured in the ATLAS forward
calorimeter in the outgoing Pb beam direction, 3.1 < η < 4.9. The modification of charged particle
production in
p+Pb collisions with respect to ppcollisions is shown with the two nuclear modification factors described above.
RpPbis presented as a function of
pTin slices of y
?for a set of selected centrality intervals spanning the 90% most central
p+Pb collisions. The centrality dependence of charged particleproduction was separately evaluated using central-to-peripheral ratios,
RCP, presented as a function of
pT
in slices of η.
These measurements are an extension of a similar program started at RHIC, where all experiments reported the absence of suppression at high
pTin d+Au collisions [19–22]. These observations were in contrast to the strong suppression found in Au
+Au collisions [23, 24]. Some of the rapidity dependent results from the d+Au program at RHIC [25–27] and back-to-back hadron correlations [27] were inter- preted as indicating the onset of the CGC at RHIC energies in the forward rapidity region. However, other theoretical models describe those results equally well [28], generating interest in the much higher centre-of-mass energy at the LHC as a potentially more favorable environment to establish the onset of deviations from binary scaling in nuclear targets. Identified particle spectra have been reported by ALICE [29] and CMS [30], and a first measurement in
p+Pb collisions of centrality-integrated charged hadron production in a narrow pseudorapidity window relative to the centre-of-mass frame (|η
cms|< 0.3) was reported by ALICE [31]. In the latter work, no suppression was observed at high-p
T. The mea- surements presented in this work should also provide useful input for constraining models of shadowing, energy loss and the Cronin e
ffect. They should also provide useful input for the determination of nPDF, in particular as a function of proton impact parameter and Bjorken
x[6].
2 The ATLAS detector
The measurements presented in this note are performed using the ATLAS Inner Detector (ID), calorime- ters and the minimum-bias trigger scintillators (MBTS) [32]. The ID measures hits of charged particles with a combination of silicon pixel and silicon micro-strip detectors, and a straw-tube transition radia- tion tracker, all immersed in a 2 T axial magnetic field [33]. Hits are reconstructed into charged particle tracks over
|η|< 2.5. The electromagnetic and hadronic calorimeters, used in the event selection, cover
|η|
< 4.9 using a combination of lead-liquid argon, copper-liquid argon and steel-scintillator sampling calorimeters and the forward calorimeters (FCal). The FCal consists of two sections, one on either side of the interaction point, that cover 3.1 <
|η|< 4.9. and are composed of tungsten and copper absorbers with liquid argon as active medium. Together, the two sections provide 10 interaction lengths of material.
The MBTS detects charged particles over 2.1 <
|η|< 3.9 using two hodoscopes of 16 counters positioned at
z=±3.6 m.3 Data sets and event selection
3.1 Event selection in p + Pb collisions
The
p+Pb collisions were obtained by the ATLAS detector during the pilot run of the LHC in September2012. The Pb ions had an energy per nucleon of 1.57 TeV and collided with the 4 TeV proton beam, yielding a centre-of-mass energy
√s=
5.02 TeV with a longitudinal rapidity boost of -0.465 relative to the ATLAS laboratory frame
1. In this configuration, the proton had negative rapidity and the lead
1ATLAS uses a right-handed coordinate system with its origin at the nominal interaction point (IP) in the center of the detector and thez-axis along the beam pipe. Thex-axis points from the IP to the center of the LHC ring, and theyaxis points upward. Cylindrical coordinates (r, φ) are used in the transverse plane,φbeing the azimuthal angle around the beam pipe. For thep+Pb collisions, the incident Pb beam traveled in the+zdirection. The pseudorapidity is defined in laboratory coordinates in terms of the polar angleθas η = −ln tan(θ/2) All pseudorapidity values quoted in this note are defined in laboratory
y=0.5 ln + )/(E
nucleus had positive rapidity. For the remainder of this note, the terms Pb beam direction and proton beam direction will be used to refer to positive and negative pseudorapidities, respectively.
In the offline analysis, charged particle tracks and collision vertices were reconstructed from clusters in the pixel detector and the SCT using an algorithm optimized for minimum-bias
ppmeasurements [34].
The
p+Pb events selected for this analysis were required to have a collision vertex satisfying
|zvtx|<
150 mm, at least one hit in each side of the MBTS and a difference between the times measured in the two MBTS hodoscopes of less than 10 ns. Events containing multiple
p+Pb collisions (pileup) weresuppressed by rejecting events with a second reconstructed vertex having a scalar transverse momentum sum with
ΣpT> 5 GeV. The residual pileup fraction has been estimated to be 10
−4[35]. About 2 million events pass these event selection criteria.
To remove potentially significant contributions from electromagnetic and di
ffractive processes, a rapidity gap analysis similar to that applied in a recent measurement of diffraction in 7 TeV proton-proton collisions [36] was applied to the
p+Pb data. The detector is divided into slices of∆η
=0.2 and “edge”
gaps are calculated as the distance from the edge of the calorimeter to the nearest slice that contains a cluster with a minimum transverse energy of 200 MeV. Events with a large edge gap (
∆η
Pbgap> 2) in the positive η (Pb) direction are excluded from the analysis. No requirement was imposed on edge gaps on the negative η (p) side. The gap requirement removed a fraction,
fgap =1%, of the events passing the vertex and MBTS timing cuts and yielded a total of 2.1
×10
6events used in this analysis. This is described in more detail in a recent ATLAS measurement of the inclusive charged-particle multiplicity in
p+Pb collisions [37].
3.2 Event selection in pp collisions
The proton-proton data sets used in this note were obtained during low luminosity data taking periods.
Proton-proton collisions at
√s =
2.76 TeV with total integrated luminosity 202 nb
−1were obtained by the ATLAS experiment in March 2011. Proton-proton collisions at
√s =
7 TeV with total integrated luminosity 188 µb
−1were obtained in April 2010. The average number of collisions per bunch crossing during these run periods reached significantly higher values than in
p+Pb, especially at 2.76 TeV wherepeak values are
∼0.4, while they remain low at 7 TeV (∼ 10
−2). Events were used within the vertex range
|zvtx|< 150 mm, and at least one hit in each of the MBTS detectors. In addition, a time di
fference of less than 10 ns was required between the two MBTS sides.
3.3 Monte Carlo data sets
The response of the ATLAS detector and the performance of reconstruction algorithms were evaluated using one million minimum-bias 5.02 TeV Monte Carlo
p+Pb events, produced by version 1.38b of the HIJING event generator [38]. Di
ffractive processes were disabled. The events were then fully simulated using GEANT4 [39, 40]. To match the LHC
p+Pb beam conditions, the momentum four-vector ofeach generated particle was longitudinally boosted by a rapidity of -0.465. The simulated events were then digitized using data conditions appropriate to the pilot
p+Pb run and reconstructed using the same algorithms that were applied to the experimental data.
The LHC did not provide
ppcollisions at the same energy as the
p+Pb collisions. Thus, the
ppspectrum used as a reference for the
p+Pb is based on an interpolation of two data samples measured at
√s=2.76 TeV and 7 TeV. To evaluate event selection and tracking efficiencies, corresponding MC
samples with 20 million events each were generated based on PYTHIA6 [41]. The simulated detector
conditions were chosen to model the evolution of the detector status during each run period.
4 Centrality selection
The centrality determination of ATLAS uses the total transverse energy,
ΣETPb, measured in the positive rapidity sections of the forward calorimeter, in the direction of the Pb beam. The procedure used in this note is identical to that used for the analysis of the charged particle multiplicity [37].
The transverse energy in the forward calorimeter is evaluated at the electromagnetic energy scale and has not been corrected for hadronic response.
ΣETPbis sensitive to the particle production expected to be associated with multiple interactions of the proton in the target nucleus in central collisions. As was shown in Ref. [37], the corresponding
hΣETpion the proton beam side saturates as a function of
ΣEPbT. Thus,
ΣEPbTis used to characterize
p+Pb collision centrality for the analysis presented here. In previous Pb+Pb [42] and
p+Pb analyses, centrality intervals were defined in terms of percentiles of the ΣEPbTdistribution after accounting for an estimated ine
fficiency of
≈2± 2% for inelastic
p+Pb events to pass the applied event selection criteria. The following centrality intervals are used in this analysis: 0-1%, 1- 5%, 5-10%, 10-20%, 20-30%, 30-40%, 40-60%, 60-90%. The most peripheral 90–100% collisions were excluded because of uncertainties regarding the event composition and their reconstruction e
fficiency.
An estimate of
hTPbifor each of the centrality intervals used in this analysis is based on the
ΣEPbTdistribution reconstructed in the FCal; for a detailed description of the theoretical approach used in this analysis, see Ref. [37]. First, the contribution from nucleon-nucleon interactions was modelled using the response of the FCal for simulated
ppevents, generated using PYTHIA6 and PYTHIA8 [43] at
√s=5.02 TeV and boosted towards negative rapidity by 0.465. Second, the dependence of p+Pb colli-
sions on the number of participating nucleons (N
part) was estimated using two models: (i) the Glauber model [18] and (ii) the Glauber-Gribov approach in which the nucleon-nucleon (NN) cross section is allowed to fluctuate event-by-event [44, 45], with the relative fluctuations determined primarily by the parameter
Ω. In the Glauber-Gribov model, larger values of
Ωgive larger event-by-event fluctuations of the NN cross section, and di
fferent incorporations of existing data lead to estimates of
Ω =0.55 [44]
and
Ω =1.01 [45]. Using the distribution
P(Npart) provided by each of these geometrical models and the convolution properties of gamma distributions, the measured
ΣEPbTdistribution observed in data was re- produced well. This allowed the determination of
hNpartiand
hTPbiby applying the same
ΣEPbTselections to the model as in the data.
Based on the above analysis, the centrality parameters, including
hNpartiand
hTPbiwith correspond- ing systematic uncertainties, were calculated for all three geometrical models, for the same selections in
ΣETPb. The value of
hTPbiis directly related to
hNpartivia the relation
hNparti −1
= hTPbiσNN, with σ
NNtaken to be 70
±5 mb [37]. The obtained
hTPbivalues for the Glauber and Glauber-Gribov models in di
fferent centrality intervals are listed in Table 1. For central collisions, the
hTPbiuncertainties are dominated by the uncertainty in the Glauber model and its extensions and the uncertainty of the
ppcross section. For more peripheral collisions the uncertainty on the efficiency for inelastic events makes a sig- nificant contribution. Values of the
hTPbiratios in centrality intervals divided by the value in the 60-90%
centrality interval are given in Table 2.
5 Reconstruction of charged particle spectra
5.1 Track selection
Charged particle tracks are reconstructed in the ID using an algorithm optimized for
ppevents [34].
Tracks originating from the selected vertices are required to have a minimum
pT> 0.1 GeV and
|η|< 2.5.
Additional requirements on the number of hits in the ID subsystems improve the purity of the track
sample. All tracks are required to have at least one hit in the Pixel detector and a hit in the first Pixel
layer when one is expected by the tracking model. Tracks with
pT ≤0.2 GeV are required to have at least
Centrality Glauber Glauber-Gribov
Ω =0.55
Ω =1.01 60-90% 42.3
+−4.32.8+6.7%−10.2%
36.6
+−2.22.7+7.3%−6.1%
34.4
+−2.13.7+10.8%−6.1%
40-60% 91.5
+4.2−6.7+4.6%−7.4%
80.2
+4.6−3.3+5.7%−4.2%
75.9
+6.5−3.3+8.6%−4.3%
30-40% 125.6
+−4.53.3+2.6%−3.6%
116.7
+−3.23.8+3.2%−2.7%
113.1
+−3.36.6+5.9%−2.9%
20-30% 147.9
+−2.63.6+2.4%−1.8%
145.5
+−3.03.6+2.5%−2.1%
144.6
+−3.15.6+3.9%−2.2%
10-20% 172
+−37+4%−2%
181.9
+−3.14.4+2.4%−1.7%
186.8
+−2.95.0+2.7%−1.6%
5-10% 194
+−415+8%−2%
221.0
+−5.06.2+2.8%−2.3%
234.8
+−6.96.6+2.8%−2.9%
1-5% 215
+22−5 +10%−2%
263.7
+9.1−9.7+3.5%−3.7%
291.5
+7.9−22.7+2.7%−7.8%
0-1% 245.4
+−6.636.6+14.9%−2.7%
330
+−2315+5%−7%
377
+−6012+3%−16%
0-90% 106.3
+−2.74.4+4.2%−2.5%
107.3
+−2.63.9+3.7%−2.4%
109
+−24+4%−2%
Table 1: Mean values of
TPbin b
−1for all centrality bins, along with the corresponding total systematic uncertainty, described in the text below. The columns correspond to the Glauber model (left), Glauber- Gribov model with
Ω =0.55 (middle), and Glauber-Gribov model with
Ω =1.01 (right).
Centrality Glauber Glauber-Gribov
Ω =
0.55
Ω =1.01 40-60%
/60-90% 2.16
+−0.060.09+4%−3%
2.19
+−0.060.04+2.6%−2.7%
2.21
+−0.060.05+2.4%−2.8%
30-40%
/60-90% 2.97
+−0.130.22+7%−4%
3.19
+−0.130.13+4%−4%
3.29
+−0.160.12+4%−5%
20-30%
/60-90% 3.49
+−0.170.34+10%−5%
3.98
+−0.210.18+5%−5%
4.21
+−0.280.19+4%−7%
10-20%
/60-90% 4.06
+0.5−0.21+13%−5%
4.98
+0.25−0.31+5%−6%
5.43
+0.28−0.5 +5%−9%
5-10%
/60-90% 4.58
+−0.240.8 +16%−5%
6.05
+−0.50.33+5%−7%
6.8
+−0.80.4+6%−12%
1-5%
/60-90% 5.08
+−0.270.9 +18%−5%
7.2
+−0.60.4+6%−9%
8.5
+−1.40.5+6%−16%
0-1%
/60-90% 5.80
+−0.331.3 +23%−6%
9.0
+−1.10.5+6%−12%
11.0
+−2.60.6+5%−23%
Table 2: Ratios of the mean values of
TPbfor all centrality bins, along with the corresponding total systematic uncertainty. The columns correspond to the Glauber model (left), Glauber-Gribov model with
Ω =0.55 (middle), and Glauber-Gribov model with
Ω =1.01 (right).
2 hits in the SCT, tracks with 0.2 <
pT≤0.3 GeV at least 4 hits, and tracks with larger
pTat least 6 hits.
To ensure that the tracks originate from the event vertex, the transverse (d
0) and longitudinal (z
0sin θ) impact parameters are required to be less than 1.5 mm. Tracks selected for the analysis are required to satisfy the conditions on the significances:
|d0/σ
d0|< 3 and
|z0sin θ/σ
z0sinθ|< 3. The quantities σ
d0and σ
z0sinθare the uncertainties on the determination of
d0and
z0sin θ obtained from the covariance matrix provided by the ATLAS track model.
The criteria above are complete for
p+Pb collisions. In ppcollisions, tracks originating from all reconstructed vertices were used to construct the cross section, no correction is thus needed for pileup.
The track to vertex connection is established using the track
z0parameter and the
zcoordinate of the vertex. Vertices in
ppare generally less precisely defined than in
p+Pb due to the smaller numberof tracks contributing to them. The track selection cuts related to the vertex were relaxed for vertices with fewer tracks: the requirement on the
z0sin θ parameter condition was increased to 2.5 mm and the selection criteria based on the transverse and longitudinal significances were increased to be less than 4.
The momentum 3-vector of each track is used to calculate the rapidity for each particle, assuming all
particles have the pion mass (m
π). This variable is called y
π. This note presents results both as a function of pseudorapidity and a function of y
?, the rapidity in the centre-of-mass system. This is needed since the
ppreference data has no boost relative to the lab frame. Transforming the laboratory system to the
p+Pb centre-of-mass system for a particle of any mass (m) is defined asy
? =y
−y
CM =y
+0.465, and for the particle assuming pion mass as y
?π =y
π+0.465. No boost is required in
pp, where the data wastaken in the centre-of-mass system, so y
?=y (y
?π =y
π) for the
ppdata.
5.2 Reconstruction of the invariant particle distributions
Fully-corrected per-event
p+Pb charged particle multiplicity, measured differentially as a function ofpTand η or y
?, referred to as the di
fferential invariant yield, are constructed using the following formulae:
1 2πp
TdN
chdp
Tdη =1 2πp
TNevt∆η
Nch
(
pT, η)
∆pT
P(pT
, η)
trk(p
T, η) and (3)
1 2πp
TdN
chdp
Tdy? =1 2πp
TNevt∆y
?πNch
(
pT, y
?π)
∆pT
P(pT
, y
?π)A(p
T, y
?π)
trk(p
T, y
?π) . (4)
In these expressions,
∆pT,
∆η and
∆y
?πare the widths of the transverse momentum, pseudorapidity and rapidity intervals being studied, and
Nevtis the number of events in the analysed centrality interval. The correction factors
trk,
P, andAare used to account for track e
fficiency, track purity, and to transform the distributions from y
πto hadron rapidity. For the
ppdata at each measured energy the corrections are applied analogously to derive the inclusive charged-particle cross sections in the same y
?intervals as for
p+
Pb.
The efficiency,
trkfor track reconstruction is defined as:
trk(
pT, η)
= NPrimaryRec(
pRecT, η)
NGen
(
pGenT, η) ;
trk(p
T, y
?π)
= NPrimaryRec(
pRecT, y
?π)
NGen
(
pGenT, y
?π) . (5) where “Gen” indicates the number of generated particles in a chosen
pTinterval, and “Rec” indicates the number of reconstructed tracks that match to a generated particle, both at their corresponding transverse momentum
pT. “Primary” refers to charged particles which originate directly from the collision or result from decays of particles with
cτ <10 mm. The algorithm to match reconstructed tracks to generated particles is discussed further in Ref. [46]. These e
fficiencies are calculated using Monte Carlo events generated with the HIJING event generator and events generated with PYTHIA6 for
p+Pb and for theppanalysis respectively. The e
fficiencies were calculated after reweighting the generated spectra which was done to achieve a better agreement in the transverse momentum distribution between data and simulation.
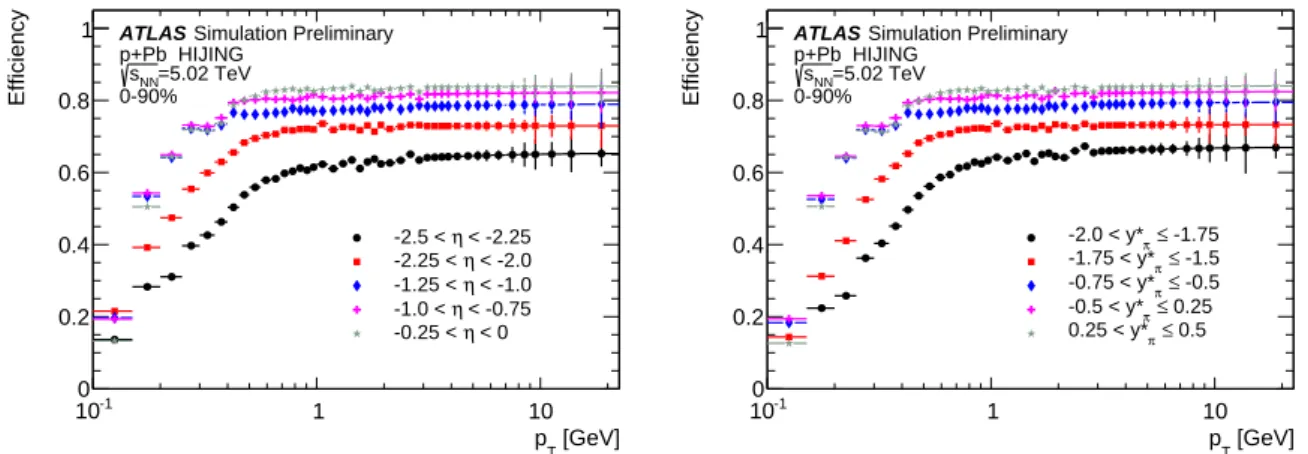
Figure 1 shows a subset of the tracking efficiencies used for correcting the track distributions, for the 0-90% centrality interval and for a set of subranges in η (in the left panel) and y
?π(in the right panel).
Due to the limited size of the MC sample available for the pilot run data, the e
fficiencies shown in Fig. 1 are smoothed with the functional form (p
T)
= 0−α/p
Tfor
pT> 3 GeV. The uncertainty associated with this smoothing procedure is added in quadrature to the other uncertainties.
The e
fficiencies shown in the figure have a very weak centrality dependence in
p+Pb. The maximum
variation from peripheral to central intervals does not exceed 2% over the range of measured centralities
at any
pTand η. As a function of pseudorapidity, the efficiency is generally higher in the centre of the
detector, reaching above 80% at high
pTfor η
=0, and decreasing toward the edges of the detector
to approximately 60%. The shape of the curves shown in Fig. 1 is similar as a function of both η
and y
?π. The efficiency is smaller at low
pT, starting at around 20% in the lowest measured interval of
0.1 <
pT< 0.2 GeV, and then increases rapidly, reaching its plateau value at approximately 1 GeV.
[GeV]
pT
10-1 1 10
Efficiency
0 0.2 0.4 0.6 0.8
1 ATLAS Simulation Preliminary p+Pb HIJING
=5.02 TeV sNN
0-90%
< -2.25 η -2.5 <
< -2.0 η -2.25 <
< -1.0 η -1.25 <
< -0.75 η -1.0 <
< 0 η -0.25 <
[GeV]
pT
10-1 1 10
Efficiency
0 0.2 0.4 0.6 0.8
1 ATLAS Simulation Preliminary p+Pb HIJING
=5.02 TeV sNN
0-90%
-1.75
π≤ -2.0 < y*
-1.5
π≤ -1.75 < y*
-0.5
π≤ -0.75 < y*
0.25
π≤ -0.5 < y*
≤ 0.5 0.25 < y*π
Figure 1: The
pTdependence of track reconstruction e
fficiency for several pseudorapidy ranges (left) and for several rapidity ranges (right).
The correction factors to remove the contributions from fake and residual secondary tracks are given by:
P(pT
, η)
= NPrimaryRec(
pT, η)
NRec
(p
T, η) and
P(pT, y
?π)
= NPrimaryRec(
pT, y
?π)
NRec
(p
T, y
?π) (6) which is the ratio of the number of reconstructed tracks associated to primary charged particles
NPrimaryRec, to that of all reconstructed tracks
NRec. This correction is applied differentially as a function of η (y
?π) and centrality interval and has a strong dependence on both variables for low
pT. In the most central
p+Pbcollisions at the edges of the measured η interval the fraction of primary particles decreases to 80% for reconstructed tracks with
pT< 0.15 GeV. However, for
pT> 1 GeV, the fraction of primary particles rises above 98% for all η and centrality.
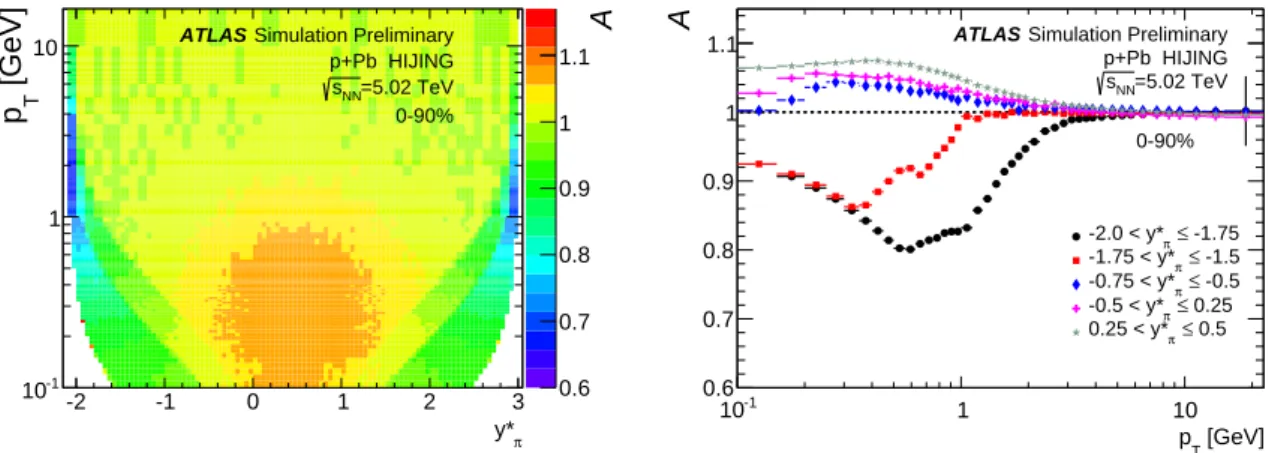
Since not all particles are pions, a correction is applied to recover the rapidity distribution of all hadrons, as if the correct hadron mass was used in the calculated rapidities:
A
(
pT, y
?π)
= NGen(m,
pT, y
?)
NGen(m
π,
pT, y
?π)
y
?=y
?π. (7)
The correction is shown in Fig. 2 for
p+Pb as a two-dimensional distribution (left) and as a
pTdependent correction function in selected intervals in y
?π. The correction is smaller than 1.1 at y
?π=0 and decreasesto unity with increasing
pT. At the edges of acceptance it is approximately 0.8 for particles with
pT ≈0.7 GeV. The correction has the geometrical boundary at low
pTthat corresponds to the acceptance of pions in the ATLAS ID. For the results presented as a function of the y
?variable, a selection of
pT> 0.5 GeV is used for y
?π<
−1.4 andy
?π> 2.3 in
p+Pb and for|y?π|> 2.0 in
ppcollisions. The systematic uncertainties on this correction are discussed in Section 7.
6 Reference spectra from pp collisions
Figure 3 shows the fully corrected charged particle cross section as a function of
pTin four rapidity windows, the left panel shows the results extracted from 2.76 TeV
ppcollisions and the right panel shows the corresponding spectra at 7 TeV.
Once the differential cross sections at 2.76 and 7 TeV are measured, the charged particle cross section at
√s=5.02 TeV is obtained by interpolation. Two interpolations are performed for everypT
bin in each
A
0.6 0.7 0.8 0.9 1 1.1
y*π
-2 -1 0 1 2 3
[GeV] Tp
10-1
1
10 ATLAS Simulation Preliminary p+Pb HIJING
=5.02 TeV sNN
0-90%
[GeV]
pT
10-1 1 10
A
0.6 0.7 0.8 0.9 1
1.1 ATLAS Simulation Preliminary p+Pb HIJING
=5.02 TeV sNN
0-90%
-1.75
π≤ -2.0 < y*
-1.5
π≤ -1.75 < y*
-0.5
π≤ -0.75 < y*
0.25
π≤ -0.5 < y*
≤ 0.5 0.25 < y*π
Figure 2: (left)
A(pT,y
?) as a function of
pTand y
?πfor the
p+Pb MC sample. (right)
A(pT, y
?) for several y
?πintervals and 0-90% centrality interval.
[GeV]
pT
10-1 1 10
]-2 ) [mb/GeV T/(dy* dpσ2 ) d T pπ1/(2
10-9
10-7
10-5
10-3
10-1
10 103
Preliminary ATLAS
=202 nb-1
p+p 2011 Lint
=2.76 TeV s
2.5
≤ 2 < y*
10-1
×
≤ 2) (1 < y*
10-2
×
≤ 0) (-1 < y*
10-3
× -2)
≤ (-2.5 < y*
[GeV]
pT
10-1 1 10
]-2 ) [mb/GeV T/(dy* dpσ2 ) d T pπ1/(2
10-9
10-7
10-5
10-3
10-1
10 103
Preliminary ATLAS
b-1
µ
=188 p+p 2010 Lint
=7 TeV s
2.5
≤ 2 < y*
10-1
×
≤ 2) (1 < y*
10-2
×
≤ 0) (-1 < y*
10-3
× -2)
≤ (-2.5 < y*
Figure 3: Fully-corrected invariant cross sections extracted in four y
?intervals for
ppcollisions at two different energies. (left) Invariant cross sections extracted from
ppcollisions at 2.76 TeV, and (right) invariant cross sections from
ppcollisions at 7 TeV. The cross sections at the highest rapidities are only measured for
pT> 0.5 GeV. Systematic uncertainties are indicated by boxes, but are generally much smaller than the size of the symbols. To separate the curves, the distributions are scaled by powers of ten.
rapidity interval used in the
p+Pb analysis. The first interpolation is proportional to
√s, and the second to
ln(
√s). Possible distortions introduced by the interpolation algorithm are studied with MC simulations
based on PYTHIA8 (with tune 4C) at the three centre-of-mass energies,
√s=
2.76, 5.02 and 7 TeV.
Charged particle cross sections obtained by the two interpolation methods are compared to the generated cross section at
√s=5.02 TeV at each pT
and y
?value. The ratio of the generated cross section to the interpolated one is taken as a multiplicative factor for each interpolation. The ln(
√s)-based interpolation
is used in the analysis mainly due to its consistency with the behavior of
pptotal cross sections at high energy [47].
Figure 4 summarizes the results of interpolation for the acceptance (−2 < y
?< 2.5) in
pprapidity.
The square markers show the ratio of the input cross section at
√s=2.76 TeV divided by the interpolated
cross section at
√s=5.02 TeV using ln(√
s). Circles show the same ratio but with the √
s=7 TeV cross
section in the numerator. The diamond markers show the comparison between the interpolation that uses
√s
as ordinate divided by that using ln(
√s). This difference is included in the systematic uncertainties
on the cross section interpolation.
[GeV]
pT
10-1 1 10
Ratio
0 0.2 0.4 0.6 0.8 1 1.2 1.4 1.6 1.8 2
Preliminary ATLAS
p+p -2<y*<2.5 )
s 7 TeV / 5.02 TeV (ln
) s 2.76 TeV / 5.02 TeV (ln
) s ) / 5.02 TeV (ln s
5.02 TeV (
Figure 4: Ratios of the input invariant cross section to the interpolated cross section at
√s=
5.02 TeV.
The input spectrum measured at
√s=
7 TeV is shown with circles and the one at
√s=
2.76 TeV is shown with squares. The error bars reflect the statistical uncertainties of the input spectra. The comparison between interpolation using
√s
and ln(
√s)is shown with diamond markers. The grey band shows the
overall systematic uncertainty assigned to the generation of the
ppspectra. All three ratios were extracted within the full acceptance of the ID detector.
7 Systematic uncertainties
The systematic uncertainties on the measurement of invariant charged particle yield arise from inaccu-
racies of the detector description in the simulation, sensitivity to selection criteria used in the analysis
and differences between the generated particles used in the simulation and in the data. To extract uncer-
tainties for each source, each one of the parameters used in the analysis, such as track selection criteria,
simulated particle composition, etc. was altered within reasonable limits.
The uncertainty on the detector description arises from the details of the Pixel and SCT detector acceptances and e
fficiencies. The locations of the inactive modules were matched between the data and simulation. The track selection cuts on the number of hits in the detectors and on the
d0, given in Section 5.1, were varied and the results compared to standard cuts. This results in an approximately 1%
variation of the track reconstruction e
fficiency. The uncertainties related to the description of the inactive detector material were evaluated using a
p+Pb MC sample with 10% extra material. The changes to thefinal result are found to vary between 1-7% depending primarily on η. The systematic error estimated this way is applied identically to
ppand
p+Pb.
The HIJING event generator used in the analysis is known to be inconsistent with the
pTdistributions measured in data, and PYTHIA does not perfectly describe the measured distributions in
pTand η. This was addressed by reweighting the HIJING and PYTHA distributions using the reconstructed spectra.
Reweighting was performed independently in centrality and η intervals. The systematic uncertainty was assigned to be 1%, equal to the full magnitude of the correction derived from this procedure.
To assess the sensitivity to the particle composition in HIJING, the fraction of pions, kaons and protons in HIJING were varied within a range according to the di
fferences between
ppand Pb
+Pb measured by the CMS and ALICE experiments [29, 30]. The change in the particle yields are found to be 1% at high
pTto 6% at the low edge of the
pTmeasured interval. This limited knowledge of the particle composition in
p+Pb collisions is also the dominant source of the systematic uncertainty of the η
→y
?transformation for the invariant yields and ratios presented in the note. Variation of the particle species results in an 8% di
fference at the edges of the measured y
?interval at low
pT. This uncertainty was found to be correlated with the uncertainty on the e
fficiency, which was taken into account in the results.
The uncertainty associated with the trigger e
fficiency and residual di
ffractive contribution in the
p+Pb event sample a
ffects the
ΣEPbTcuts which define centrality intervals in the analysis. The centrality intervals were redefined assuming 96% or 100% total event selection efficiency and the change in the multiplicity spectrum reconstructed in each centrality interval was taken as a systematic uncertainty associated with the centrality determination. The uncertainties associated with
hTPbicontain the e
ffects of the trigger, vertex and inelastic event selection criteria.
The trigger and vertex reconstruction e
fficiency in
ppcollisions has been estimated in [34]. The systematic uncertainty assigned to the trigger e
fficiency is 1% for events with two tracks and decreases rapidly with higher track multiplicities, and a conservative average uncertainty of 0.5% is assigned. The uncertainty in the vertex reconstruction efficiency is taken to be 1%, which is the upper bound of the results presented in [34].
The systematic uncertainty on the invariant cross sections extracted for
ppat
√s=5.02 TeV due to
the interpolation was obtained by considering the relative difference between spectra obtained using the two di
fferent interpolation schemes (
√s
or ln(
√s)). An additional systematic uncertainty is assigned to
account for the use of the PYTHIA prediction for the change in spectra shapes between the interpolated values. The uncertainty was evaluated from the changes in shape predicted by the interpolation based on
√s
rather than ln(
√ s).The uncertainty on the luminosity for the 7 TeV
ppdata has been estimated to be 1.8% [48], and that corresponding to the 2.76 TeV
ppdata has been estimated to be 2.7% [49]. The uncertainty on the normalization of interpolated spectra is obtained by adding in quadrature the luminosity uncertainties of the inputs. The uncertainty on the
p+Pb luminosity is not needed since the results are presented in termsof per-event invariant yields.
A summary of the systematic uncertainties on the charged particle yields in
p+Pb and
ppcollisions
is shown in Table. 3. For the nuclear modification factors, some of the errors are correlated between
numerator and denominator. Many uncertainties cancel for
RCP, since the corrections do not vary with
centrality interval and the yields are compared in the same
pTand η bins. However, for
RpPb, there is
Uncertainty
p+Pb ppVariation
Track selection 1% 1% decreases with
pT, increases with
|η|Particle composition 1-6% 2% changes with
pTMaterial budget 1-7% decreases with
pT, increases with
|η|pT
reweighting 1% flat in
pTand η
Rapidity transformation 0-8% decreases with
pTCentrality selection 1-6% – flat in
pTand η, increases with centrality
Trigger Efficiency – 0.5%
Luminosity – 2.7% (2%)
√s=2.76 TeV (7 TeV)
√s
interpolation – 3-9% increases with
pTand flat in η
Vertex reconstruction – 1%
Table 3: Systematic uncertainties on charged particle yields for
p+Pb and
ppat
√sNN=
5.02 TeV. The uncertainty in the luminosity does not contribute to the
p+Pb results, since they are expressed as per-event invariant yields. The uncertainty on the trigger and event selection is expressed in the uncertainty on the e
fficiency for selecting inelastic events, and thus is already contained in the uncertainties on
hTPbi.little cancellation between
p+Pb and
pp, since they
?variable does not respect the detector boundaries, especially given that the two systems are in two different centre-of-mass frames. The systematic uncer- tainties on
hTPbiand their ratios given in Tables 1 and 2 are added in quadrature to the experimental uncertainties of
RpPband
RCPrespectively. In some figures these are shown separately as an overall scale uncertainty, as explained in the figure captions.
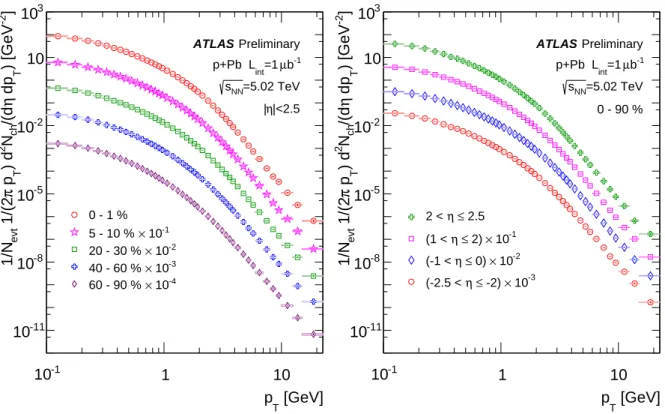
8 Results
The differential invariant yields of charged particles measured in
p+Pb collisions at √s=5.02 TeV are
shown in Fig. 5. The left panel shows
pTspectra integrated over the largest available pseudorapidity interval
|η|< 2.5 in five selected centrality intervals. The right panel shows the spectra in the 0-90%
centrality interval for several η intervals.
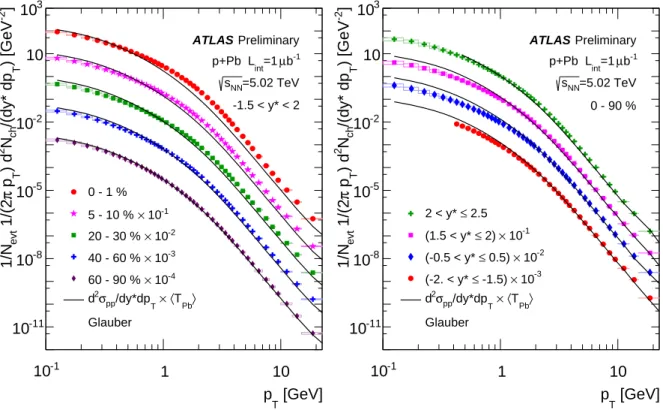
The left panel of Fig. 6 shows the invariant charged particle yield as a function of
pTintegrated over the interval
−1.5< y
?< 2 in several centrality intervals. The right panel shows the invariant yields measured for several y
?intervals in the 0-90% centrality interval. The solid lines indicate the
ppinvariant cross section measured as a function of
pTin y
?intervals corresponding to the same range as y
?of the
p+Pb distributions. The
ppdata is scaled by the
hTPbivalues based on the Glauber calculation given in Table 1. The low
pTcuto
ffs for the distributions in the right panel of Fig. 6 are di
fferent for
ppand
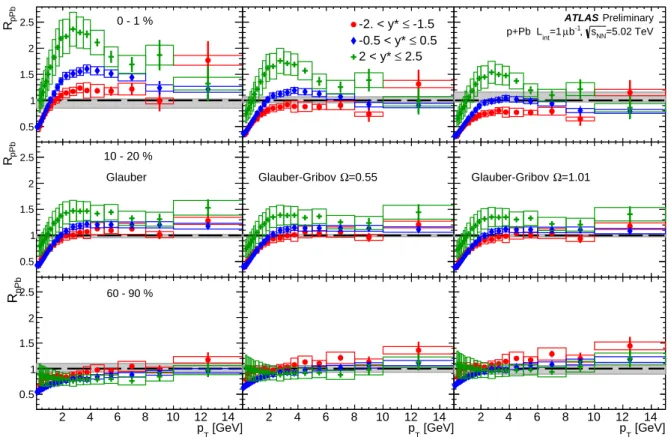
p+Pb.The nuclear modification factors
RpPband
RCPare shown in Figure 7, in the upper and lower panels, respectively, as a function of the charged-particle transverse momentum. The nuclear modification fac- tors are calculated assuming three different geometrical models: Glauber (left), Glauber-Gribov
Ω =0.55 (middle) and
Ω =1.01 (right). The data are integrated over
−1.5< y
?< 2 for
RpPband
|η|< 2.5 for
RCP. The circles indicate the most central 0-1% collisions. The other set of data points in each panel correspond to the most peripheral interval measured in the analysis, other than the reference itself. For
RpPbit is the 60-90% centrality interval, while for
RCP, where the 60-90% interval is used in the reference sample, it corresponds to the 40-60% centrality interval.
The data from the 0-1% centrality interval show similar features in all panels. Both
RpPband
RCPincrease with transverse momentum, reaching a maximum at approximately
pT ∼3 GeV, and then
decrease until reaching
pT ∼8 GeV. Above this value, the ratios are approximately constant, within the
[GeV]
pT
10-1 1 10
]-2 ) [GeV T dpη/(dchN2 ) d T pπ 1/(2evt1/N
10-11
10-8
10-5
10-2
10 103
Preliminary ATLAS
b-1
µ
int=1 p+Pb L
=5.02 TeV sNN
|<2.5 η
|
0 - 1 % 10-1
× 5 - 10 %
10-2
× 20 - 30 %
10-3
× 40 - 60 %
10-4
× 60 - 90 %
[GeV]
pT
10-1 1 10
]-2 ) [GeV T dpη/(dchN2 ) d T pπ 1/(2evt1/N
10-11
10-8
10-5
10-2
10 103
Preliminary ATLAS
b-1
µ
int=1 p+Pb L
=5.02 TeV sNN
0 - 90 %
2.5
≤ η 2 <
10-1
×
≤ 2) η (1 <
10-2
×
≤ 0) η (-1 <
10-3
× -2)
≤ η (-2.5 <
Figure 5: (left) Invariant di
fferential spectra of charged particles produced in
p+Pb collisions at
√s=5.02 TeV shown in five centrality intervals averaged over |η|