ATLAS-CONF-2012-117 14August2012
ATLAS NOTE
ATLAS-CONF-2012-117
August 10, 2012
Measurement of the centrality and pseudorapidity dependence of the integrated elliptic flow in lead-lead collisions at √
s
NN= 2.76 TeV with the ATLAS detector
The ATLAS Collaboration
Abstract
The elliptic flow of charged particles integrated over their transverse momenta has been measured in Pb
+Pb collisions at
√sNN =
2.76 TeV with the ATLAS detector at the LHC.
The anisotropy parameter,
v2, has been determined using the event plane method in the pseu- dorapidity range
|η| ≤2.5. A special track reconstruction method was applied in the analysis of data taken in 2010 without a magnetic field in order to explore the range of very low transverse momentum,
pT, thus reducing the uncertainty in the
v2integrated over
pT. Other track reconstruction methods have been used for consistency checks and to provide measure- ments directly comparable to previously published results. The centrality dependence of the integrated
v2, spanning the range of 0–80% of most central Pb+Pb collisions, is compared to other LHC measurements obtained with a higher
pTthreshold. A weak pseudorapid- ity dependence of the integrated elliptic flow is observed for central collisions, and a small decrease when moving away from mid-rapidity can be seen only in peripheral collisions.
The energy dependence of
v2in the rest frame of one of the colliding nuclei is discussed in comparison to the lower energy RHIC data.
c
Copyright 2012 CERN for the benefit of the ATLAS Collaboration.
Reproduction of this article or parts of it is allowed as specified in the CC-BY-3.0 license.
1 Introduction
The collective flow of particles produced in heavy-ion collisions, which manifests itself in a significant anisotropy in the plane perpendicular to the beam direction, has been extensively studied due to its sensitivity to the early system properties and its subsequent dynamical evolution [1]. The final-state anisotropy arises due to the initial spatial asymmetry of the overlap zone in the collision of two nuclei with non-zero impact parameter. The initial spatial asymmetry is converted into a final state momentum anisotropy via multiple rescattering processes. The final-state anisotropy is customarily characterized by coe
fficients,
vn, of the Fourier decomposition of the azimuthal angle distribution of produced particles [2, 3]. The second Fourier coe
fficient,
v2, is called elliptic flow and is related to the elliptical shape of the overlap region in non-central heavy-ion collisions while the higher flow harmonics reflect fluctuations in the initial collision geometry and, in addition, may provide information on the ratio of shear viscosity to the entropy density [4].
A large azimuthal anisotropy has been measured at RHIC ([5–8]) and found to be well described by hydrodynamics inspired models [9–11], providing compelling evidence that the created matter is strongly coupled and behaves like an almost perfect, non-viscous fluid. First results from Pb
+Pb collisions at
√
s
NN =2.76 TeV [12–17] from the Large Hadron Collider (LHC) showed no change in the transverse momentum dependence of the elliptic flow as compared to that measured at the highest RHIC energy, while the elliptic flow integrated over transverse momentum [12, 16] was found to increase about 30%
from RHIC energy of
√s
NN =200 GeV to
√s
NN =2.76 TeV at LHC. This increase with energy of the integrated elliptic flow is, thus, mostly driven by the increase in the mean transverse momentum of the particles produced.
In this letter we report on the measurements of the centrality and pseudorapidity dependence of the elliptic flow integrated over transverse momenta of charged particles in Pb
+Pb collisions at
√s
NN=2.76 TeV obtained with the ATLAS detector. For this analysis the data recorded in the 2010 heavy-ion run were used and a special track reconstruction procedure has been applied to a data sample without solenoid magnetic field (field-off) in order to reach transverse momentum, p
T, lower than in the measurements reported by the ALICE [12] and CMS [16] experiments. This allows for a significant reduction of the uncertainty in the extrapolation of the measurements down to p
T =0. Other track reconstruction methods, applicable at higher p
T, have been also exploited as cross-checks.
2 The ATLAS detector
The measurements reported here make use of the ATLAS inner detector, forward calorimeters, trigger and data acquisition systems [18]. The inner detector has a complete azimuthal coverage and spans the pseudorapidity region up to
|η| =2.5
1. The inner detector Silicon tracker, used in this analysis for track reconstruction, consists of layers of pixel and microstrip detectors immersed in a 2 T uniform magnetic field. The forward calorimeters (FCal) provide both electromagnetic and hadronic energy measurements using copper-tungsten
/liquid argon technology and feature also a complete coverage in azimuth for 3.2
<|η|<
4.9. A hardware-based Level 1 trigger system was used to record minimum bias Pb+Pb collisions.
The coincidences of signals recorded in the zero-degree calorimeters (ZDC), located symmetrically at z
=±140 m (|η|>8.3), and in the minimum-bias trigger scintillator (MBTS, at z
= ±3.6 m, 2.1<|η|<3.9) were required for the online event selection. With these trigger conditions ATLAS recorded samples of Pb
+Pb collisions corresponding to an integrated luminosity of approximately 8
µb−1taken with the
1ATLAS uses a right-handed coordinate system with its origin at the nominal interaction point (IP) in the centre of the detector and thez-axis along the beam pipe. Thex-axis points from the IP to the centre of the LHC ring, and theyaxis points upward. Cylindrical coordinates (r, φ) are used in the transverse plane,φbeing the azimuthal angle around the beam pipe. The pseudorapidity is defined in terms of the polar angleθasη=−ln tan(θ/2).
solenoid field turned on and of approximately 1
µb−1of field-off data.
3 Event selection and centrality definition
In the offline event selection, the recorded collisions were required to have a primary vertex reconstructed from charged particle tracks reconstructed in the inner detector. The time di
fference between MBTS counters located on the opposite sides of the interaction region were required to be less than 3 ns. These additional selection criteria efficiently remove beam-gas and photo-nuclear interactions. As shown in previous studies [14], the applied trigger and o
ffline requirements provide a minimum-bias event sample with sampling fraction of inelastic Pb
+Pb collisions of 98
±2%. Events satisfying the above conditions were also required to have a reconstructed primary vertex within 50 mm (100 mm) of the nominal center of the ATLAS detector for the field-o
ff(field-on) data samples. A subsample of approximately 1.6 (3) millions of minimum-bias events, passing all selections, was used in the analysis.
Monte Carlo (MC) samples were used in the analysis to determine tracking efficiencies and rates of background tracks. The HIJING event generator [19] was used to produce minimum-bias Pb
+Pb collisions. Events were generated with the default parameters except for jet quenching, which was turned off. The effects of elliptic flow were implemented after event generation by redistributing the azimuthal angles of particles at generator level, to give elliptic flow consistent with previous ATLAS measurements [14, 15]. The detector response to the generated events was simulated using the Geant4 package [20]
which included a detailed description of the geometry and the material of the detector corresponding to the conditions of the 2010 Pb
+Pb run. Two MC samples, each of 50000 events, simulated with the solenoid field switched o
ffand switched on were used. For the study of systematic uncertainties, additional MC samples, one of 50000 events simulated with the addition of extra material and one of 250000 of events with the flow signal not adjusted to the previous ATLAS measurements, were also used.
The centrality of Pb+Pb collisions is measured by the summed transverse energy,
ΣE
FCalT, in the ATLAS forward calorimeters, FCal (for more details see [14]). The
ΣE
TFCaldistribution is divided into 10 centrality bins, each representing 10% of the full distribution after accounting for 2% ine
fficiency in recording most peripheral collisions (the centrality interval 0–10% corresponds to the 10% of most central events, those with the largest
ΣE
FCalT). The 20% of events with the smallest
ΣE
TFCalare not included in this analysis, due to ine
fficiencies of the event selection criteria.
4 Track reconstruction
The silicon tracking detector consisting of pixel detectors and a semiconductor microstrip tracker (SCT) was used to reconstruct charged particle trajectories (see Section 2). Three track reconstruction methods are applied in order to exploit a large range in particle transverse momenta. For the data with the solenoid field turned on, the pixel track method with p
T≥0.1 GeV and the ID track method with p
T≥0.5 GeV were used. The tracklet reconstruction method applied in the field-off data allows probing distributions of charged particles with p
Tbelow 0.1GeV.
In the tracklet method [21], tracks are formed from hits in the first two layers of the pixel detector
and are correlated with the reconstructed collision vertex. In the first step, the
η0and
φ0coordinates are
defined using the event vertex position and the hit recorded in the first pixel layer. Then a search for
a hit in the second pixel layer (with
η1and
φ1coordinates defined with respect to the vertex position)
is performed and its consistency with a straight track hypothesis is checked. Candidate tracklets were
-2 -1 0 1 2
0.2 0.4 0.6 0.8 1 1.2
1.4 0-10%
-2 -1 0 1 2
0.2 0.4 0.6 0.8 1 1.2
1.4 40-50%
primary reco
/ N
N
-2 -1 0 1 2 η
0.2 0.4 0.6 0.8 1 1.2
1.4 70-80%
primary matched / N
N / Nreco
Nfake
[GeV]
T p
10-1 1
[a.u.] T/dpchdN 1
102
104
106 0-10%
ATLAS Simulation Preliminary
=2.76 TeV sNN
Pb+Pb
|<1 Solenoid-off η
|
[GeV]
pT
10-1 1
ratio 0.5 1
[GeV]
T p
10-1 1
[a.u.] T/dpchdN
1 10 102
103
104
105 40-50%
[GeV]
pT
10-1 1
ratio 0.5 1
[GeV]
T p
10-1 1
[a.u.] T/dp chdN 1
10 102
103
104 70-80%
primary
N
matched
N
[GeV]
pT
10-1 1
ratio 0.5 1
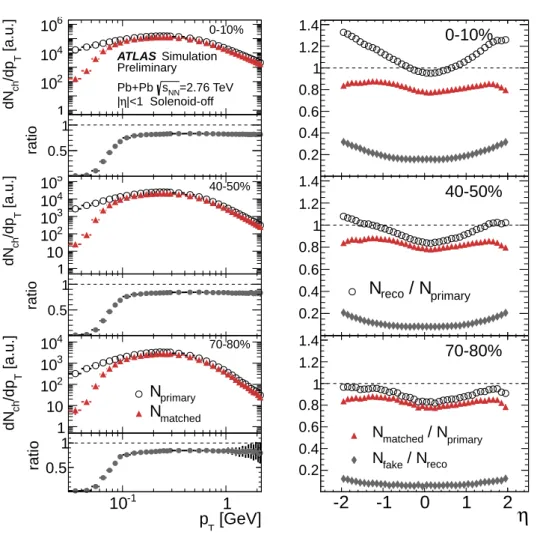
Figure 1: MC evaluation of the tracklet reconstruction performance in representative centrality bins 0–10%, 40–50% and 70–80%. (left) Truth level transverse momentum, p
T, distributions of primary charged particles, N
primary(open circles), compared to the p
Tspectra of charged particles matched to the reconstructed tracklets, N
matched(red triangles). Bottom panels show the ratios of the two distributions.
(right) Pseudorapidity,
η, dependence of the ratio of all reconstructed tracklets,N
reco(open circles), and N
matched(red triangles) to all primary charged paricles. Also the ratio of background tracklets, N
fake(gray diamonds), to all reconstructed tracklets is shown.
required to satisfy the condition
∆
R
=1
√
2
s ∆η ση
(η
0)
!2
+ ∆φ
σφ
(η
0))
!2
<
N
σ,(1)
where
∆η = η1−η0and
∆φ = φ1−φ0, and
ση(η
0),
σφ(η
0) are pseudorapidity-dependent widths of the
∆η
and
∆φdistributions. In this analysis N
σ =3 is used. Candidates fulfilling the criterion in Eq. (1)
are accepted for further analysis with
η=η0and
φ= φ0. This method does not provide information on
the track p
T, but the performance as a function of p
Tcan be checked applying the same reconstruction
procedure to the MC simulation. This is illustrated in Fig. 1, which shows the transverse momentum
spectra of stable charged particles at the MC generator level, N
primary, compared to the spectra of the re-
constructed tracklets matched to charged particles, N
matched, for three representative centrality bins. The
matching criterion required that the two hits forming the tracklet are identical to the hits associated with
a charged particle. The distributions show that the tracklet method is able to reconstruct particles with transverse momenta as low as 0.03 GeV. The e
fficiency for the tracklet reconstruction reaches a plateau at about 80% for p
T >0.1 GeV for all centrality bins. For lower transverse momenta the efficiency decreases sharply, but in this region the particle density is small, so its contribution to the integrated flow is expected to be small. Figure 1 also shows the reconstruction e
fficiency, N
matched/Nprimary, as a func- tion of
η. Here theN
primarydenotes all primary charged particles with p
Tbigger than 0.03 GeV and this defines the low p
Tintegration limit of
v2. The efficiency is
∼80% and depends weakly onη. The rate ofbackground tracklets, measured as the ratio of the number of tracklets not matched to charged particles to all reconstructed tracklets, N
fake/Nreco, increases with centrality and
|η|, reaching about 35% for the most central collisions at
|η| =2 and higher values for
|η| >2. Due to this large fake rate, the tracklet analysis was restricted to
|η| <2. For this evaluation, the MC p
Tspectra were reweighted to match the experimental p
Tspectrum, with a procedure similar to that described in [21].
For field-on data, the pixel track method allows probing the transverse momentum range p
T >0.1 GeV. A pixel track is a track reconstructed using only hits from the pixel detector. Tracks were reconstructed within the full acceptance of the pixel detector (|η|
<2.5). To improve the performance of the track reconstruction in the environment of heavy ion collisions, the track quality requirements are more stringent than those for proton-proton collisions. Pixel tracks are required to have no missing hits in the pixel layers and the transverse, d
0, and longitudinal, z
0sin
θ, impact parameters with respect to thevertex should each have significance (|d
0|/σd0and
|z0sin
θ/σz0sinθ|) less than 3.[GeV]
pT
10-1 1
efficiency
0.2 0.4 0.6 0.8
1ATLAS Simulation 0-10%
Preliminary
=2.76TeV sNN
Pb+Pb
[GeV]
pT
10-1 1
efficiency
0.2 0.4 0.6 0.8
1 40-50%
[GeV]
pT
10-1 1
efficiency
0.2 0.4 0.6 0.8
1 70-80%
[GeV]
pT
10-1 1
fake rate
0.2 0.4 0.6 0.8
1 Pixel tracks 0-10%0-10%
|<1.0 η 0<|
|<2.0 η 1<|
|<2.5 η 2<|
[GeV]
pT
10-1 1
fake rate
0.1 0.2 0.3 0.4
0.5 40-50%40-50%
[GeV]
pT
10-1 1
fake rate
0.05 0.1 0.15 0.2
0.25 70-80%70-80%
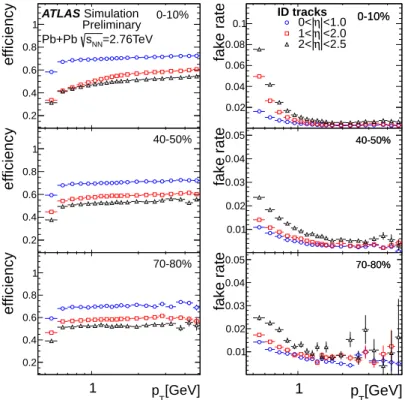
Figure 2: MC evaluation of pixel track reconstruction performance in three centrality bins as denoted in the figure. The transverse momentum, p
T, dependence of the pixel track reconstruction efficiency (left) and the fake rate (right) as a function of p
Tfor three pseudorapidity ranges as explained in the legend.
The pixel track e
fficiency is evaluated from MC simulations with the reweighted p
Tspectra by match-
ing reconstructed tracks to the generated charged particles. The matching criterion was that the fractions
of common pixel hits for the generated charged particle track and the reconstructed pixel track to be
greater than 0.59, which translates to
≥2 out of 3 hits in common, for the barrel part. Figure 2 illustratesthe dependence of the pixel track e
fficiency on p
Tin three pseudorapidity ranges and for three selected centrality bins. The efficiency slightly decreases from peripheral to central collisions and also deterio- rates when moving away from mid-rapidity. A weak p
Tdependence is observed above p
T >0.5 GeV for all collision centralities. At lower p
Tthe e
fficiency decreases with decreasing p
Tdown to 40% at the lowest accessible p
T.
The fraction of background tracks, defined as the ratio of reconstructed tracks not matched to gener- ated charged particles to all reconstructed pixel tracks is also evaluated using MC simulations. Figure 2 shows the fake rate dependence on p
Tin three pseudorapidity ranges and for three centrality bins. The fake rate is below 10% for p
Tabove 0.4 GeV and depends very weakly on p
Tand
ηfor peripheral col- lisions. With increasing collision centrality the fake rate increases both at low and high p
Tand shows a similar increase with
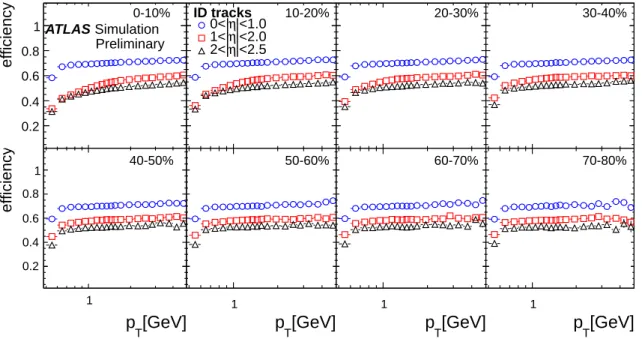
η.The performance of the pixel track reconstruction can be compared with that of tracks reconstructed using both the pixel and the SCT silicon tracking systems (ID tracks). The performance plots of the latter (for reconstruction details see [14]) are shown in Fig. 3. Comparison of Fig. 2 and 3 shows that for the full ID tracks, the fake fraction is significantly lower as compared to pixel tracks while the reconstruction e
fficiencies are similar. The minimum p
Treached is 0.5 GeV.
[GeV]
pT
1
efficiency
0.2 0.4 0.6 0.8 1
0-10%
Simulation ATLAS
Preliminary
=2.76TeV sNN
Pb+Pb
[GeV]
pT
1
efficiency
0.2 0.4 0.6 0.8
1 40-50%
[GeV]
pT
1
efficiency
0.2 0.4 0.6 0.8
1 70-80%
[GeV]
pT
1
fake rate
0.02 0.04 0.06 0.08
0.1 ID tracks 0-10%0-10%
|<1.0 η 0<|
|<2.0 η 1<|
|<2.5 η 2<|
[GeV]
pT
1
fake rate
0.01 0.02 0.03 0.04
0.05 40-50%40-50%
[GeV]
pT
1
fake rate
0.01 0.02 0.03 0.04
0.05 70-80%70-80%
Figure 3: MC evaluation of the ID track reconstruction performance in the selected centrality bins as
denoted in the figure. The p
Tdependence of the ID track reconstruction e
fficiency (left) and the fake rate
(right) as a function of p
Tfor three pseudorapidity ranges as explained in the legend.
5 Elliptic flow measurement
The final state azimuthal anisotropy is quantified by the coe
fficients of the Fourier expansion of the particle azimuthal angle distribution [22],
dN/dφ
∝1
+2
∞
X
n=1
vn
cos (n[φ
−Ψn]), (2)
where
vnand
Ψnare the magnitude and azimuthal direction (the so called event plane angle) of the n-th order flow harmonics. This study is focused on the second flow harmonic, the elliptic flow,
v2. For a given collision centrality,
v2is a function of p
Tand
ηand can be determined as
v2
(η, p
T)
= hcos (2[φ−Ψ2])i
qhcos (2[ΨN2 −Ψ2P
])i
,
(3)
where the numerator denotes the average over charged particle tracks, and the denominator, averaged over events, is a resolution correction, accounting for the finite experimental resolution in the determi- nation of the event plane angle
Ψ2. This resolution correction is obtained using the subevent technique, described in [22] and also in [14, 15]. The two “subevents” defined in each event cover the two
ηranges of the same width in the positive and negative
ηhemispheres (3.2
<|η|<4.8) of the FCal detector. The subevent plane angles are determined by,
ΨN(P)2 =
1 2 tan
−1
P
E
T,itowerwisin(2φ
i)
PE
towerT,i wicos(2φ
i)
,
(4)
where the sums run over tower transverse energies, E
towerT, as measured in the first sampling layer of the forward calorimeter located on the negative (N) and positive (P)
ηsides. The same expression is used to calculate
Ψ2with the sums running over E
towerTon both positive and negative sides of FCal. The weights,
wi = wi(φ
i, ηi), are determined in narrow
∆ηslices (
∆η=0.1) over the full
ηrange in order to remove structures in the uncorrected
φdistributions of E
towerTin every
∆ηslice and to ensure a uniform
Ψ2distribution.
The above method was applied previously [14] to measure
v2as a function of p
Tusing charged particle tracks reconstructed in the ID tracking system with minimum p
Tof 0.5 GeV. The purpose of this study is to measure
v2integrated over charged particle transverse momenta.
In the first analysis step, the same method is applied to measure di
fferential
v2(η) with tracklets and
v2(η, p
T) with both pixel tracks and full ID tracks in small bins in
ηand p
T.
The comparison of the
v2(η, p
T) obtained with the pixel and ID tracks shows, in the overlapping p
Tregion, a good agreement between the two approaches after the extracted
v2for pixel tracks is corrected for the e
fficiency and the fake rate using MC. This correction amounts to 10% in the most central colli- sions and vanishes in the most peripheral. In the case of ID tracks, the difference is compatible with zero and no correction is applied.
In order to perform the integration over p
T, the di
fferential
v2measurements are weighted by the number of tracks corrected for the efficiency,
, and fake rate,f , determined as described in Section 4,
v2=X
i
X
k
v2
(η
i,p
T,k)N
i,kcorr/Xi
X
k
N
i,kcorr,(5)
where the sums run over fine bins in
η(denoted by index i) and p
T(index k). The number of tracks
corrected for both reconstruction efficiency and fake rate, is N
i,kcorr=N
i,k[1
−f (i, k)]/(i, k). In the case of
tracklets the sum over p
Tbins is dropped and the
η-dependent efficiency and fake rate corrections are usedin order to obtain
v2integrated over a region in
η. Thev2measured with ID tracks is integrated over the
p
Trange from 0.5 to 5 GeV. In case of pixel tracks the integration is performed over p
T,0<p
T<5 GeV,
where the lower p
Tlimit is varied between 0.1 and 0.5 GeV.
6 Systematic uncertainties
The systematic uncertainties include those common for di
fferent tracking methods, as well as method- specific uncertainties.
An overall scale uncertainty on
v2comes from the uncertainty on the fraction of the total inelastic cross section accepted by the trigger and event selection criteria. It is negligibly small in central events (relative uncertainty below 1%) and increases up to about 5% for the most peripheral collisions for the tracklet method and to about 3% for both pixel track and ID track methods.
Deviations from zero of
hsin 2[φ−Ψ2]i are sensitive to biases in the event plane determination and detector non-uniformities. The magnitude of the sine term relative to the cosine term was evaluated and included in the systematic uncertainty of
v2. It was found that for the tracklet method its contribution to the relative systematic uncertainty is negligibly small. For the pixel and ID tracks it is also small for most of centrality bins, and only for the most peripheral collisions increases up to 3%.
The comparison of
v2measured at positive and negative pseudorapidities leads to an uncertainty of 1%.
The p
Tspectrum of charged particles in the MC was reweighted to agree with that measured in the data. This changes the effective fake rate and therefore the weights used in the calculation of
v2. A systematic variation of these weights by 10% had a negligible e
ffect on the determination of
v2.
The analysis procedure was also checked with MC studies where the generated elliptic flow signal was compared to the
v2obtained with the same analysis chain as used for the data (MC closure test).
Relative di
fferences of up to 10% are observed for tracklets in central collisions and up to 30% in the peripheral collisions. For ID tracks this contribution reaches 5%.
In case of pixel tracks, the ratio between
v2determined in the MC at the generated track level and the reconstructed level was applied as a correction to
v2determined from the data. The statistical uncertainty on this correction was propagated as the systematic uncertainty and amounts to about 7%.
For the pixel and ID track methods, differences between
v2determined from tracks of negatively and positively charged particles as well as between the baseline
v2and that obtained with tighter and looser tracking requirements (by changing by
±1 the nominal significance of the transverse and longitudinalimpact parameters of a track) also contributed to the systematic uncertainty at the level of few %.
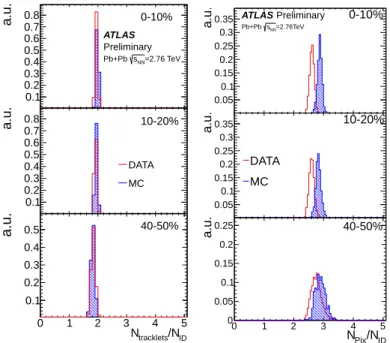
The uncertainty on the fake rates was determined by comparing the rate of pixel tracks relative to the total number of ID tracks in an event, as a function of centrality and p
T, in the data and in the MC.
Differences of up to 10% were observed in particular in the highest centrality bins as shown in Fig. 4 after integrating over p
T. This was estimated to lead to uncertainties in the fake rates of up to 30%. This uncertainty on the fake rates, propagated to the
v2measurements, results in a 1% change in
v2integrated from 0.1 GeV for the most central (0-10% centrality) events, decreasing with increasing centrality and vanishing for higher p
Tintegration threshold.
The rate of tracklets relative to the number of ID tracks in an event was found to be very well repro- duced by MC as shown in Fig. 4, and therefore the fake rates were assumed to be modeled adequately.
A comparison of
v2obtained with the tracklet method for a MC sample with the nominal geometry to that with artificially added 10% of active and 15–20% of inactive material shows an agreement to better than 2%. Therefore it was assumed that potential inaccuracies in the description of the detector material in the Geant simulation, have negligibly small effect on the final results, also for pixel tracks and ID tracks.
The di
fferent contributions to the total systematic uncertainty on the integrated
v2are shown in Fig. 5 for
|η|<1 for all the tracking methods.
The total systematic uncertainties are calculated as the sum of all individual contributions added in quadrature and treated as 1σ uncertainties.
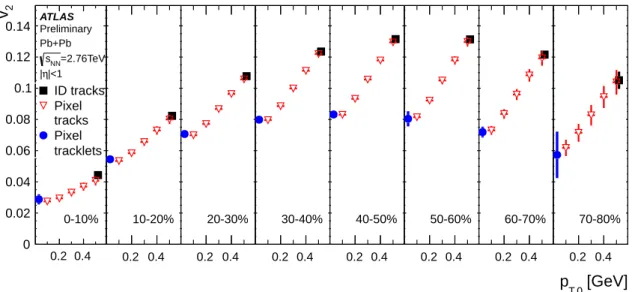
The consistency of the results obtained with the three tracking methods is illustrated in Fig. 6 showing
/NID tracklets
0 1 2 3 N 4 5
a.u.
0.1 0.2 0.3 0.4 0.5 0.6 0.7
0.8 0-10%
ATLAS Preliminary
=2.76 TeV sNN Pb+Pb
/NID tracklets
0 1 2 3 N 4 5
a.u.
0.1 0.2 0.3 0.4 0.5 0.6 0.7
0.8 10-20%
DATA MC
/NID tracklets
0 1 2 3N 4 5
a.u.
0.1 0.2 0.3 0.4
0.5 40-50%
/NID
NPix
0 1 2 3 4 5
a.u.
0.05 0.1 0.15 0.2 0.25 0.3
0.35 ATLAS Preliminary 0-10%
=2.76TeV sNN Pb+Pb
/NID
NPix
0 1 2 3 4 5
a.u.
0.05 0.1 0.15 0.2 0.25 0.3 0.35
DATA MC
10-20%
/NID
NPix
0 1 2 3 4 5
a.u.
0 0.05 0.1 0.15 0.2
0.25 40-50%
Figure 4: Comparison of the multiplicity ratios of tracklets (left) and pixel tracks (right) to ID tracks in data (red) and MC (blue) in three centrality bins as denoted in figure.
centrality percentile 0 10 20 30 40 50 60 70 80 [%]sys∆
-20 -10 0 10 20
30 Tracklets |η|<1 Total Centrality N-P hemisperes Sine term Closure
ATLAS Preliminary Pb+Pb
=2.76TeV sNN
centrality percentile 0 10 20 30 40 50 60 70 80 [%]sys∆
-10 0 10 20 30
>0.1 GeV Pixel tracks pT
Total Centrality Track selection N-P hemispheres Fakes uncertainty Charge +/- Sine term Closure
Preliminary ATLAS Pb+Pb
=2.76TeV sNN
centrality percentile 0 10 20 30 40 50 60 70 80 [%]sys∆
-10 0 10 20 30
> 0.5 GeV ID tracks pT
Total Centrality Track selection N-P hemispheres Charge +/- Sine term Closure
Preliminary ATLAS Pb+Pb
=2.76TeV sNN
Figure 5: Contributions to the relative systematic uncertainty on elliptic flow,
∆sys, as a function of centrality for
|η| <1 with the tracklet method (left). Middle and right plots show the same for
v2integrated over p
T >0.1 GeV with the pixel tracks and
v2integrated over p
T >0.5 GeV with the ID tracks respectively. The total uncertainty is marked by the shaded area. The individual contributions, also shown, are explained in the legend.
the dependence of
v2integrated over p
T >p
T,0as a function of p
T,0within
|η|<1.
7 Results
Figure 7 shows the centrality dependence of
v2measured by ATLAS for
|η|<1 and integrated over trans-
verse momenta p
T >0.03 GeV from the tracklet method and over 0.1
<p
T<5 GeV from the pixel track
0.2 0.4
2v
0 0.02 0.04 0.06 0.08 0.1 0.12 0.14
0-10%
ATLAS Preliminary Pb+Pb
=2.76TeV sNN
|<1 η
|
ID tracks Pixel tracks Pixel tracklets
0.2 0.4
2v
0 0.02 0.04 0.06 0.08 0.1 0.12 0.14
10-20%
0.2 0.4
2v
0 0.02 0.04 0.06 0.08 0.1 0.12 0.14
20-30%
0.2 0.4
2v
0 0.02 0.04 0.06 0.08 0.1 0.12 0.14
30-40%
0.2 0.4
2v
0 0.02 0.04 0.06 0.08 0.1 0.12 0.14
40-50%
0.2 0.4
2v
0 0.02 0.04 0.06 0.08 0.1 0.12 0.14
50-60%
0.2 0.4
2v
0 0.02 0.04 0.06 0.08 0.1 0.12 0.14
60-70%
0.2 0.4
2v
0 0.02 0.04 0.06 0.08 0.1 0.12 0.14
70-80%
[GeV]
pT,0
Figure 6: In centrality bins, elliptic flow
v2integrated over p
T>p
T,0as a function of p
T,0, where p
T,0of 0.03 GeV corresponds to the tracklet method (blue circles), 0.1–0.5 GeV is for the pixel track method (red triangles) and the p
Tthreshold for ID tracks is 0.5 GeV (black squares).
centrality percentile
0 10 20 30 40 50 60 70 80
2
v
0 0.02 0.04 0.06 0.08 0.1 0.12
|<1 η
>0.03 GeV, | ATLAS tracklets B-off, pT
|<1 η
<5 GeV, | ATLAS 0.1<pT
|<0.8 η
<3 GeV, | CMS 0.3<pT
ATLAS Preliminary
=2.76 TeV sNN
Pb+Pb
Figure 7: Centrality dependence of
v2measured for
|η| <1 and integrated over transverse momenta p
T>0.03 GeV for the tracklet method (full circles) and over 0.1
<p
T<5 GeV for the pixel track method (open circles). Also shown are results of CMS
v2measurement using event plane method and integrated over 0.3
<p
T<5 GeV [16] (open crosses). Error bars show statistical and systematic uncertainties added in quadrature.
method. One can see that the tracklet method with a lower p
Tthreshold gives results consistent with the
v2obtained with the pixel tracks, as could be expected due to the very low charged particle density in the
momentum range below 0.1 GeV. This indicates that there is no need to extrapolate measurements with tracklets down to p
T=0 in order to obtain a reliable estimate of
v2integrated over the whole kinematic range in p
T, and also in the case of pixel tracks such extrapolation would result in a very small correction to the measured integrated flow, well within the uncertainties of the measurement. The results are com- pared to the integrated
v2measured by CMS [16] with the p
Tthreshold of 0.3 GeV. Here, as expected, the sensitivity to the low-p
Tthreshold is clearly visible.
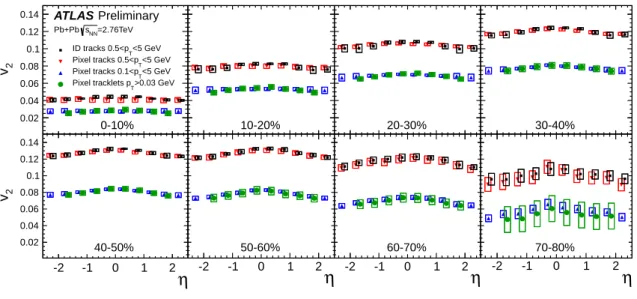
The pseudorapidity dependence of the p
T-integrated elliptic flow provides useful constraints on the initial conditions of heavy ion collisions used in model descriptions of the system evolution (see e.g [23]). Figure 8 shows the
ηdependence of the p
T-integrated
v2. As already observed in Fig. 7 the systematic difference between the results obtained with the p
Tthreshold of 0.03 GeV and 0.1 GeV is very small and both measurements agree within uncertainties. There is also consistency between the results obtained using pixel tracks and full ID tracks when the same low-p
Tcutoff is applied. The pseudorapidity dependence of the integrated
v2is very weak, and only for peripheral collisions a drop with increasing
|η|of about 5-10% is seen. A comparison to results from the CMS [16] experiment is
-2 -1 0 1 2 η
2v
0.02 0.04 0.06 0.08 0.1 0.12 0.14
0-10%
Preliminary ATLAS
=2.76TeV sNN
Pb+Pb
<5 GeV ID tracks 0.5<pT
<5 GeV Pixel tracks 0.5<pT
<5 GeV Pixel tracks 0.1<pT
>0.03 GeV Pixel tracklets pT
-2 -1 0 1 2
η
2v
0.02 0.04 0.06 0.08 0.1 0.12 0.14
40-50%
η
-2 -1 0 1 2
2v
0.02 0.04 0.06 0.08 0.1 0.12 0.14
10-20%
-2 -1 0 1 2
η
2v
0.02 0.04 0.06 0.08 0.1 0.12 0.14
50-60%
η
-2 -1 0 1 2
2v
0.02 0.04 0.06 0.08 0.1 0.12 0.14
20-30%
-2 -1 0 1 2
η
2v
0.02 0.04 0.06 0.08 0.1 0.12 0.14
60-70%
-2 -1 0 1 2η
2v
0.02 0.04 0.06 0.08 0.1 0.12 0.14
30-40%
-2 -1 0 1 2
η
2v
0.02 0.04 0.06 0.08 0.1 0.12 0.14
70-80%
Figure 8: Pseudorapidity,
η, dependence ofv2integrated over p
Tfor different tracking methods and different low-p
Tthresholds in centrality bins, as described in the legend.
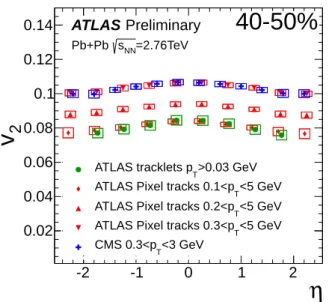
shown in Fig. 9 for the centrality bin 40–50%. The ATLAS measurements performed with pixel tracks were integrated over p
Twith the low-p
Tcuto
ffadjusted to match the one of CMS. The results agree, within the uncertainties, provided the same low- p
Tcutoff is imposed. A systematic decrease of
v2with lowering the low- p
Tlimit is observed as expected from the
v2∼p
Tlimiting behaviour. It should be noted that decreasing the p
Tthreshold makes the integration over the full p
Tspace less sensitive to the uncertainties of the extrapolation to p
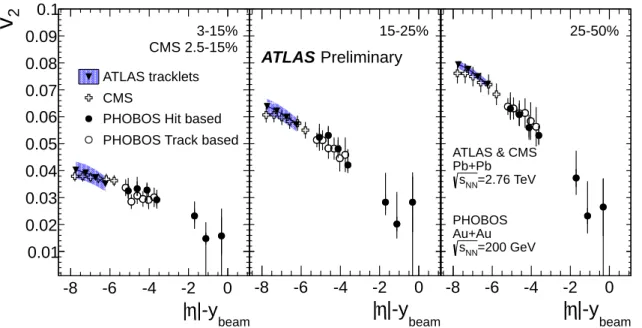
T=0.The large acceptance in pseudorapidity of the ATLAS and CMS experiments makes it possible to study whether the observation of the extended longitudinal scaling of
v2, when viewed in the rest frame of one of the colliding nuclei, reported by the PHOBOS experiment at RHIC [6, 24], holds at the much higher LHC energy. The PHOBOS measurements of the elliptic flow over a range of Au+Au collision energies,
√s
NN=19.6, 62.4, 130 and 200 GeV, showed energy independence of
v2as a function of
|η| − ybeam, where
ybeam =ln (E
+p)/M, with E, p and M being the energy, momentum and the mass of the
beam respectively. A similar effect was also observed in charged particle densities [6], known as limiting
fragmentation [25]. In Fig. 10, the integrated
v2is plotted as a function of
|η| −ybeamand compared to
-2 -1 0 1 2
η
2
v
0.02 0.04 0.06 0.08 0.1 0.12
0.14
40-50%
>0.03 GeV ATLAS tracklets pT
<5 GeV ATLAS Pixel tracks 0.1<pT
<5 GeV ATLAS Pixel tracks 0.2<pT
<5 GeV ATLAS Pixel tracks 0.3<pT
<3 GeV CMS 0.3<pT
Preliminary ATLAS
=2.76TeV sNN
Pb+Pb
Figure 9: Comparison of the pseudorapidity,
η, dependence ofv2integrated over p
Tfor di
fferent low-p
Tthresholds measured in the centrality bin 40–50% by ATLAS and CMS experiments as explained in the legend.
the PHOBOS results for the three centrality bins matching that used by PHOBOS. The PHOBOS results are obtained with the event plane method for charged particles with the low-p
Tlimit of 0.035 GeV at midrapidity and of 0.004 GeV around the beam rapidity [26]. The CMS data [16] obtained with the event plane method are also shown. The CMS measurement represents
v2integrated over p
Tfrom 0 to 3 GeV. This measurement was obtained by extrapolating
v2(p
T) measured for p
T >0.3 GeV and the charged particle spectra down to p
T=0 under the assumption that
v2( p
T =0)
=0 and with the charged particle yield constrained by the measured dN
ch/dη[27]. ATLAS and CMS results agree within the uncertainties. However, as it can be seen from the figure, there is no overlap in
|η| −ybeambetween the PHOBOS and the LHC data, making direct comparison to low energy data not possible. Nevertheless, it can be concluded, keeping in mind the relatively large uncertainties of the low energy results, that the extrapolation of the tendency observed at RHIC to the LHC energy is roughly consistent with the LHC measurements, although a weaker
|η| −ybeamdependence at the LHC energy cannot be ruled out.
8 Summary and conclusions
Measurements of the integrated elliptic flow of charged particles in Pb-Pb collisions at
√s
NN=2.76 TeV from the ATLAS experiment have been presented. The elliptic anisotropy parameter
v2has been mea- sured with the event plane method over a broad range in the collision centrality (0–80%). The kinematic range in pseudorapidity extends out to
|η| =2.5, and in p
Tthe region down to 0.03 GeV is explored.
This low-p
Tregion is reached by using the tracklet reconstruction algorithm to analyze the data taken with the solenoid field turned off. With this low-p
Treach, the elliptic flow integrated over transverse momentum is obtained, avoiding the use of the assumption-based extrapolation to p
T =0. Other track reconstruction methods, the pixel track and the full ID track ones with low- p
Tthresholds of 0.1 and 0.5 GeV respectively, have been also exploited in order to verify the tracklet measurements and provide results that can be directly compared to other LHC measurements.
The p
T-integrated elliptic flow as a function of the collision centrality shows sensitivity to the low-p
T|-y
beamη
|
-8 -6 -4 -2 0
2
v
0.01 0.02 0.03 0.04 0.05 0.06 0.07 0.08 0.09 0.1
3-15%
CMS 2.5-15%
ATLAS tracklets CMS
PHOBOS Hit based PHOBOS Track based
|-y
beamη
|
-8 -6 -4 -2 0
2v
0.01 0.02 0.03 0.04 0.05 0.06 0.07 0.08 0.09 0.1
15-25%
ATLAS Preliminary
|-y
beamη
|
-8 -6 -4 -2 0
2v
0.01 0.02 0.03 0.04 0.05 0.06 0.07 0.08 0.09 0.1
25-50%
ATLAS & CMS Pb+Pb
=2.76 TeV sNN
PHOBOS Au+Au
=200 GeV sNN
Figure 10: Integrated
v2as a function of
|η| −ybeamfor the three centrality bins, as indicated on the plots, measured by the ATLAS and CMS LHC experiments for Pb+Pb collisions at 2.76 TeV and by the PHOBOS experiment at RHIC for Au+Au collisions at 200 GeV .
cutoff, as compared to the CMS results obtained with higher low- p
Tlimits. The integrated elliptic flow increases with centrality, reaching the maximum of 0.07 for mid-central collisions (40–50%) and then decreases down to about 0.02 for the most central collisions.
The pseudorapidity dependence of the p
T-integrated
v2is very weak, and only for peripheral colli-
sions the
v2signal gradually decreases with increasing
|η|. The results are in agreement with the CMSmeasurements covering the same
ηrange, provided the same low-p
Tcuto
ffis used. The integrated
v2transformed to the rest frame of one of the colliding nuclei is compared to the lower energy RHIC
data. Although a direct comparison is not possible due to the non-overlapping kinematic reach, it can
be concluded that the tendency observed at RHIC energy regime is roughly consistent with the LHC
measurements, although a weaker dependence on pseudorapidity at the LHC energy cannot be ruled out.
References
[1] P. Romatschke, New Developments in Relativistic Viscous Hydrodynamics, Int.J.Mod.Phys.
E19(2010) 1–53,
arXiv:0902.3663 [hep-ph].[2] S. A. Voloshin, A. M. Poskanzer, and R. Snellings, Collective phenomena in non-central nuclear collisions,
arXiv:0809.2949 [nucl-ex].[3] P. Sorensen, Elliptic Flow: A Study of Space-Momentum Correlations In Relativistic Nuclear Collisions,
arXiv:0905.0174 [nucl-ex].[4] B. H. Alver, C. Gombeaud, M. Luzum, and J. Ollitrault, Triangular flow in hydrodynamics and transport theory, Phys. Rev.
C82(2010) 034913,
arXiv:1007.5469 [nucl-th].[5] BRAHMS Collaboration, I. Arsene et al., Quark gluon plasma and color glass condensate at RHIC? The perspective from the BRAHMS experiment, Nucl. Phys.
A757(2005) 1–27,
arXiv:nucl-ex/0410020.[6] B. B. Back et al., The PHOBOS perspective on discoveries at RHIC, Nucl. Phys.
A757(2005) 28–101,
arXiv:nucl-ex/0410022.[7] STAR Collaboration, J. Adams et al., Experimental and theoretical challenges in the search for the quark gluon plasma: The STAR collaboration’s critical assessment of the evidence from RHIC collisions, Nucl. Phys.
A757(2005) 102–183,
arXiv:nucl-ex/0501009.[8] PHENIX Collaboration, K. Adcox et al., Formation of dense partonic matter in relativistic nucleus nucleus collisions at RHIC: Experimental evaluation by the PHENIX collaboration, Nucl.
Phys.
A757(2005) 184–283,
arXiv:nucl-ex/0410003.[9] G. Kestin and U. W. Heinz, Hydrodynamic radial and elliptic flow in heavy-ion collisions from AGS to LHC energies, Eur. Phys. J.
C61(2009) 545,
arXiv:0806.4539 [nucl-th].[10] M. Chojnacki, W. Florkowski, W. Broniowski, and A. Kisiel, Soft heavy-ion physics from hydrodynamics with statistical hadronization: Predictions for collisions at S**(1
/2)(NN)
=5.5-TeV, Phys. Rev.
C78(2008) 014905,
arXiv:0712.0947 [nucl-th].[11] P. Romatschke and U. Romatschke, Viscosity Information from Relativistic Nuclear Collisions:
How Perfect is the Fluid Observed at RHIC?, Phys. Rev. Lett.
99(2007) 172301,
arXiv:0706.1522 [nucl-th].[12] ALICE Collaboration, K. Aamodt et al., Elliptic Flow of Charged Particles in Pb-Pb Collisions at
√
s
NN =2.76 TeV, Phys. Rev. Lett.
105(2010) 252302,
arXiv:1011.3914 [nucl-ex].[13] ALICE Collaboration, K. Aamodt et al., Higher Harmonic Anisotropic Flow Measurements of Charged Particles in Pb-Pb Collisions at
√s
NN=2.76 TeV, Phys. Rev. Lett.
107(2011) 032301.
[14] ATLAS Collaboration, Measurement of the pseudorapidity and transverse momentum dependence of the elliptic flow of charged particles in lead-lead collisions at
√s
NN =2.76 TeV with the ATLAS detector, Phys. Lett.
B707(2012) 330.
[15] ATLAS Collaboration, Measurement of the azimuthal anisotropy for charged particle production in
√s
NN=2.76 TeV lead-lead collisions with the ATLAS detector,
arXiv:1203.3087 [hep-ex].[16] CMS Collaboration, Measurement of the elliptic anisotropy of charged particles produced in PbPb collisions at
√s
NN=2.76 TeV ,
arXiv:1204.1409 [nucl-ex].[17] CMS Collaboration, Azimuthal anisotropy of charged particles at high transverse momenta in PbPb collisions at
√s
NN =2.76 TeV ,
arXiv:1204.1850 [nucl-ex].[18] ATLAS Collaboration, The ATLAS Experiment at the CERN Large Hadron Collider, JINST
3(2008) S08003.
[19] M. Gyulassy and X.-N. Wang, HIJING 1.0: A Monte Carlo program for parton and particle production in high-energy hadronic and nuclear collisions, Comput. Phys. Commun.
83(1994) 307,
arXiv:nucl-th/9502021.[20] S. Agostinelli et al., Geant4 - a simulation toolkit, Nucl. Instr. Meth.
A506(2003) 250.
[21] ATLAS Collaboration, Measurement of the centrality dependence of the charged particle pseudorapidity distribution in lead-lead collisions at
√s
NN=2.76 TeV with the ATLAS detector, Phys. Lett.
B710(2012) 363.
[22] A. M. Poskanzer and S. A. Voloshin, Methods for analyzing anisotropic flow in relativistic nuclear collisions, Phys. Rev.
C58(1998) 1671–1678,
arXiv:nucl-ex/9805001.[23] T. Hirano, U. Heinz, and D. Kharzeev, Hadronic dissipative e
ffects on elliptic flow in ultrarelativistic heavy-ion collisions, Phys. Lett.
B636(2006) 299,
arXiv:0805.0064 [nucl-th].[24] PHOBOS Collaboration, B. B. Back et al., Centrality and pseudorapidity dependence of elliptic flow for charged hadrons in Au
+Au collisions at
√s
NN=200 GeV, Phys. Rev.
C72(2005) 051901,
nucl-ex/0407012.[25] J. Benecke, T. Chou, and C. Yang, Hypothesis of Limiting Fragmentation in High-Energy Collisions, Phys. Rev.
188(1969) 2159.
[26] PHOBOS Collaboration, B. B. Back et al., Charged-particle pseudorapidity distributions in Au
+Au collisions at
√s
NN =62.4 GeV , Phys. Rev.
C74(2006) 021901,
nucl-ex/0509034.[27] CMS Collaboration, Dependence on pseudorapidity and centrality of charged hadron production
in PbPb collisions at a nucleon-nucleon centre-of-mass energy of 2.76 TeV, JHEP
08(2011) 141.
A Additional plots for approval
Centrality[%]
0 20 40 60 80 100
2
v
0.02 0.04 0.06 0.08 0.1 0.12 0.14 0.16
ATLAS Simulation Preliminary
=2.76 TeV sNN
Pb+Pb
|<2 η
|
> 500 MeV pT
> 200 MeV pT
> 150 MeV pT
> 100 MeV pT
> 50 MeV pT
> 30 MeV pT
T cut no min p
Centrality[%]
0 20 40 60 80 100
ratio
1 1.1 1.2 1.3
+0.4
Figure 11: Comparison of
v2measured from generated particles as a function of centrality, integrated from a p
Tthreshold which is varied from 0 up to 0.5 GeV as listed in the legend. The ratio of the
v2, measured imposing this thresold to the one integrated over the entire spectrum is shown at the bottom.
[GeV]
pT 1
efficiency
0.2 0.4 0.6 0.8 1
0-10%
Simulation ATLAS
Preliminary
[GeV]
p
T 1efficiency
0.2 0.4 0.6 0.8
1 40-50%
[GeV]
p
T 1efficiency
0.2 0.4 0.6 0.8 1
10-20%
ID tracks
|<1.0 η 0<|
|<2.0 η 1<|
|<2.5 η 2<|
[GeV]
p
T 1efficiency
0.2 0.4 0.6 0.8
1 50-60%
[GeV]
p
T 1efficiency
0.2 0.4 0.6 0.8 1
20-30%
[GeV]
p
T 1efficiency
0.2 0.4 0.6 0.8
1 60-70%
[GeV]
p
T 1efficiency
0.2 0.4 0.6 0.8 1
30-40%
[GeV]
p
T 1efficiency
0.2 0.4 0.6 0.8
1 70-80%