A TLAS-CONF-2017-006 08 Febr uary 2017
ATLAS NOTE
ATLAS-CONF-2017-006
February 4, 2017
Measurement of the long–range pseudorapidity correlations between muons and charged particles in √
s NN = 8.16 TeV proton-lead collisions with the ATLAS detector
The ATLAS Collaboration
Abstract
Measurements of correlations between inclusive charged-particle pairs and between inclu- sive charged-particle and muon pairs in relative azimuthal angle (∆ φ) and pseudorapidity ( ∆ η) are presented for p + Pb collisions at √
s NN = 8.16 TeV using muons and charged par- ticles with |η| < 2.5. The correlations involving the muons are interesting as the muons primarily come from heavy-flavor decays and studying these correlations gives an under- standing of the long-range correlations involving heavy-flavor quarks. The measurements show the presence of long-range correlations between muons and inclusive charged-particles extending to | ∆ η| = 5. A template fitting method is used to remove the contribution from dijets to the correlations, and obtain the second-order Fourier coefficient, v 2,2 , corresponding to the genuine long-range correlations. The v 2,2 is factorized to obtain the single-particle anisotropy coe ffi cient, v 2 , of the muons. The dependence of the muon-v 2 on the event multi- plicity and on the muon transverse momentum are presented. The measurements presented here correspond to an integrated luminosity of 171 nb −1 .
c
2017 CERN for the benefit of the ATLAS Collaboration.
Reproduction of this article or parts of it is allowed as specified in the CC-BY-4.0 license.
1 Introduction
Recent measurements of particle production in high-energy p +Pb [1–5] and pp [6, 7] collisions, have shown an enhancement in the production of particles with small azimuthal angle (φ) separation which extends over a large range of pseudorapidity (η) separation. Such correlations were previously seen in Pb+Pb [3, 8–11] collisions where they were understood to be the result of azimuthal anisotropies of the single-particle distributions:
dN dφ = N 0
1 + 2 Σ ∞ n = 1 v n cos(n(φ − Φ n ))
, (1)
where φ is the azimuthal angle of the particle momentum, and the harmonics v n and phases Φ n are the magnitude and phase of the n th -order anisotropy. The anisotropy in Pb+Pb collisions is generally under- stood to arise from the hydrodynamic expansion of a deconfined Quark Gluon Plasma (QGP) produced in such collisions [12–14]). However, the origin of the anisotropy in p + Pb collisions is still under debate.
While collective expansion is one possible explanation, alternative interpretations based on the saturation of parton distributions in the lead nucleus are capable of reproducing many features seen in the p +Pb data [15–24].
In order to further investigate the nature of the anisotropy seen in p +Pb collisions, another observable is the long-range correlation between muons and inclusive charged particles [25]. Over the 4< p T <8 GeV range nearly all prompt muons result from decay of heavy-flavor hadrons containing charm or bottom quarks (see Reference [26] and references therein). If a QGP is produced in p +Pb collisions, then partial thermalization of heavy-flavor may be expected to be possible and visible in this momentum range [27].
Thus a measurement of long-range correlations involving prompt muons over this p T range can provide insight on the origin of the azimuthal anisotropy seen in p +Pb collisions and is the objective of this note.
This note presents ATLAS measurements of long-range correlations between heavy-flavor muons and inclusive charged particles using 171 nb −1 of p +Pb data at √
s NN =8.16 TeV collected during LHC op- eration in 2016. The measurements are performed in intervals of event activity, characterized using the charged-particle multiplicity with p T > 400 MeV in the event, and over the muon transverse momentum interval 4< p µ T <8 GeV. Background muons resulting from pion and kaon decays and hadronic interactions are suppressed using the momentum imbalance between independent measurements in the ATLAS inner detector and muon spectrometer. It is expected that over ∼80% of the muons are promptly produced.
Measurements of the inclusive charged-particle v 2 are also presented.
The outline of this note is as follows: Section 2 gives a brief overview of the ATLAS detector subsys- tems used in this analysis. Section 3 describes the p +Pb data, the triggers, and the selection criteria for muons and charged particles used in this analysis. Section 4 describes the technique used to measure the long range correlations. The systematic uncertainties in the measurement are discussed in Section 5.
Section 6 presents the results for long-range correlations between inclusive charged-particle pairs and
between muons and charged-particles. Section 7 gives a summary of the main results and observations.
2 ATLAS detector
The measurements presented in this note have been performed using the following ATLAS subdetectors:
inner detector (ID), muon spectrometer (MS), calorimeters, minimum-bias trigger scintillators (MBTS), and the trigger and data acquisition systems [28]. The ID measures charged particles within pseudorapid- ity 1 |η| < 2.5 using a combination of silicon pixel detectors including the “Insertable B–layer” (IBL) [29, 30] that was installed between Run 1 and Run 2, silicon micro-strip detectors (SCT), and a straw-tube tran- sition radiation tracker (TRT), all immersed in a 2 T axial magnetic field [31]. The MS is comprised of separate trigger and high-precision tracking chambers measuring the deflection of muons in a magnetic field generated by superconducting air-core toroids. The precision chamber system covers the region
|η| < 2.7 with three layers of monitored drift tubes, complemented by cathode strip chambers in the endcap region. The muon trigger system covers the range |η| <2.4 with resistive plate chambers in the barrel, and thin gap chambers in the endcap regions. Muons are reconstructed by combining independent mea- surements of the muon trajectories from the ID and the MS. The calorimeter system consists of a liquid argon (LAr) electromagnetic (EM) calorimeter covering |η| <3.2, a steel–scintillator sampling hadronic calorimeter covering |η| < 1.7, a LAr hadronic calorimeter covering 1.5 < |η| < 3.2, and two LAr electromag- netic and hadronic forward calorimeters (FCal) covering 3.1 < |η| < 4.9. The MBTS system, reconfigured for Run 2, detects charged particles over 2.07< |η| <3.86 using two hodoscopes of 12 counters positioned at z = ±3.6 m. The trigger system [32] consists of a Level-1 (L1) trigger implemented using a combination of dedicated electronics and programmable logic, and a high-level trigger (HLT) implemented in processors which runs algorithms similar to those used in the offline analysis.
3 Data set and reconstruction
The p +Pb data were recorded during the p +Pb operation of the LHC in November–December 2016.
During that period, the LHC was configured with a 6.5 TeV proton beam and a 2.56 TeV per-nucleon Pb beam that together produced collisions at √
s NN =8.16 TeV. The higher energy of the proton beam produces a net rapidity shift of the nucleon–nucleon center-of-mass frame by 0.465 units in the proton- going direction, relative to the ATLAS coordinate system. The p + Pb data were collected in two periods between which the directions of the proton and lead beams were reversed. The measurements presented here are performed using a dataset corresponding to an integrated luminosity of 171 nb −1 . Minimum- Bias (MinBias) events were selected by a trigger that requires a signal in at least one MBTS counter at L1 followed by the requirement of at least one reconstructed track at the HLT. However due to the large interaction rates in the p +Pb run, only a fraction of minimum-bias events could be recorded. In order to increase the number of events having high charged-particle multiplicity, several high-multiplicity (HMT) triggers were implemented. These apply a L1 requirement on the transverse energy ( P
E T ) in the calorimeters and an HLT requirement on the multiplicity of HLT-reconstructed charged-particle tracks.
That multiplicity, N trk HLT , is evaluated for tracks with p T > 0.4 GeV that are associated with the recon- structed vertex with the highest multiplicity in the event. Similarly, in order to enhance the number of high-multiplicity events that have muons, several high multiplicity triggers were defined that additionally required the presence of a L1 muon with p T > 4 GeV associated with an HLT muon also with p T > 4 GeV
1
ATLAS uses a right-handed coordinate system with its origin at the nominal interaction point (IP) in the centre of the detector and the z-axis along the beam pipe. The x-axis points from the IP to the centre of the LHC ring, and the y-axis points upward. Cylindrical coordinates (r, φ) are used in the transverse plane, φ being the azimuthal angle around the beam pipe.
The pseudorapidity is defined in terms of the polar angle θ as η = −ln tan(θ/2).
(referred to as “µ−HMT” triggers). In order to get a sample of muon events with low multiplicity, an additional muon trigger was implemented which had similar requirement on the muon as the µ−HMT triggers but without requirements on the P
E T at L1 or on N trk HLT . The HMT and µ−HMT triggers with the highest thresholds on N trk HLT sampled the full luminosity of 171 nb −1 .
3.1 Event and track selection
In the o ffl ine analysis, additional requirements are imposed on the events selected by the triggers. The events are required to have a reconstructed vertex with the z-position of the vertex restricted to |z vtx | < 150 mm.
For events containing multiple vertices (pileup events), only tracks associated with the vertex having the largest P
p 2 T are used, where the sum runs over reconstructed tracks associated with each vertex.
Charged-particle tracks and primary vertices are reconstructed in the ID using an algorithm similar to that used in Run 1, but substantially modified to improve performance [33, 34]. The reconstructed tracks are required to satisfy the following selection criteria: p T > 0.4 GeV and |η| < 2.5; at least one pixel hit, with the additional requirement of a hit in the IBL if one is expected 2 ; if a hit is not expected in the IBL, a hit in the next pixel layer is required if such a hit is expected; and a minimum of six hits in the SCT. In addition, the impact parameters of the track relative to the vertex in the transverse (d 0 ) and longitudinal (z 0 sin(θ)) directions are both required to be less than 1.5 mm. Finally, in order to remove tracks with mismeasured p T due to interactions with the detector material or other effects, the track-fit χ 2 probability is required to be larger than 0.01 for tracks having p T > 10 GeV. The muons used in the analysis are required to pass the
"medium" working point selection [35], with the additonal requirement that the muon be a “combined”
muon, i.e. reconstructed using both ID and MS.
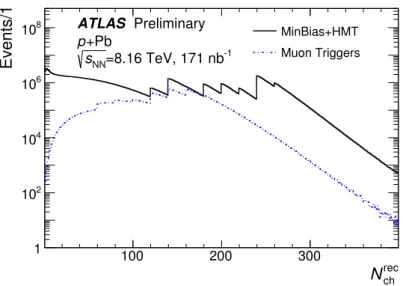
As in previous ATLAS analyses of long-range correlations in p + Pb [2, 4] and pp [6, 7] collisions, the event activity is quantified by N ch rec : the total number of reconstructed charged-particle tracks with p T >0.4 GeV, passing the track selections described above. The distribution of N ch rec is shown in Figure 1 for events used in the analysis, separately for the set of events selected by the MinBias and HMT triggers, and the set of events selected by the muon triggers.
3.2 Prompt muon selection
The objective of the present analysis is to study the long-range correlation between charged particles and prompt muons that are produced in the p + Pb collision. The measured muons have a contribution from backgrounds stemming from in-flight decays of pions and kaons, muons produced from the decays of par- ticles produced in hadronic showers, and mis-associations of ID and MS tracks. The background fractions can be estimated from Monte Carlo (MC) generated pp events that are passed through a GEANT4 [36]
simulation [37] of the ATLAS detector response and reconstructed using the algorithms applied to the data, and are found to vary between 45% at p µ T ∼4 GeV to 30% at p µ T ∼8 GeV. Previous studies [26, 38]
have shown that the signal and background contributions to the reconstructed muon sample can be dis- criminated by the momentum imbalance, ∆ p/p ID , which quantifies the difference between the ID and MS
2
A hit is expected if the extrapolated track crosses an active region of a pixel module that has not been disabled.
rec
N ch
100 200 300
Events/1
1 10
210
410
610
8MinBias+HMT
Muon Triggers ATLAS Preliminary
+Pb p
=8.16 TeV, 171 nb -1
s NN
Figure 1: Distributions of the multiplicity, N ch rec , of reconstructed charged particles having p T > 0.4 GeV, in the p+ Pb data used in this analysis. The two distributions correspond to the set of events selected by the MinBias and HMT triggers, and to the set selected by the muon triggers. The discontinuities in the distributions correspond to di ff erent HMT and µ−HMT trigger thresholds.
measurements of the muon momentum after accounting for the energy loss of the muon in the calorime- ters. It is defined as
∆ p
p ID = p ID − p ME
p ID , (2)
where p ID represents the reconstructed muon momentum from the ID, and p ME represents the recon- structed muon momentum from the MS after accounting for the average amount of energy loss in the calorimeter, determined using MC simulations as a function of momentum and angle. Muons resulting from background processes typically have p ME values smaller than would be expected for a muon pro- duced directly in the p + Pb collisions or via the decays of heavy flavor hadrons. As a result, background muons are expected to have ∆ p/ p ID >0 [26, 38]. In the present analysis, a requirement of ∆ p/p ID <0 is imposed on the muons used in the analysis, which significantly reduces the fraction of background muons to 25% at p µ T ∼4 GeV and 10% at p µ T ∼8 GeV. The e ff ect of the residual non-prompt muons on the measurements is covered by the systematic uncertainties described below in Section 5.
4 Two-particle correlations
The study of two-particle correlations (2PC) in this note follows previous ATLAS measurements in p +Pb [2, 4] and pp [6, 7] collisions. For a given event class, the two-particle correlations are measured as a function of the relative azimuthal angle ∆ φ ≡ φ a − φ b , and relative pseudorapidity ∆ η ≡ η a − η b . The labels a and b denote the two particles in the pair, which are conventionally referred to as the “reference”
and “associated” particles, respectively. The correlation function is defined as:
C( ∆ η, ∆ φ) = S(∆ η, ∆ φ)
B( ∆ η, ∆ φ) , (3)
where S and B represent pair distributions constructed from the “same event” and from “mixed events” [39], respectively. The same-event distribution S is constructed using all charged-particle pairs that can be formed in each event. The S distribution contains both the physical correlations between particle pairs and correlations arising from detector acceptance e ff ects. The mixed-event distribution B( ∆ η, ∆ φ) is con- structed by choosing the two particles in each pair from different events that have similar N ch rec (| ∆ N ch rec |<20) and z vtx (| ∆ z vtx |<10 mm), so that acceptance e ff ects in S( ∆ η, ∆ φ) are properly compensated by corre- sponding variations in B( ∆ η, ∆ φ). The B distribution does not contain physical correlations, but includes detector acceptance effects similar to those in S . By taking the ratio, S /B in Eq. (3), the detector accep- tance e ff ects largely cancel, and the resulting C( ∆ η, ∆ φ) contains physical correlations only. For charged tracks, the e ff ects of the p T and η dependent tracking e ffi ciencies, ( p T , η), are included in the measure- ments by weighting each particle by 1/( p T , η) when producing the pair distributions. For the muons, the ( p T , η) contains both trigger and tracking e ffi ciencies.The two particle correlation function is used to study the shape of the correlations in ∆ φ, and is conveniently normalized such that the ∆ φ-averaged value of C(∆ η, ∆ φ) is unity for | ∆ η| >2.
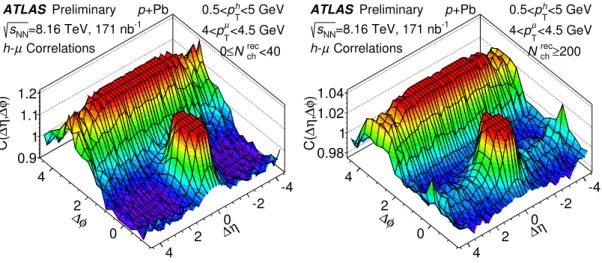
In this note, the reference particle is always a charged track and the associated particle is either a charged track or a reconstructed muon depending on what type of correlation is being studied. The corresponding correlations are labelled as h–h and h–µ correlations respectively 3 . Examples of h–µ correlation func- tions are shown in Figure 2 for 0.5<p a T <5 GeV and 4 < p µ T < 4.5 GeV and for two di ff erent N ch rec ranges of 0<N ch rec <40 and N ch rec ≥200. Similar examples for h–h correlation functions are shown in Figure 3 for 0.5< p a,b T <5 GeV and for two N ch rec ranges of 0< N ch rec <40 and 200< N ch rec <220. The low-multiplicity cor- relation function exhibits features that are understood to result primarily from hard-scattering processes:
a peak centered at ∆ η =∆ φ = 0 that arises primarily from jets and an enhancement centered at ∆ φ = π and extending over the full ∆ η range which results from dijets. These features are also seen in the high- multiplicity correlation function which, additionally, exhibits a clear “ridge” structure – an enhancement centered at ∆ φ = 0 that extends over the entire measured ∆ η range.
One-dimensional correlation function C(∆ φ) is obtained by integrating the numerator and denominator of Eq. (3) over 1 <|∆ η |< 5 prior to taking the ratio:
C( ∆ φ) = R 5
1 d| ∆ η| S(| ∆ η|, ∆ φ) R 5
1 d| ∆ η| B(| ∆ η|, ∆ φ) ≡ S( ∆ φ)
B(∆ φ) . (4)
This |∆ η | range is chosen to extract the long-range features of the correlation functions. However, as can be seen from Figure 2, a significant contribution to the 2PC arises from back to back dijets (which can correlate particles with large ∆ η separation). In order to estimate and remove the contribution of such back to back dijets and other processes, such as decays, which correlate only a subset of the total particles in the event, a template fitting method that was recently developed by ATLAS [6, 7], is used in this analysis.
The template fit procedure assumes that :
1. The jet-correlation has a universal shape in ∆ φ independent of the event multiplicity. Only the relative dijet contribution to the 2PC changes, but its shape remains the same.
2. At low multiplicity most of the structure of the 2PC arises from back to back dijets, i.e. the shape of the dijet correlation can be obtained from low multiplicity events.
3
The label ‘h’ signifies a hadron, even though in reality inclusive charged-particles are used. However, since nearly all charged-
particles produced in p + Pb collisions are hadrons this labelling is appropriate.
∆ φ 0 2 4
∆ η
-4 -2 0 2 4
) φ ∆ , η ∆ C(
0.9 1 1.1 1.2
ATLAS Preliminary p +Pb
=8.16 TeV, 171 nb
-1s
NNCorrelations - µ
h
<5 GeV
h
p
T0.5<
<4.5 GeV
µ
p
T4<
<40
rec
N
ch0 ≤
∆ φ 0 2 4
∆ η
-4 -2 0 2 4
) φ ∆ , η ∆ C(
0.98 1 1.02 1.04
ATLAS Preliminary p +Pb
=8.16 TeV, 171 nb
-1s
NNCorrelations - µ
h
<5 GeV
h
p
T0.5<
<4.5 GeV
µ
p
T4<
≥ 200
rec
N
chFigure 2: Two-particle h–µ correlation functions in 8.16 TeVp + Pb collisions. The left panel corresponds to a lower-multiplicity range of 0≤N ch rec <40. The right panel corresponds to higher multiplicity ranges of N ch rec ≥200. The plots are for 0.5 < p a T < 5 GeVand 4.5 < p µ T < 5 GeV. The distributions have been truncated to suppress the peaks at
∆ η =∆ φ = 0 and ∆ φ = π and are plotted over | ∆ η|<4.6 to avoid statistical fluctuations at larger | ∆ η|.
∆ φ 0 2 4
∆ η
-4 -2 0 2 4
) φ ∆ , η ∆ C( 1
1.05
ATLAS Preliminary p +Pb
=8.16 TeV, 171 nb
-1s
NNCorrelations h
- h
<5 GeV
b , a
p
T0.5<
<40
rec
N
ch≤ 0
∆ φ 0 2 4
∆ η
-4 -2 0 2 4
) φ ∆ , η ∆ C(
0.98 1 1.02
ATLAS Preliminary p +Pb
=8.16 TeV, 171 nb
-1s
NNCorrelations h
- h
<5 GeV
b , a
p
T0.5<
<220
rec
N
ch≤ 200
Figure 3: Two-particle h–h correlation functions in 8.16 TeVp + Pb collisions. The left panel corresponds to a lower- multiplicity range of 0 ≤ N ch rec <40. The right panel corresponds to higher multiplicity ranges of 200 ≤ N ch rec <220. The plots are for h–h correlations with 0.5 < p a,b T < 5 GeV. The distributions have been truncated to suppress the peak at
∆ η =∆ φ = 0 and are plotted over | ∆ η|<4.6.
With the above assumptions, the correlation in higher multiplicity events C( ∆ φ), is then described by a template fit, C templ (∆ φ), consisting of two components: a scale factor, F, times the correlation measured in low multiplicity or “peripheral” events, C periph ( ∆ φ), which accounts for the dijet contribution to the correlation, and a genuine long-range harmonic modulation, C ridge ( ∆ φ):
C templ (∆ φ) = FC periph (∆ φ) + C ridge (∆ φ), (5) with
C ridge ( ∆ φ) = G
1 +
∞
X
n = 2
2v n,n cos (n ∆ φ)
, (6)
where F and the v n,n are fit parameters adjusted to reproduce the measured C( ∆ φ). The parameter G, which represents the magnitude of the combinatoric component of C ridge (∆ φ), is fixed by the requirement that the integral of the C templ ( ∆ φ) and C( ∆ φ) be equal. The harmonics v n,n quantify the strength of the genuine long-range correlation, and are the objects of interest. The single-particle anisotropies v n are related to the v n,n as [11]:
v n,n (p a T , p b T ) = v n (p a T )v n ( p b T ). (7) Using Eq. 7 and the measured v n,n values the single-particle anisotropies can be obtained as:
v n (p b T ) = v n,n (p a T , p b T )/v n (p a T ) = v n,n (p a T , p b T )/ q
v n,n ( p a T , p a T ), (8) where the last equality uses the fact that v n,n ( p a T ,p a T ) = v n (p a T ) 2 . From Eq. 8 it can be seen that to obtain v n
(p b T ), both v n,n ( p a T , p b T ) and v n,n ( p a T ,p a T ) need to be measured. Thus to obtain the muon-v 2 , both h–µ and h–h correlations need to be measured. In this note, the 0<N ch rec <40 multiplicity interval is used to produce C periph (with the h–h and h–µ template-fits using the corresponding 0<N ch rec <40 correlations as C periph ).
Systematic checks are performed to test the stability of the measured v n,n to the choice of the peripheral reference.
Figure 4 shows template fits to the h–µ correlation for 0.5 < p a T < 5 GeVand 4 < p µ T < 6 GeV. Each panel represents a different N ch rec range. The template fits (Eq. (5)) include harmonics n =2–4. A clear peak on the near-side cannot be seen in the first panel, which corresponds to a low N ch rec interval of 60 < N ch rec
< 80. However, the template fits indicate the presence of a modulated component of C ridge ( ∆ φ) at this multiplicity. Similar template fits to the h–h correlations are shown in Figure 5.
5 Systematic uncertainties
The systematic uncertainties in the h–h correlations arise from choosing the peripheral bin used in the
template fits, pileup, tracking e ffi ciency, track selection criteria, and pair-acceptance e ff ects. For the h–µ
correlations there are additional sources of uncertainties that are related to the muon trigger efficiency, and
the contamination from background particles which are reconstructed as muons. Each source is discussed
separately below and representative numbers are given for the v 2,2 . The corresponding numbers for v 2 are
φ
∆
-1 0 1 2 3 4
) φ ∆ C(
0.96 0.98 1 1.02 1.04 1.06 1.08 1.1 1.12
Correlations) -µ
) (h φ C(∆
) + G φ (∆
periph
FC ) φ (∆
templ
C
periph(0) ) +FC φ (∆
ridge
C
periph(0) G + FC
ATLAS Preliminary
=8.16 TeV, 171 nb
-1s
NN+Pb p
<6 GeV
µ
p
T<5 GeV, 4<
a
p
T0.5<
<80
rec
N
ch|<5, 60 ≤ η 1<| ∆
φ
∆
-1 0 1 2 3 4
) φ ∆ C(
0.96 0.98 1 1.02 1.04 1.06 1.08
Correlations) -µ
) (h φ C(∆
) + G φ (∆
periph
FC ) φ (∆
templ
C
periph(0) ) +FC φ (∆
ridge
C
periph(0) G + FC
ATLAS Preliminary
=8.16 TeV, 171 nb
-1s
NN+Pb p
<6 GeV
µ
p
T<5 GeV, 4<
a
p
T0.5<
<120
rec
N
ch|<5, 100 ≤ η 1<| ∆
φ
∆
-1 0 1 2 3 4
) φ ∆ C(
0.98 1 1.02 1.04 1.06
Correlations) -µ
h ) ( φ C(∆
) + G φ (∆
periph
FC ) φ (∆
templ
C
periph(0) ) +FC φ (∆
ridge
C
periph(0) G + FC
ATLAS Preliminary
=8.16 TeV, 171 nb
-1s
NN+Pb p
<6 GeV
µ
p
T<5 GeV, 4<
a
p
T0.5<
<160
rec
N
ch|<5, 140 ≤ η 1<| ∆
φ
∆
-1 0 1 2 3 4
) φ ∆ C(
0.97 0.98 0.99 1 1.01 1.02 1.03 1.04 1.05
Correlations) -µ
h ) ( φ C(∆
) + G φ (∆
periph
FC ) φ (∆
templ
C
periph(0) ) +FC φ (∆
ridge
C
periph(0) G + FC
ATLAS Preliminary
=8.16 TeV, 171 nb
-1s
NN+Pb p
<6 GeV
µ
p
T<5 GeV, 4<
a
p
T0.5<
≥ 200
rec
N
ch|<5, η 1<| ∆
Figure 4: Template fits to h–µ correlations for | ∆ η| > 1. Each panel corresponds to a di ff erent multiplicity interval.
The template fitting includes second-order, third-order and fourth-order harmonics. The solid points indicate the measured C( ∆ φ), the open points and curves show di ff erent components of the template (see legend) that are shifted along the y-axis by G or by FC periph (0), where necessary, for presentation. The plots are for 0.5<p a T <5 GeVand 4<p µ T <6 GeV.
obtained by standard error propagation via Equations 7–8. The systematic uncertainties for the h–h and h–µ correlations are summarized in Tables 1 and 2 respectively.
• Choice of peripheral bin: The template fitting analysis uses the 0< N ch rec <40 multiplicity interval to generate the peripheral reference, C periph (∆ φ), used in the template fits. In order to check the stability of the results to the choice of the peripheral reference, the template fits are repeated with several choices of the multiplicity interval used to build C periph (∆ φ): 0–20, 20–40, 10–20, 20–
30 and 30–40. The maximum variation seen in the v 2,2 and v 2 for these alternate choices of the peripheral reference is included as a systematic uncertainty and covers possible e ff ects of N ch rec - dependent changes in the width of the dijet peak in ∆ φ [6, 7]. For the v 2,2 in h–h correlations with 0.5< p a,b T <5 GeV this uncertainty is ∼6% at N ch rec ∼40 and decreases to ∼1% at N ch rec ∼300. For the h–µ correlations, this uncertainty ranges between 25–50% at N ch rec ∼60 depending on the p T of the muon. The uncertainty decreases rapidly as a function of N ch rec and is ∼10% at N ch rec ∼300.
• Background muons: As mentioned before, the reconstructed muons contain non-prompt back- grounds from in-flight decays of pions and kaons, muons produced from the decays of particles produced in hadronic showers, and mis-associations of ID and MS tracks. The requirement of
∆ p/ p ID <0 on the muons used in the analysis reduces the fraction of background muons by & 50%.
φ
∆
-1 0 1 2 3 4
) φ ∆ C(
0.96 0.98 1 1.02 1.04 1.06 1.08 1.1 1.12
Correlations) -h
) (h φ C(∆
) + G φ (∆
periph
FC ) φ (∆
templ
C
periph(0) ) +FC φ (∆
ridge
C
periph(0) G + FC
ATLAS Preliminary
=8.16 TeV, 171 nb
-1s
NN+Pb p
<6 GeV
b
p
T<5 GeV, 4<
a
p
T0.5<
<80
rec
N
ch|<5, 60 ≤ η 1<| ∆
φ
∆
-1 0 1 2 3 4
) φ ∆ C(
0.96 0.98 1 1.02 1.04 1.06 1.08
ATLAS Preliminary
=8.16 TeV, 171 nb
-1s
NN+Pb p
<6 GeV
b
p
T<5 GeV, 4<
a
p
T0.5<
<120
rec
N
ch|<5, 100 ≤ η 1<| ∆
φ
∆
-1 0 1 2 3 4
) φ ∆ C(
0.98 1 1.02 1.04
1.06 ATLAS Preliminary
=8.16 TeV, 171 nb
-1s
NN+Pb p
<6 GeV
b
p
T<5 GeV, 4<
a
p
T0.5<
<160
rec
N
ch|<5, 140 ≤ η 1<| ∆
φ
∆
-1 0 1 2 3 4
) φ ∆ C(
0.97 0.98 0.99 1 1.01 1.02 1.03 1.04 1.05
ATLAS Preliminary
=8.16 TeV, 171 nb
-1s
NN+Pb p
<6 GeV
b
p
T<5 GeV, 4<
a
p
T0.5<
≥ 200
rec
N
ch|<5, η 1<| ∆
Figure 5: Template fits to h–h correlations for | ∆ η| > 1. Each panel corresponds to a di ff erent multiplicity interval.
The solid points indicate the measured C( ∆ φ), the open points and curves show di ff erent components of the template (see legend) that are shifted along the y-axis by G or by FC periph (0), where necessary, for presentation. The plots are for 0.5<p a T <5 GeVand 4<p b T <6 GeV.
The e ff ect of the residual background on the v 2,2 is conservatively estimated as the di ff erence be- tween the v 2,2 values when restricting the ∆ p/p ID to be less than zero, and not restricting it. This is conservative as more than 50% of the background is rejected, while this estimate assumes that only 50% of the background is rejected.
• Trigger and tracking e ffi ciencies: The effects of the tracking efficiency are included in the mea- surements by weighting each particle by 1/( p T , η) when producing the distributions. For azimuthal anisotropy measurements performed in this note, an overall p T -independent tracking e ffi ciency does not affect the results. This is because the v n,n measure the relative modulation in the distribution of pairs, and any overall e ffi ciency corrections only a ff ect the number of pairs, but not their rela- tive modulation in ∆ φ. However, as the tracking e ffi ciency has p T and η dependence, it has some influence on the results. The maximum effect of the tracking efficiency on the measurements is de- termined by comparing the results obtained when not correcting for the e ffi ciency to those obtained when correcting for it. The e ffi ciency correction has a ∼2% e ff ect on the measured h–h v 2,2 values, and is conservatively considered as a systematic uncertainty. For the h–µ correlations, the effects of the muon trigger and tracking e ffi ciencies are similarly evaluated. Here the di ff erence in the v 2,2
is between 2–5% for the p µ T intervals used in this note.
• Track and muon selection The default analysis uses the track and muon selections described
in Section 3.1. As a systematic check, the analysis is repeated using stricter criteria for track selection: In addition to the selections listed in Section 3.1, the tracks are required to have at least two pixel hits, at least eight SCT hits, and at most one missing hit 4 in the SCT. Additionally the d 0 and z 0 sin(θ) impact parameters of the track are required to be less than 0.5 mm. The maximum variation seen in the h–h v 2,2 with this alternate track selection is ∼2% for N ch rec <250 and increases to ∼5% for N ch rec = 300. Similarly for the h–µ correlations, the muons are required to pass the "Tight"
working point selection [35] and the measurements are repeated. The maximum variation seen in the h–µ v 2,2 values is ∼2%. These variations are included as systematic uncertainties.
• Pileup: Since the analysis only uses tracks associated with the vertex having the largest P p 2 T , the presence of additional pileup vertices should not affect the measurements, as the tracks from the pileup vertex are not included in the calculation of N ch rec or in building the correlation functions.
However, when the pileup vertex is close enough to the primary vertex, tracks from the pileup vertex can be associated with the primary vertex. Pileup events, when included in the two-particle correlation measurement, dilute the v n,n signal since they produce pairs where the reference and as- sociated particles are from di ff erent collisions and thus have no physical correlations. The maximal fractional dilution in the v n,n is equal to the rate of residual pileup events. This rate in the data is estimated to be less than 1% over the N ch rec <250 range and 1–5% over the 250–300 N ch rec range, and is included as the uncertainty associated with pileup.
• Pair acceptance: The two-particle correlation analysis uses event mixing to estimate and correct for detector acceptance effects (Eq. (3)–(4)). These corrections however, are found to be quite small and have less than 1% e ff ect on the measured v 2,2 values. Conservatively, the entire correction is included as a systematic uncertainty.
Syst Uncertainty Value
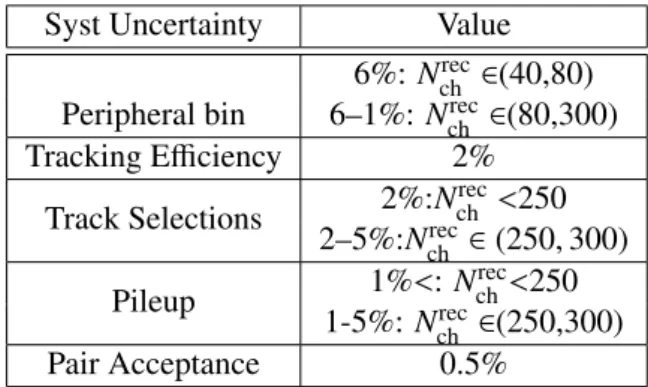
6%: N ch rec ∈(40,80) Peripheral bin 6–1%: N ch rec ∈(80,300) Tracking E ffi ciency 2%
Track Selections 2%:N ch rec < 250 2–5%:N ch rec ∈ (250, 300) Pileup 1% < : N ch rec < 250
1-5%: N ch rec ∈(250,300)
Pair Acceptance 0.5%
Table 1: List of systematic uncertainties on the h–h v 2,2 for 0.5 < p a,b T < 5 GeV.
6 Results
The left panel of Figure 6 shows the measured v 2,2 in h–h correlations with 0.5 < p a,b T < 5 GeV and in h–µ correlations with 0.5 < p a T < 5 GeV and 4 < p µ T < 6 GeV. The right panel of Figure 6 shows the corresponding v 2 values of associated particles: for charged-tracks with 0.5< p b T <5 GeV and muons with 4<p µ T <6 GeV.
The v 2 for charged particles increases with N ch rec at low N ch rec and eventually saturates for N ch rec > 150. How- ever even at the lowest measured multiplicity, a large v 2 is observed. A significant v 2 is also observed for
4
A hit is said to be missing when it is expected but not found.
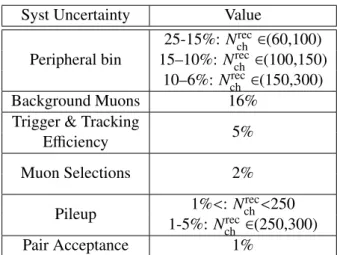
Syst Uncertainty Value
25-15%: N ch rec ∈(60,100) Peripheral bin 15–10%: N ch rec ∈(100,150)
10–6%: N ch rec ∈(150,300)
Background Muons 16%
Trigger & Tracking E ffi ciency 5%
Muon Selections 2%
Pileup 1% < : N ch rec < 250 1-5%: N ch rec ∈(250,300)
Pair Acceptance 1%
Table 2: List of systematic uncertainties on the h–µ v 2,2 for 0.5 < p a T < 5 GeV and 4 < p µ T < 6 GeV.
rec
N
ch0 50 100 150 200 250 300
2,2
v
0 0.005 0.01
Correlations) h
- h
<5 GeV (
b
p
T0.5<
Correlations) - µ
h
<6 GeV (
µ
p
T4<
ATLAS Preliminary
=8.16 TeV, 171 nb
-1s
NN+Pb p
<5 GeV
a
p
T0.5<
rec
N
ch0 50 100 150 200 250 300
)
b Tp (
2v
0 0.05 0.1
Correlations) h
- h
<5 GeV (
b
p
T0.5<
Correlations) - µ
h
<6 GeV (
µ
p
T4<
ATLAS Preliminary
=8.16 TeV, 171 nb
-1s
NN+Pb p
<5 GeV
a
p
T0.5<
Figure 6: Left panel: the v 2,2 obtained from the template fits to h–h correlations with 0.5 < p a,b T < 5 GeV(circles) and to h–µ correlations with 0.5 < p a T < 5 GeVand 4 < p µ T < 6 GeV(squares). Right panel: the corresponding v 2 values for the associated particle. The error bars and shaded bands indicate statistical and systematic uncertainties, respectively.
For the h–h correlations, the statistical errors are too small to be seen.
the muons. For the muons, over this p T range the measurements are consistent with no N ch rec dependence down to N ch rec = 60.
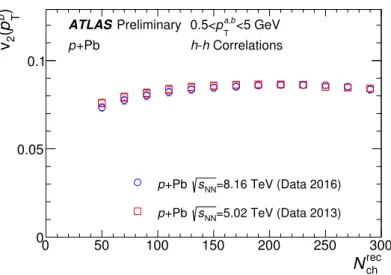
Figure 7 shows a comparison of the v 2,2 values measured in h–h correlations in the present study at
√ s NN =8.16 TeV to those measured at √
s NN =5.02 TeV recorded by ATLAS during Run 1 [7]. The mea- sured v 2 values at the two collision energies are quite similar and the di ff erence between them is covered by the systematic uncertainties. This independence of the v 2,2 from the collision energy was also observed in pp [6, 7] and Pb+Pb collisions [40].
Figure 8 shows the p T dependence of the muon-v 2 for 4 < p µ T < 8 GeV measured in a broad multiplicity in- terval of N ch rec >100. Significant v 2 values are observed over this p T range, which decrease with increasing muon-p T .
A systematic study of the ∆ η dependence of the v n,n can also help in determining the origin of the long-
range correlation. If it arises from mechanisms that only correlate a few particles in an event, such as jets
and dijets, then a strong dependence of the correlation on the ∆ η gap between particle pairs is expected.
rec
N ch
0 50 100 150 200 250 300
) b T p ( 2 v
0 0.05 0.1
=8.16 TeV (Data 2016) s
NN+Pb p
=5.02 TeV (Data 2013) s
NN+Pb p ATLAS Preliminary p +Pb
<5 GeV
b , a
p
T0.5<
Correlations - h
h
Figure 7: Comparison of the v 2 values obtained in p+ Pb collisions at 8.16 TeV to those obtained in p+ Pb collisions at 5.02 TeV, as a function of N rec ch . Plots are for charged tracks with 0.5 < p b T < 5 GeV. The error bars and shaded bands indicate statistical and systematic uncertainties, respectively.
[GeV]
µ
p T
4 4.5 5 5.5 6 6.5 7 7.5 8
) µ T p ( 2 v
0 0.02 0.04 0.06
0.08 ATLAS Preliminary
=8.16 TeV, 171 nb
-1s
NN+Pb p
<5 GeV
a
p
T0.5<
100
rec
≥ N
chCorrelations - µ
h
Figure 8: The p T dependence of the muon-v 2 integrated over a broad multiplicity range of N ch rec > 100. The error
bars and shaded bands indicate statistical and systematic uncertainties, respectively.
η |
| ∆
1 1.5 2 2.5 3 3.5 4 4.5 5
2,2
v
0 0.005 0.01
Template Fits Fourier Transform
ATLAS Preliminary
=8.16 TeV, 171 nb
-1s
NN+Pb p
Correlations h
- h
100
rec
≥ N
ch<5 GeV
b , a
p
T0.5<
ATLAS Preliminary
=8.16 TeV, 171 nb
-1s
NN+Pb p
Correlations h
- h
100
rec
≥ N
ch<5 GeV
b , a
p
T0.5<
η |
| ∆
1 1.5 2 2.5 3 3.5 4 4.5 5
2
v
0.05 0.1
Template Fits Fourier Transform
ATLAS Preliminary
=8.16 TeV, 171 nb
-1s
NN+Pb p
Correlations h
- h
100
rec
≥ N
ch<5 GeV
b , a
p
T0.5<
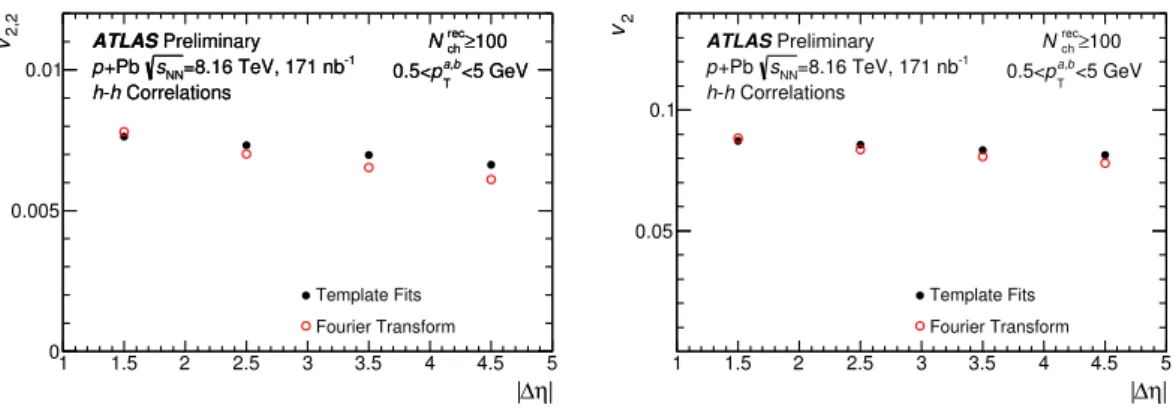
Figure 9: The | ∆ η| dependence of the v 2,2 (left panel) and v 2 (right panel) for the h–h correlations. The Fourier-v 2,2
values are also shown for comparison. Only the range | ∆ η| > 1 is shown to suppress the large Fourier-v 2,2 at | ∆ η|∼0 that arise due to the near-side jet peak. Plots are for the N ch rec > 100 multiplicity range and for 0.5 < p a,b T < 5 GeV. The error bars indicate statistical uncertainties only.
The ∆ η dependence is studied by restricting the integration limits used in Eq. 4, to obtain correlation functions over different ∆ η ranges, and subsequently performing the template fitting procedure for each of them. Figure 9 shows the |∆ η | dependence of the v 2,2 (left panel) and v 2 (right panel) for h–h correlations over a broad multiplicity range of N ch rec > 100. Also shown for comparison are the v 2,2 values obtained from a direct Fourier transform of the correlation function, without any removal of the dijet contribution (or equivalently by setting F =0 in Eq. 5). The v 2,2 and v 2 values show only a weak dependence on ∆ η indicating that they are indeed long-range correlations. Further only a small di ff erence is seen between the Fourier and template-v 2,2 values, which suggests that over this p T and multiplicity range suppression of the dijet contribution has minimal influence on the v 2,2 .
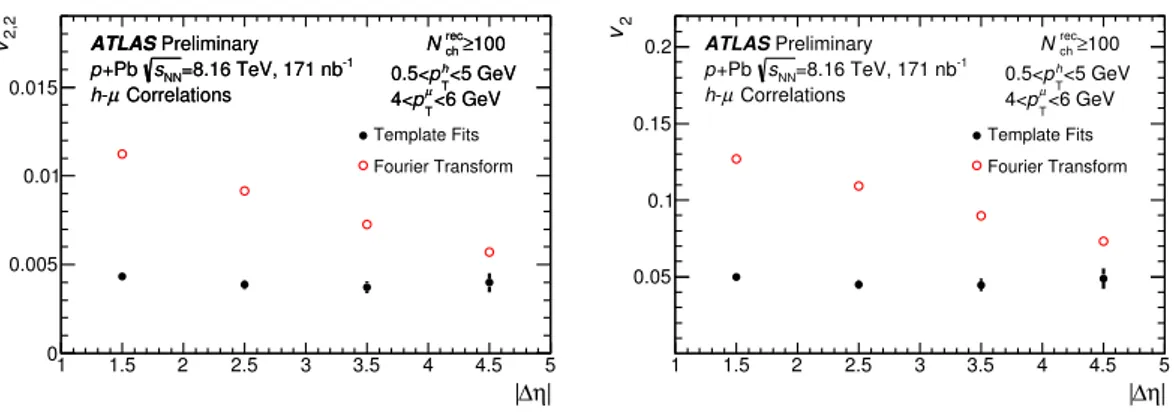
Similar plots are shown for the h–µ correlations in Figure 10 for 0.5 < p a T < 5 GeVand 4 < p µ T < 6 GeV. Here a significant dependence of the Fourier-v 2,2 on ∆ η is observed. On the other hand the template-v 2,2 vary by less than 10% over the whole ∆ η range. This indicates the presence of a strong bias in the Fourier-v 2,2
values from dijets, which are accounted for and removed in the template fits. The larger dijet contribution to the h–µ compared to the h–h correlations presumably arises because the production of the muons is via harder processes than that for the inclusive hadrons. Additionally, the higher p T of the muons, compared to the inclusive hadrons used as associated particles in Figure 9, also has a role to play in the stronger ∆ η dependence for h–µ correlations.
7 Summary
In summary, this note presents ATLAS measurements of azimuthal anisotropy of charged particles and muons in p + Pb collisions at √
s NN = 8.16 TeV using an integrated luminosity of 171 nb −1 . Anisotropies are measured using the two-particle correlation method including a template fitting procedure to remove the contribution from dijets to the correlation. The v 2 values for inclusive charged particles are consistent with prior measurements at √
s NN = 5.02 TeV within systematic uncertainties. Significant v 2 values are
observed for muons over the transverse momentum interval 4< p µ T <8 GeV and over the 100–300 N ch rec
range. The muon-v 2 values are largest at 4 GeV and decrease with increasing p T . Given that nearly all
the prompt muons over this p T range are produced from decay of heavy-flavor particles, these results
η |
| ∆
1 1.5 2 2.5 3 3.5 4 4.5 5
2,2
v
0 0.005 0.01 0.015
Template Fits Fourier Transform
ATLAS Preliminary
=8.16 TeV, 171 nb
-1s
NN+Pb p
Correlations - µ
h
100
rec
≥ N
ch<5 GeV
h
p
T0.5<
<6 GeV
µ
p
T4<
ATLAS Preliminary
=8.16 TeV, 171 nb
-1s
NN+Pb p
Correlations - µ
h
100
rec
≥ N
ch<5 GeV
h
p
T0.5<
<6 GeV
µ
p
T4<
η |
| ∆
1 1.5 2 2.5 3 3.5 4 4.5 5
2
v
0.05 0.1 0.15 0.2
Template Fits Fourier Transform
ATLAS Preliminary
=8.16 TeV, 171 nb
-1s
NN+Pb p
Correlations - µ
h
100
rec
≥ N
ch<5 GeV
h
p
T0.5<
<6 GeV
µ