ATLAS-CONF-2014-021 20May2014
ATLAS NOTE
ATLAS-CONF-2014-021
May 18, 2014
Measurement of long-range pseudorapidity correlations and azimuthal harmonics in √
s
NN= 5.02 TeV proton-lead collisions with the ATLAS detector
The ATLAS Collaboration
Abstract
Measurements of two-particle correlation functions and the first five azimuthal harmon- ics,
v1to
v5, are presented, using 28 nb
−1of
p+Pb collisions at
√sNN=
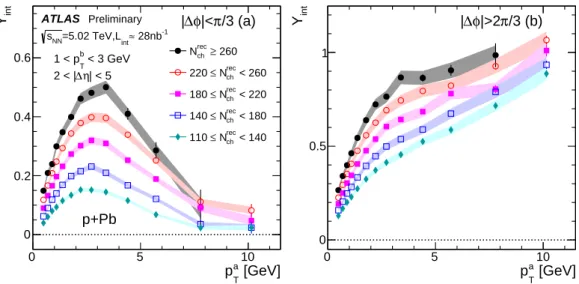
5.02 TeV measured in the ATLAS detector at the LHC. Significant long-range “ridge-like” correlations are ob- served for pairs with small relative azimuthal angle (|
∆φ| < π/3) and back-to-back pairs(|
∆φ| >2π/3) over the transverse momentum range
pT <12 GeV and in di
fferent intervals of event activity. The event activity is defined by either the number of reconstructed tracks or the total transverse energy on the Pb-fragmentation side. The azimuthal structure of such long-range correlation is Fourier decomposed to obtain the harmonics
vnas a function of
pTand event activity. The extracted
vnvalues for
n =2 to 5 are found to decrease with
n. Thev2and
v3values are found to be positive in the measured
pTrange. The
v1is also measured as a function of
pTand is observed to change sign around
pT ≈1.5–2.0 GeV and then increase to about 0.1 for
pT >4 GeV. The
v2(
pT),
v3(
pT) and
v4(p
T) are compared to the
vncoefficients in Pb+Pb collisions at
√sNN =
2.76 TeV with similar event multiplicity.
Reasonable agreement is observed after accounting for the difference in their average
pT.
c
Copyright 2014 CERN for the benefit of the ATLAS Collaboration.
Reproduction of this article or parts of it is allowed as specified in the CC-BY-3.0 license.
1 Introduction
One striking observation in high-energy nucleus-nucleus (A
+A) collisions is the large anisotropy of particle production in the azimuthal angle φ [1, 2]. This anisotropy is often studied via a two-particle cor- relation of particle pairs in relative pseudorapidity (∆ η) and azimuthal angle (∆ φ) [3, 4]. The anisotropy manifests itself as a strong excess of pairs at
∆φ
∼0 and π, and the magnitude of the excess is relatively constant out to large
|∆η| [5–9]. The azimuthal structure of this “ridge-like” correlation is commonly characterized by its Fourier harmonics,
dNpairs/d
∆φ
∼1
+2
Pn
v
2ncos
n∆φ. While the elliptic flow, v
2, and triangular flow, v
3, are the dominant harmonics in A
+A collisions, significant v
1, v
4, v
5and v
6har- monics have also been measured [8–13]. These v
nvalues are commonly interpreted as the collective hydrodynamic response of the created matter to the collision geometry and its density fluctuations in the initial state [14]. The success of hydrodynamic models in describing the anisotropy of particle produc- tion in heavy-ion collisions at RHIC and the LHC places important constraints on the transport properties of the produced matter [15–20].
For a small collision system, such as proton-proton (p
+p) or proton-nucleus (p+A) collisions, it was assumed that the transverse size of the produced system is too small for the hydrodynamic flow description to be applicable. Thus, it came as a surprise that ridge-like structures were also observed in two-particle correlations in high-multiplicity
p+p[21] and proton-lead (p
+Pb) [22–24] collisions at the LHC and later in deuteron-gold collisions [25] at RHIC. A Fourier decomposition technique has been employed to study the azimuthal distribution of the ridge in
p+Pb collisions. The transverse momentum(
pT) dependence of the extracted v
2and v
3[23,24], and the particle-mass dependence of v
2[26] are found to be similar to those measured in A
+A collisions. Large v
2coe
fficients are also measured via the four- particle cumulant method [27, 28], suggesting that the ridge reflects genuine multi-particle correlation.
The interpretation of the long-range correlations in high-multiplicity
p+pand
p+Pb collisions is currently a subject of intense study. Refs. [29–32] argue that the produced matter in these collisions is sufficiently large and dense such that the hydrodynamic model framework may still apply. On the other hand, models based on gluon saturation and color connections suggest that the long-range correlations are an initial state e
ffect, intrinsic to QCD at high gluon density [33–37]. Recently a hybrid model that takes into account both the initial and final state effects has been proposed [38]. All these approaches can describe, qualitatively and even quantitatively, the v
2and v
3data in the
p+Pb collisions.In order to provide more insights on the nature of the ridge correlation and to discriminate between different theoretical interpretations, this paper provides a detailed measurement of the two-particle cor- relation and v
ncoefficients in
p+Pb collisions at √sNN =
5.02 TeV. The data correspond to an integrated luminosity of approximately 28 nb
−1, recorded in 2013 by the ATLAS experiment at the LHC. This measurement benefits from a dedicated high-multiplicity trigger that provides a large sample of high- multiplicity events, not only extending the previous v
2and v
3results to higher
pT, but also enabling the first measurement of v
1, v
4and v
5. The results are extracted independently for two di
fferent event- activity definitions: the total transverse energy in the forward calorimeter on the Pb-fragmentation side
1(3.2 < η < 4.9),
ETPb, or the number of reconstructed tracks in
|η|< 2.5,
Nchrec. The results are also com- pared to the Pb
+Pb data with similar multiplicity. The analysis technique follows closely the previous ATLAS study of v
2and v
3based on a much smaller dataset from a short
p+Pb run in 2012 [24].1ATLAS uses a right-handed coordinate system with its origin at the nominal interaction point (IP) in the centre of the detector and thez-axis along the beam pipe. The incident Pb beam travels in the+z direction. Thex-axis points from the IP towards the center of the LHC ring, and they-axis completes the right-handed system. Cylindrical coordinates (r, φ) are used in the transverse plane,φbeing the azimuthal angle around the beam pipe. The pseudorapidity is defined in the laboratory coordinates in terms of the polar angleθasη=−ln tan(θ/2).
2 Experimental setup
2.1 Detector and dataset
The ATLAS detector [39] provides nearly full solid-angle coverage of the collision point with tracking detectors, calorimeters and muon chambers. The measurements presented in this paper are performed using the ATLAS inner detector (ID), forward calorimeters (FCal), minimum-bias trigger scintillators (MBTS), zero-degree calorimeter (ZDC) and the trigger and data acquisition systems. The ID measures charged particles within the pseudorapidity region
|η|< 2.5 using a combination of silicon pixel detectors, silicon micro-strip detectors, and a straw-tube transition radiation tracker, all immersed in a 2 T axial magnetic field. The MBTS detects charged particles over 2.1 <
|η|< 3.9 using two hodoscopes of 16 counters positioned at
z = ±3.6 m. The FCal consists of two sections that cover 3.2<
|η|< 4.9. The FCal modules are composed of tungsten and copper absorbers with liquid argon as the active medium, which provide 10 interaction lengths of material. The ZDC, situated at
≈140 m from the collision vertex, detects neutral particles, mostly neutrons and photons, with
|η|> 8.3.
This analysis uses approximately 28
nb−1of
p+Pb data recorded by the ATLAS experiment at theLHC in 2013. The LHC was configured with a 4 TeV proton beam and a 1.57 TeV per-nucleon Pb beam that together produced collisions with a nucleon–nucleon centre-of-mass energy of
√sNN =
5.02 TeV.
The beam directions were reversed approximately half-way through the running period. The higher energy of the proton beam results in a net rapidity shift of the nucleon–nucleon centre-of-mass frame relative to the ATLAS rest frame. This rapidity shift is 0.47 towards the proton beam direction.
2.2 Trigger
The minimum-bias (MB) Level-1 (L1) trigger [40] used for this analysis requires a signal in at least one MBTS counter on each side, or a signal in the ZDC on the Pb-fragmentation side with the trigger threshold set just below the peak corresponding to a single neutron. A timing requirement based on signals from each side of the MBTS is imposed to suppress beam backgrounds. Due to the high event rate during the run, only a small fraction of the MB events (∼1/1000) were recorded. In order to enhance the statistics of events with high multiplicity, a dedicated high-multiplicity trigger (HMT) was implemented which uses the ATLAS L1 and high-level trigger (HLT) systems [41]. At L1, the total transverse energy
EL1Tin the FCal rapidity interval is required to be above a certain threshold. In the HLT, the charged particle tracks are reconstructed by requiring at least two hits in the pixel detector and three hits in the semiconductor tracker (SCT). For each event, the collision vertex reconstructed with the highest number of online tracks is selected, and the number of tracks (N
trkHLT) associated with this vertex with
pT> 0.4 GeV and the distance of closest approach of less than 4 mm is calculated.
The HMT triggers are implemented by requiring di
fferent thresholds on the values of
ETL1and
NtrkHLTwith prescale factors adjusted to the instantaneous luminosity provided by the LHC [41]. This analysis uses the following six pairs of thresholds on
EL1Tand
NtrkHLTlisted in Table 1. The
NtrkHLT ≥225 trigger was not prescaled throughout the entire running period.
NtrkHLT ≥100 ≥130 ≥150 ≥180 ≥200 ≥225
ETL1
[GeV]
≥10 ≥10 ≥50 ≥50 ≥65 ≥65Table 1: A list of thresholds in
ETL1and
NtrkHLTfor the high-multiplicity triggers used in this analysis.
3 Data analysis
3.1 Event and track selections
In the o
ffline analysis,
p+Pb events are required to have a reconstructed vertex containing at least two associated o
ffline tracks, with its
zposition satisfying
|zvtx|< 150 mm. Non-collision backgrounds and photonuclear interactions are suppressed by requiring at least one hit in a MBTS counter on each side of the interaction point, and the di
fference between times measured on the two sides to be less than 10 ns.
In the 2013
p+Pb run, the luminosity conditions provided by the LHC result in an average probability of 3% that an event contains two or more
p+Pb collisions (pileup). The pileup events are suppressedby rejecting events containing more than one good reconstructed vertex. The remaining pileup events are further suppressed based on the signal in the ZDC on the Pb-fragmentation side. This signal has been calibrated to the number of detected neutrons (N
n) based on the location of the peak corresponding to a single neutron. The distribution of
Nnin events with pileup is broader than that for the events without pileup. Hence a simple cut on the high tail-end of the ZDC signal distribution further suppresses the pileup, while maintaining more than 98% of the events without pileup. After this pileup rejection procedure, the residual pileup fraction is estimated to be
.10
−2in the event class with the highest track multiplicity studied in this analysis. About 57 million MB-selected events and 15 million HMT-selected events are included in this analysis.
Charged particle tracks are reconstructed in the ID using an algorithm optimized for
p+pminimum- bias measurements [42]: the tracks are required to have
pT> 0.3 GeV and
|η|< 2.5, at least seven hits in the silicon detectors, and a hit in the first pixel layer when one is expected. In addition, the transverse (d
0) and longitudinal (z
0sin θ) impact parameters of the track from the vertex are required to be less than 1.5 mm. They are also required to satisfy
|σd0d0
|
< 3 and
|z0σsinθz |
< 3, respectively, where σ
d0and σ
zare uncertainties on
d0and
z0sin θ obtained from the track-fit covariance matrix.
The efficiency, (
pT, η), for track reconstruction and track selection cuts is obtained using
p+PbMonte-Carlo events produced with the version 1.38b of the HIJING event generator [43] with a centre-of- mass boost matching the beam conditions. The response of the detector is simulated using GEANT4 [44, 45] and the resulting events are reconstructed with the same algorithms as applied to the data. The e
fficiency increases with
pTby 6% between 0.3 and 0.5 GeV, and varies only weakly for
pT> 0.5 GeV, where it ranges from 82% at η
=0 to 70% at
|η|=2 and 60% at
|η|> 2.4. The e
fficiency is also found to vary by less than 2% over the multiplicity range used in the analysis. The extracted efficiency function (p
T, η) is used in the correlation analysis, as well as to estimate the average e
fficiency-corrected charged particle multiplicity in the collisions.
3.2 Characterization of the event activity
The two-particle correlation (2PC) analyses are performed in event classes with different overall activity.
The event activity is characterized by either
EPbT, the sum of transverse energy measured on the Pb- fragmentation side of the FCal with 3.2 < η < 4.9, or
Nchrec, the o
ffline-reconstructed track multiplicity in the ID with
|η|< 2.5 and
pT> 0.4 GeV. These event-activity definitions have been used in previous
p+Pbanalyses [21, 22, 24, 27, 28]. Events with larger activity have
on averagea larger number of participating nucleons on the Pb nuclei and a smaller impact parameter. Hence the term “centrality”, familiar in A
+A collisions, is used to refer to the event activity. The terms “central” and “peripheral” are used to refer to events with large activity and small activity, respectively.
Due to the wide range of trigger thresholds and the prescale values required by the HMT triggers,
the
ETPband
Nchrecdistributions are very di
fferent between the HMT events and the MB events. In order to
properly include the HMT events in the event-activity classification, an event-by-event weight, w
=1/P,
is utilized. The combined probability,
P, for a given event to be accepted by the MB trigger or any of therec
Nch
0 100 200 300
Events
1 10 102
103
104
105
106
w/o weighting MB MB+HMT (a)
[GeV]
Pb
ET
0 100 200
Events
1 10 102
103
104
105
106
w/o weighting (c)
rec
Nch
0 100 200 300
Events
1 102
104
106
108
109 re-weighted
(b) ATLAS Preliminary
=5.02 TeV sNN
p+Pb 28 nb-1 int≈ >65 GeV L
L1
>225, ET HLT
Ntrk
>65 GeV
L1
>200, ET HLT
Ntrk
>50 GeV
L1
>180, ET HLT
Ntrk
>50 GeV
L1
>150, ET HLT
Ntrk
>10 GeV
L1
>130, ET HLT
Ntrk
>10 GeV
L1
>100, ET HLT
Ntrk
[GeV]
Pb
ET
0 100 200
Events
1 102
104
106
108
109 re-weighted
(d) ATLAS Preliminary
=5.02 TeV sNN
p+Pb 28 nb-1 int≈ L
Figure 1: The distributions of
Nchrec(left panels) and
EPbT(right panels) for MB and MB
+HMT events before (top panels) and after (bottom panels) applying an event-by-event weight (see text). The smaller symbols in the top panels represent the distributions from the six HMT triggers listed in Table 1.
HMT triggers is calculated via the inclusion-exclusion principle as:
P= X
1≤i≤N
pi− X
1≤i<j≤N
pipj+ X
1≤i<j<k≤N
pipjpk−
... , (1)
where
Nis the total number of triggers, and
piis the probability for the
ith-trigger to accept the event, defined as zero if the event does not fire the trigger and otherwise as the inverse of the prescale factor of the trigger. The higher-order terms in Eq. 1 account for the probability of more than one trigger being fired. The weight factor, w, is calculated and applied event by event. The distribution for all events after re-weighting has the same shape as the distribution for MB events, as should be the case if the re-weighting is done correctly.
Figure 1 shows the distribution of
Nchrec(left panels) and
EPbT(right panels) for the MB and MB+HMT
events before (top panels) and after (bottom panels) the re-weighting procedure. For MB-selected events,
the re-weighted distribution di
ffers from the original distribution by a constant factor, reflecting the aver-
age prescale. The multiple steps in the
Nchrecdistribution (top-left panel) reflect the rapid turn-on behaviour
of individual HMT triggers in
Nchrec. The broad shoulder in the
ETPbdistribution (top-right panel) is due to the finite width of the
Nchrec–E
PbTcorrelation which smears the contributions from di
fferent HMT triggers in
EPbT. All these structures disappear after the re-weighting procedure. The results of this analysis are obtained using the MB+HMT combined dataset, with event re-weighting.
Due to the relatively slow turn-on of the HMT triggers as a function of
EPbT(Fig. 1(c)), the events selected in a given
EPbTrange typically receive contributions from several HMT triggers with very different weights. Hence the effective gain in event statistics from the HMT triggers in the large
EPbTregion is much smaller than the gain in the large
Nchrecregion.
Figure 2(a) shows the correlation between
ETPband
Nchrecfrom MB+HMT
p+Pb events after the re-weighting procedure. This distribution is similar to that obtained for the MB events, except that the HMT triggers greatly extend the reach in both quantities. The
EPbTvalue grows with increasing
Nchrec, suggesting that, on average,
EPbTin the nucleus direction correlates well with the particle production at mid-rapidity.
On the other hand, the broad distribution of
EPbTat fixed
Nchrecalso implies significant fluctuations. To study the relation between
EPbTand
Nchrec, events are divided into narrow bins in
Nchrec, and the mean and root-mean-square values of the
ETPbdistribution are calculated for each bin. The results are shown in Fig. 2(b). A nearly linear relation between
DEPbTE
and
Nchrecis observed. This relationship is used to match a given
Nchrecevent class to the corresponding
EPbTevent class. This approximately linear relation can also be parameterized (indicated by the solid line in Fig. 2(b)) as:
DETPbE
/GeV
≈0.60N
chrec. (2)
rec
Nch
0 100 200 300 400
[GeV]Pb TE
0 100 200 300
1 102
104
106
108
109
ATLAS Preliminary
=5.02 TeV sNN
28 nb-1 int≈ L
p+Pb
MB+HMT, re-weighted (a)
rec
Nch
0 100 200 300
[GeV]Pb TEσ or 〉Pb TE〈
0 50 100 150 200
ATLAS Preliminary
=5.02 TeV sNN
, p+Pb 28 nb-1 int≈ L
〉
Pb
ET
〈
Pb
ET
σ
≈ 0.6 Linear fit, slope (b)
Figure 2: (a) Correlation between
EPbTand
Nchrecin MB
+HMT events obtained via the re-weighting procedure. (b) The mean
DETPbE
and root-mean-square σ
EPbT
of the
EPbTdistributions for slices of
Nchrec. The line is a linear fit to all points.
The 2PC analysis is performed in di
fferent intervals of the event activity defined by either
EPbTor
Nchrec. Table 2 gives a list of representative event-activity classes, together with the fraction of MB+HMT
events (after re-weighting as shown in Fig. 2(a)) contained in each event class. The table also provides
the average
Nchrecand
EPbTvalues for each event-activity class, as well as the e
fficiency-corrected number
of charged particles within
|η|< 2.5 and
pT> 0.4 GeV,
hNchi. The event classes defined in narrow
EPbTor
Nchrecranges are used for detailed studies of the centrality dependence of the 2PC, while the event classes
in broad
EPbTor
Nchrecranges are optimized for the studies of the
pTdependence. Due to the relatively
poorer e
ffective statistics at large
ETPbthan that at large
Nchrec, the main results in this paper are presented
for event classes defined in
Nchrec.
Event-activity classes based onNchrec Event-activity classes based onEPbT Nchrecrange fraction hEPbTi hNchreci hNchi ETPbrange fraction hEPbTi hNchreci hNchi
[GeV] [GeV] [GeV]
[0,20) 0.31 7.3 10.3 12.6±0.6 <10 0.28 4.8 12.4 15.4±0.7 [20,40) 0.27 18.6 29.1 37.9±1.7 [10,23) 0.26 16.1 29.2 38.1±1.7 [40,60) 0.19 30.8 48.8 64.3±2.9 [23,37) 0.19 29.5 47.3 62.3±2.8 [60,80) 0.12 42.8 68.6 90.7±4.1 [37,52) 0.12 43.8 64.0 84.7±3.8 [80,100) 0.064 54.9 88.3 117±5 [52,68) 0.067 58.8 80.4 107±5 [100,120) 0.029 66.4 108 144±7 [68,83) 0.028 74.2 96.1 128±6 [120,140) 0.011 78.4 128 170±8 [83,99) 0.012 89.7 111 147±7 [140,160) 0.0040 90.3 148 196±9 [99,116) 0.0043 106 126 168±8 [160,180) 0.0013 102 168 223±10 [116,132) 0.0012 122 141 187±8 [180,200) 3.6×10⁻⁴ 113 187 249±11 [132,148) 3.6×10⁻⁴ 138 155 206±9 [200,220) 9.4×10⁻⁵ 125 207 276±12 [148,165) 1.0×10⁻⁴ 155 169 225±10 [220,240) 2.1×10⁻⁵ 134 227 303±14 [165,182) 2.2×10⁻⁵ 171 184 244±11 [240,260) 4.6×10⁻⁶ 145 247 329±15 [182,198) 4.6×10⁻⁶ 188 196 261±12 [260,290) 1.1×10⁻⁶ 157 269 358±16 [198,223) 1.1×10⁻⁶ 206 211 281±13 [290,370) 8.9×10⁻⁸ 174 301 393±18 [223,300) 9.6×10⁻⁸ 232 230 306±14 [0,40) 0.58 12.5 19.0 24.4±1.1 <25 0.59 10.2 21.7 28.0±1.3 [40,80) 0.32 35.3 56.4 74.4±3.3 [25,50) 0.27 35.1 54.7 72.2±3.3 [80,110) 0.081 56.8 91.7 122±6 [50,75) 0.096 61.5 81.4 108±5 [110,140) 0.023 74.2 121 161±7 [75,100) 0.025 84.5 106 141±6 [140,180) 0.0053 93.0 153 203±9 [100,130) 0.0051 110 130 173±8 [180,220) 4.6×10⁻⁴ 116 192 255±12 [130,165) 5.6×10⁻⁴ 141 156 208±9 [220,260) 2.6×10⁻⁵ 136 231 307±14 [165,200) 2.7×10⁻⁵ 174 186 248±11 [260,370) 1.2×10⁻⁶ 158 271 361±16 [200,300) 1.0×10⁻⁶ 208 214 284±13
Table 2: A list of event-activity classes defined in
Nchrec(left) and
ETPb(right) ranges. For each event class, the fraction of MB+HMT events after trigger re-weighting (Fig. 2(a)), the average values of
hEPbTiand
hNchreci, and the efficiency-corrected average number of charged particles with pT> 0.4 GeV and
|η|
< 2.5,
hNchi, are also listed.3.3 Two-particle correlation
For a given event class, the two-particle correlations are measured as a function of relative azimuthal angle,
∆φ
=φ
a−φ
b, and relative pseudorapidity,
∆η
=η
a−η
b, with
|∆η| ≤ η
max∆ =5. The labels
aand
bdenote the two particles in the pair, which may be selected from different
pTintervals. The particles
aand
bare conventionally referred to as “trigger” and “associated” particles, respectively. The correlation strength, expressed in terms of the number of pairs per trigger particle, is defined as [4–6]:
Y(∆
φ,
∆η)
=R B(∆
φ,
∆η)d
∆φd
∆η πη
max∆S
(
∆φ,
∆η)
B(∆φ,
∆η)
!
,
Y(
∆φ)
=R B(∆
φ)d
∆φ π
S
(
∆φ)
B(∆φ)
!
, (3)
where
Sand
Brepresent pair distributions constructed from the same event and from “mixed events”
[4], respectively, which are then normalized by the number of trigger particles in the event. These
distributions are also referred as per-trigger yield distributions. The mixed-event distribution,
B(∆φ,
∆η),
measures the distribution for uncorrelated pairs. The
B(∆φ,
∆η) distribution is constructed by choosing
the two particles in the pair from different events of similar
Nchrec(match to
|∆Nchrec|< 10 tracks),
ETPb(match
to
|∆EPbT|< 10 GeV), and
zvtx(match to
|∆zvtx|< 1 cm), so that
B(∆φ,
∆η) properly reflects the known
detector effects in
S(∆ φ,
∆η). The one-dimensional (1-D) distributions
S(∆ φ) and
B(∆φ) are obtained
by integrating
S(∆ φ,
∆η) and
B(∆φ,
∆η), respectively, over a
∆η range. The region
|∆η| < 1 is chosen
to focus on the short-range features of the correlation functions, while the region
|∆η| > 2 is chosen to
focus on the long-range features of the correlation functions. These two regions are hence referred to as
“short-range region” and “long-range region”, respectively. The normalization factors in front of the
S/B ratio are chosen such that the (∆ φ,
∆η)-averaged value of
B(∆φ,
∆η) and
∆φ-averaged value of
B(∆φ) are both unity. When measuring
Sand
B, pairs are filled in one quadrant of the (∆φ,
∆η) space and then reflected to the other quadrants [24]. To correct
S(
∆φ,
∆η) and
B(∆φ,
∆η) for the individual ine
fficiencies of particles
aand
b, the pairs are weighted by the inverse product of their tracking efficiencies 1/(ab).
Remaining detector distortions not accounted for in the efficiency largely cancel in the
S/B ratio.
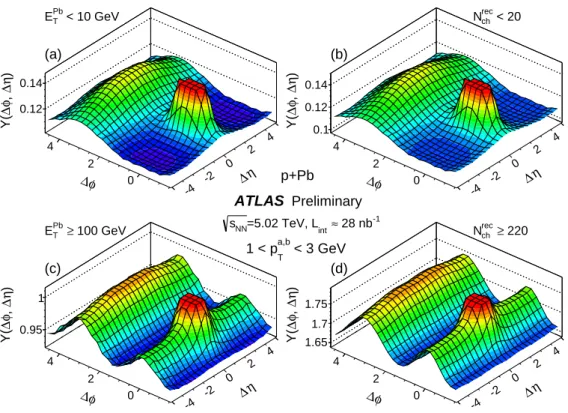
Examples of two-dimensional (2-D) correlation functions are shown in Fig. 3 for charged particles with 1 <
pa,bT< 3 GeV in low-activity events,
EPbT< 10 GeV or
Nchrec< 20 in the top panels, and high-activity events,
ETPb> 100 GeV or
Nchrec> 220 in the bottom panels. The correlation for low- activity events shows a sharp peak centred at (
∆φ,
∆η)
=(0, 0) due to short-range correlations for pairs resulting from jets, high-p
Tresonance decays, and Bose-Einstein correlations. The correlation function also shows a broad structure at
∆φ
∼π from low-p
Tresonances, dijets, and momentum conservation that is collectively referred to as “recoil” [24] in the remainder of this paper. In the high-activity events, the correlation reveals a flat ridge-like structure at
∆φ
∼0 (the “near-side”) that extends over the full measured
∆η range. This
∆η independence is quantified by integrating the 2-D correlation functions over
|∆φ| < 1 to obtain
Y(∆η)
=R|∆φ|<1Y(∆
φ,
∆η)
∆φ. The yield associated with the near-side short-range
correlation peak centred at (∆ φ,
∆η)
=(0, 0) can then be estimated as:
YN−Peak =Z
|∆η|<1Y
(∆ η)d
∆η
−1
5
−η
min∆ Zηmin∆ <|∆η|<5Y(∆
η)d
∆η , (4)
where the second term accounts for the contribution of uncorrelated pairs and the ridge component under the near-side peak. The default value of
YN−Peakis obtained with η
min∆ =2, but the value of η
min∆is varied from 2 to 4 to check the stability of
YN−Peak. The distribution at
∆φ
∼π (the “away-side”) is also broadened in high-activity events, consistent with the presence of a long-range component in addition to the recoil component [24]. This recoil component can be estimated from the low-activity events and subtracted from the high-activity events using the procedure detailed in the next section.
3.4 Recoil subtraction
The correlated structure above a flat pedestal in the correlation functions is calculated using a zero-yield- at-minimum (ZYAM) method [4, 46] following previous measurements [22–24]:
Ycorr
(∆ φ,
∆η)
=R B(∆
φ,
∆η)d
∆φd
∆η πη
max∆S
(
∆φ,
∆η)
B(∆
φ,
∆η)
−bZYAM!
,
Ycorr(∆ φ)
=R B(∆
φ)d
∆φ π
S
(
∆φ)
B(∆
φ)
−bZYAM!
, (5) where the parameter
bZYAMrepresents the pedestal formed by uncorrelated pairs. A second-order polyno- mial fit to the 1-D
Y(
∆φ) distribution in the long-range region is used to find the location of the minimum point,
∆φ
ZYAM, and from this the value of
bZYAMis determined and subtracted from the 2-D correlation function. The
Ycorr(∆ φ,
∆η) functions differ, therefore, by a constant from the
Y(∆φ,
∆η) functions, such as those in Fig. 3.
In low-activity events,
Ycorr(∆ φ,
∆η) contains mainly the short-range correlation component and the recoil component. In high-activity events, the contribution from the long-range “ridge” correlation also becomes important. This long-range component of the correlation function in a given event class is obtained by estimating the short-range correlation component using the peripheral events and is then subtracted:
Ysub
(∆ φ,
∆η)
=Y(∆φ,
∆η)
−αY
pericorr(∆ φ,
∆η),
Ysub(∆ φ)
=Y(∆ φ)
−αY
pericorr(∆ φ), (6)
∆φ 0 2 4
∆η
)η∆, φ∆Y(
0.12 0.14
-4 -2 0 2 4 < 10 GeV
Pb
ET
(a)
∆φ 0
2 4
∆η )η∆, φ∆Y( 0.1
0.12 0.14
-4 -2 0 2 4 < 20
rec
Nch
(b)
∆φ 0
2 4
∆η )η∆, φ∆Y( 0.95
1
-4 -2 0 2 4 100 GeV
≥
Pb
ET
(c)
∆φ 0
2 4
∆η )η∆, φ∆Y( 1.65
1.7 1.75
-4 -2 0 2 4
≥ 220
rec
Nch
(d) ATLAS Preliminary
28 nb-1 int≈
=5.02 TeV, L sNN
p+Pb
< 3 GeV
a,b
1 < pT
Figure 3: The 2-D correlation function in the peripheral event class selected by either
EPbT< 10 GeV (a) or
Nchrec< 20 (b) and the central event class selected by either
ETPb ≥100 GeV (c) or
Nchrec≥220 (d).
where the
Ycorrin a low-activity or peripheral event class, denoted as
Ypericorr, is used to estimate and sub- tract (hence the superscript “sub” in Eq. 6) the short-range correlation at the near-side and the recoil at the away-side. The parameter α is chosen to adjust the near-side short-range correlation yield in the periph- eral events to match that in the given event class for each
paTand
pbTcombination, α
=YN−Peak/Y
periN−Peak. This scaling procedure is necessary to account for enhanced short-range correlations and away-side re- coil in higher-activity events, under the assumption that the relative contribution of the near-side short- range correlation and away-side recoil is independent of the event activity. A similar rescaling procedure has also been used by the CMS Collaboration [28]. The default peripheral event class is chosen to be
EPbT<
ET0 =10 GeV. However, the results have also been checked with other
ET0values, as well as with a peripheral event class defined by
Nchrec< 20. In the events with the highest multiplicity, the value of α determined with the default peripheral event class varies from
∼2 at
pT ≈0.5 GeV to
∼1 for
pT> 3 GeV, with a
pT-dependent uncertainty of 3%–5%.
The uncertainty of the
bZYAMonly affects the recoil-subtracted correlation functions through the
Ypericorrterm in Eq. 6. This uncertainty is usually very small in high-activity
p+Pb collisions, due to their much larger pedestal level than for the peripheral event class.
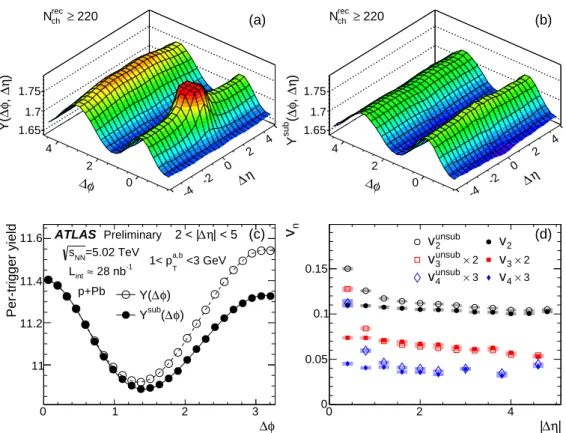
Figures 4(a) and (b) show, respectively, the 2-D correlation functions before and after the subtraction
procedure given by Eq. 6. Most of the short-range peak and away-side recoil structures are removed
by the subtraction, and the remaining distributions exhibit a
∆φ-symmetric double-ridge that is almost
independent of
∆η. Figure 4(c) shows the corresponding 1-D correlation functions before and after recoil
subtraction in the long-range region of
|∆η| > 2. The distribution at the near-side is not a
ffected since the
near-side short-range peak is narrow in η (Fig. 4(a)), while the away-side distribution is reduced due to
the removal of the recoil component.
∆φ 0 2 4
∆η )η∆, φ∆Y( 1.65
1.7 1.75
-4 -2 0 2 4
≥ 220
rec
Nch (a)
∆φ 0
2 4
∆η )η∆, φ∆(sub Y 1.65
1.7 1.75
-4 -2 0 2 4
≥ 220
rec
Nch (b)
φ
0 1 2 3∆
Per-trigger yield
11 11.2 11.4 11.6
φ)
∆ Y(
φ)
∆
sub( Y ATLAS Preliminary
=5.02 TeV sNN
28 nb-1 int≈ L
p+Pb
| < 5 η
∆ 2 < |
<3 GeV
a,b
1< pT
(c)
η|
∆
|
0 2 4
nv
0 0.05 0.1 0.15
unsub
v2
× 2 unsub
v3
× 3 unsub
v4
v2
× 2
v3
× 3
v4
(d)
Figure 4: The 2-D correlation function for events with
Nchrec ≥220 before (a) and after (b) subtraction of the peripheral yield. Panel (c) shows the corresponding 1-D correlation functions for pairs integrated over 2 <
|∆η| < 5 from panels (a) and (b), together with Fourier fits including the first five harmonics.
Panel (d) shows the 2
nd, 3
rdand 4
th-order Fourier coe
fficients for single particles calculated in di
fferent narrow
|∆η| ranges from the 2-D distributions in panels (a) and (b), and the results are shown for both before (open symbols) and after (filled symbols) the subtraction of the peripheral yield. The error bars and shaded boxes are statistical and systematic uncertainties, respectively.
3.5 Extraction of the azimuthal harmonics associated with long-range correlation The azimuthal structure of the long-range correlation is studied via a Fourier decomposition similar to the approach used in the analysis of Pb+Pb collisions [7, 9]:
Ysub
(
∆φ)
=R Ysub
(∆ φ)d
∆φ π
1
+Xn
2v
n,ncos(n
∆φ)
, (7)
where v
n,nare the Fourier coe
fficients calculated via a discrete Fourier transformation:
v
n,n= PNm=1
cos(n
∆φ
m)Y
sub(∆ φ
m)
PNm=1Ysub
(∆ φ
m) , (8)
where
N=24 is the number of
∆φ bins from 0 to π. The first five Fourier coe
fficients are calculated as a function of
paTand
pbTfor each event-activity class.
The azimuthal anisotropy coe
fficients for single particles, v
n, can be obtained via the factorization relation commonly used for heavy ion collisions [7, 9, 47]:
v
n,n(
paT,
pbT)
=v
n(
paT)v
n(p
bT). (9)
From this the v
nfor
n=2–5 are calculated as:
v
n(p
T)
=v
n,n(p
T,
prefT)/
qv
n,n(
prefT,
prefT) , (10)
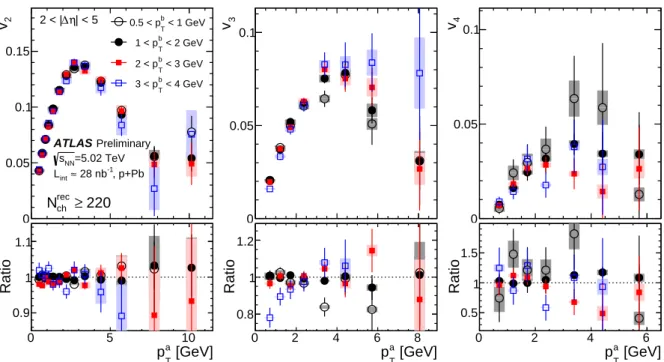
where the default transverse momentum range for the reference particle
prefTis chosen to be 1 <
prefT< 3 GeV. The extraction of v
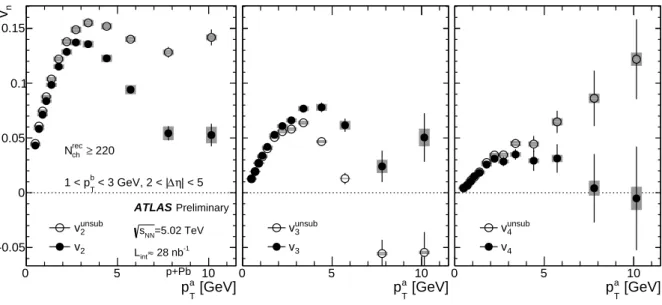
1requires a slight modification and is discussed separately in Section 4.3. A study of the factorization behaviour has been checked by comparing the v
n(
pT) obtained for different
prefTranges (see Fig. 10).
A similar Fourier decomposition procedure is also carried out for correlation functions without pe- ripheral subtraction, i.e.
Y(∆ φ). The harmonics obtained in this way are denoted as v
unsubn,nand v
unsubn, respectively.
Figure 4(d) shows the azimuthal harmonics obtained by Fourier decomposition of the
Y(∆φ,
∆η) and
Ysub(∆ φ,
∆η) distributions in Figs. 4(a)-(b) for different, narrow slices of
∆η. The resulting v
unsubnand v
nvalues are plotted as a function of
∆η for
n =2, 3 and 4. The v
nvalues are much smaller than v
unsubnfor
|∆
η| < 1, reflecting the removal of the short-range correlations at the near-side. The v
2values are also systematically smaller than v
unsub2for
|∆η| > 1, reflecting the removal of the away-side recoil contribution.
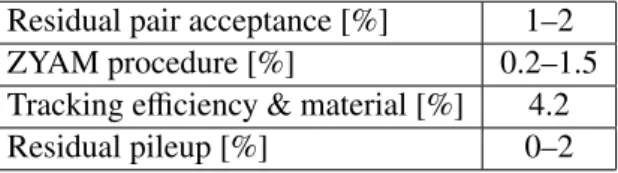
3.6 Systematic uncertainties
The systematic uncertainties in this analysis arise from pair acceptance, the ZYAM procedure, tracking e
fficiency, Monte-Carlo consistency, residual pileup, and the recoil subtraction. Each source is discussed separately below.
The correlation functions rely on the pair acceptance functions,
B(∆φ,
∆η) and
B(∆φ), to reproduce detector acceptance e
ffects in the signal distribution. A natural way of quantifying the influence of detector e
ffects on v
n,nand v
nis to express the single-particle and pair acceptance functions as Fourier series, similar to Eq. 7. The resulting coefficients for pair acceptance v
detn,nare the product of those for the two single-particle acceptances v
det,anand v
det,bn. In general, the pair acceptance function in
∆φ is quite flat: the maximum fractional variation from its average value is observed to be less than 0.001 for pairs integrated in 2 <
|∆η| < 5, and the corresponding
|vdetn,n|values are found to be less than 2
×10
−4. These v
detn,nvalues are expected to mostly cancel in the correlation function, and only a small fraction contributes to the uncertainties of the pair acceptance function. Possible residual effects on the pair acceptance are evaluated following Ref. [9], by varying the criteria for matching in
Nchrec,
EPbT, and
zvtx. In each case, the residual v
detn,nvalues are evaluated by a Fourier expansion of the ratio of the pair acceptances before and after the variation. This uncertainty varies in the range of (5
−8)× 10
−6. It is negligible for v
2and v
3, but become sizable for higher-order harmonics, particularly at low
pT, where the v
nvalues are small.
As discussed in Section 3.4, the value of
bZYAMis determined by a second-order polynomial fit of the
Y(∆ φ) distribution. The stability of the fit is studied by varying the
∆φ range in the fit. The uncertainty in
bZYAMdepends on the local curvature around
∆φ
ZYAM, and is estimated to be 0.0003–0.001 of the minimum value of
Y(∆ φ). This uncertainty contributes directly to
Ycorr(∆ φ), but contributes to
Ysub(∆ φ) and v
nindirectly through the peripheral subtraction (see Eq. 6). The resulting uncertainty on v
nis found to be less than 2%, for all
n.The values of per-trigger yields,
Y(∆φ),
Ycorr(∆ φ), and
Ysub(∆ φ), are sensitive to the uncertainty on
the tracking efficiency correction for the associated particles. This uncertainty is estimated by varying the
track quality cuts and the detector material in the simulation, re-analyzing the data using corresponding
Monte-Carlo e
fficiencies and evaluating the change in the extracted yields. The resulting uncertainty
is estimated to be 2.5% due to the track selection and 2%–3% related to the limited knowledge of the
detector material. The v
n,nand v
nvalues depend only on the shape of the
Ysub(
∆φ) distribution and hence
are not sensitive to the tracking e
fficiency.
Nearly all of the events containing pileup have been removed by the procedure described in Sec- tion 3.1. The influence of the residual pileup is evaluated by relaxing the pileup rejection criteria and then calculating the change in the per-trigger yields and v
nvalues. The differences are taken as an esti- mate of the uncertainty which are found to be negligible in low event-activity classes, and increase to 2%
for events with
EPbT> 200 GeV or
Nchrec> 300.
According to Table 2, the low-activity events used in the peripheral subtraction (E
TPb<
ET0 =10 GeV) correspond to 28% of the MB-triggered events. The pair distributions for these events may contain a small genuine long-range component, leading to a reduction of the long-range correlation signal in a high-activity class via the peripheral subtraction procedure. The influence of this over-subtraction is evaluated by varying the definition of the low-activity events in the range of
ET0 =5 GeV to
E0T=20 GeV.
The
Ysub(
∆φ) and v
nvalues are calculated for each variation. The v
nvalues are found to decrease approx- imately linearly with increasing
E0T. The amount of over-subtraction can be estimated by extrapolating
E0Tto zero. The estimated changes of v
nand
Ysub(∆ φ) vary from less than 1% for
ETPb> 100 GeV or
Nchrec> 150, and increase for lower event-activity classes approximately as 1.5/N
chrec. The relative change of v
nis also found to be independent of
pT. As a cross-check, the analysis is also repeated by defining peripheral events as
Nchrec< 20. The variation of v
nvalues is found to be consistent with the variation from varying
E0T.
The stability of the scale factor, α, is evaluated by varying the
∆η window of the long-range region in Eq. 4. A 3–5% uncertainty is quoted for α from these variations. The resulting uncertainty on v
nfor
n =2–5 is within 1% at low
pT(< 4 GeV), and increases to
∼10% at the highest pT. However, the v
1extraction is directly a
ffected by the subtraction of the recoil component, and hence the v
1value is very sensitive to α uncertainty. The estimated uncertainty is 8–12% for
pT< 1 GeV and is about 20–30% for
pT
> 3 GeV.
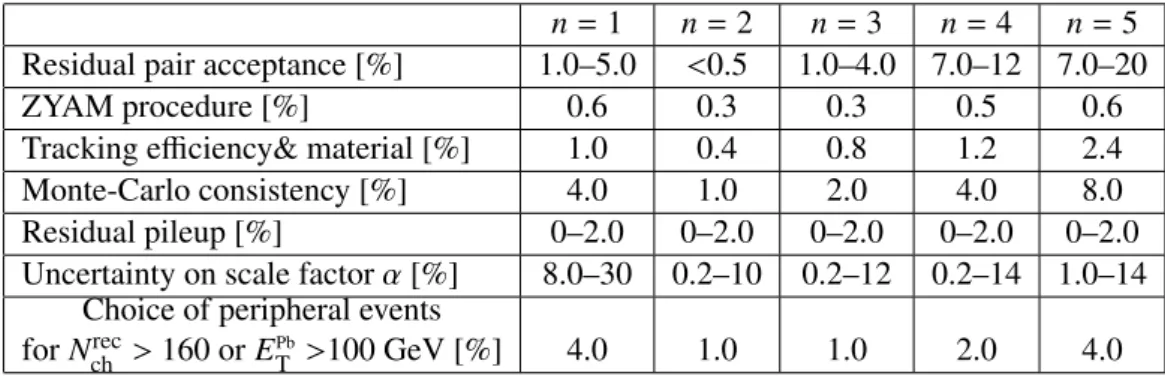
The di
fferent sources of the systematic uncertainties described above are added in quadrature to give the total systematic uncertainties for per-trigger yields and v
n, which are summarized in Tables 3 and 4, respectively. The systematic uncertainty quoted for each source usually covers the maxmium uncertainty over the measured
pTrange and event-activity range. However, since v
1(
pT) changes sign within 1.5–2.0 GeV (see Fig. 14), the relative uncertainties are quoted for
pT< 1 GeV and
pT> 3 GeV. The uncertainty of pair acceptance, which is less than 8
×10
−6for v
n,n, was converted to percent uncertainties. This uncertainty can be significant at high
pT.
Residual pair acceptance [%] 1–2
ZYAM procedure [%] 0.2–1.5
Tracking e
fficiency & material [%] 4.2
Residual pileup [%] 0–2
Table 3: Summary of relative systematic uncertainties for
Y(∆φ),
Ycorr(∆ φ) and
Ysub(∆ φ).
4 Results
4.1 Correlation functions and integrated yields
Figure 5 shows the 1-D correlation functions after the ZYAM procedure,
Ycorr(
∆φ), in various ranges
of
paTfor a fixed
pbTrange of 1-3 GeV. The correlation functions are obtained in the long-range region
(|
∆η| > 2) and are shown for events selected by
Nchrec ≥220. This event class contains a small fraction
(3
×10
−5) of the minimum bias
p+Pb events with highest multiplicity. The correlation functions are
compared to the distributions of the recoil component, αY
pericorr(∆ φ) in Eq. 6, estimated from the peripheral
event class defined by
ETPb< 10 GeV. The scale factor α is chosen such that the near-side short-range
n=
1
n=2
n=3
n=4
n=5 Residual pair acceptance [%] 1.0–5.0 <0.5 1.0–4.0 7.0–12 7.0–20
ZYAM procedure [%] 0.6 0.3 0.3 0.5 0.6
Tracking e
fficiency& material [%] 1.0 0.4 0.8 1.2 2.4
Monte-Carlo consistency [%] 4.0 1.0 2.0 4.0 8.0
Residual pileup [%] 0–2.0 0–2.0 0–2.0 0–2.0 0–2.0
Uncertainty on scale factor α [%] 8.0–30 0.2–10 0.2–12 0.2–14 1.0–14 Choice of peripheral events
for
Nchrec> 160 or
EPbT>100 GeV [%] 4.0 1.0 1.0 2.0 4.0 Table 4: Summary of relative systematic uncertainties on v
n.
yield matches between the two event classes (see Eq. 6 and discussion around it). Figure 5 shows a clear near-side excess in the full
paTrange studied in this analysis (0.4 <
paT< 12 GeV). An excess above the estimated recoil contribution is also observed on the away-side over the same
pTrange.
Per-trigger yield
0 0.2 0.4
< 1 GeV
a
0.5 < pT
< 3 GeV
b
1 < pT
| < 5 η
∆ 2 < |
0 0.2 0.4 0.6 0.8
< 3 GeV
a
1 < pT
≥ 220
rec
), Nch
φ
∆
corr( Y
φ)
∆
peri( Ycorr
α
recoil≡ Y
0 0.5 1
< 4 GeV
a
3 < pT
0 0.5 1
< 5 GeV
a
4 < pT
φ
∆
0 1 2 3
Per-trigger yield
0 0.5 1
< 7 GeV
a
5 < pT
ATLAS Preliminary
=5.02 TeV sNN
28 nb-1 int≈ L
p+Pb
φ
∆
0 1 2 3
0 0.5 1
1.5 a < 9 GeV 7 < pT
φ
∆
0 1 2 3
0 0.5 1 1.5
< 12 GeV
a
9 < pT