ATLAS-CONF-2017-011 08February2017
ATLAS CONF Note
ATLAS-CONF-2017-011
Photo-nuclear dijet production in ultra-peripheral Pb+Pb collisions
The ATLAS Collaboration 6th February 2017
Ultra-peripheral heavy ion collisions provide a unique opportunity to study the parton dis- tributions in the colliding nuclei via the measurement of photo-nuclear dijet production. An analysis of dijet production in ultra-peripheral√
sNN =5.02 TeV Pb+Pb collisions performed using data collected in 2015 is described. The data set corresponds to a total Pb+Pb integrated luminosity of 0.38 nb−1. The ultra-peripheral collisions are selected using a combination of trigger, zero degree calorimeter, and gap requirements. The jets are reconstructed using a combination of anti-kt algorithm and an underlying-event subtraction procedure. The results of the measurement include cross-sections for photo-nuclear dijet production as a function of different dijet kinematic variables. The cross-sections, not unfolded for detector response, are compared to results from Pythia Monte Carlo simulations re-weighted to match a photon spectrum obtained from the STARlight model.
© 2017 CERN for the benefit of the ATLAS Collaboration.
Reproduction of this article or parts of it is allowed as specified in the CC-BY-4.0 license.
1 Introduction
In the last two decades, significant interest has developed on the subject of nuclear parton distribution functions (PDFs) and their modifications relative to the proton PDFs. Some of that interest derives from the observations of non-trivial behavior in the nuclear PDFs [1]. At low values of x the nuclear PDFs exhibit suppression, referred to as “shadowing”. At largerxvalues they exhibit an enhancement referred to as “anti-shadowing” and at still largerxvalues suppression is again observed, known as the “EMC effect”.
More recently, interest in nuclear PDFs has been driven by the heavy ion physics programs at RHIC and the LHC. An important tool in characterising the hot, dense matter produced in nucleus-nucleus collisions is the modification of hard-scattering processes through final-state interactions of the outgoing partons with this matter. Theoretical predictions that account for nuclear PDF effects, but not the final-state medium effects, provide a crucial baseline for interpreting the nucleus-nucleus data. In addition, there has been much interest in the physics responsible for shadowing [2,3] and the possibility that it may be connected to non-linear evolution of the PDFs at high parton density [4,5,6].
Unfortunately, information regarding nuclear PDFs, especially their behavior at low x has been limited by lack of experimental data. Most of the data used in global nuclear PDF fits were obtained from fixed target experiments completed more than a decade ago [7, 8]. More recent data from proton- and/or deuteron-nucleus (p+A and/ord+A) collisions at RHIC and the LHC suffer from theoretical uncertainties in translating hadronic hard-scattering processes to constraints on the PDFs.
An alternative method for studying nuclear parton distributions using photo-nuclear production of dijets was proposed a decade ago [9]. The possibility for studying such collisions results from the large flux of virtual photons accompanying large-Z nuclei in ultra-relativistic nucleus-nucleus collisions. Photons with sufficiently long wavelengths couple to the entire nucleus and the cross-sections for photon-induced processes are enhanced by a factor of Z2. A characteristic transverse momentum (kT) scale for these coherently-emitted photons iskT≈~c/d≈15 MeV, for a Pb nucleus with a diameter,d, of approximately 14 fm. The virtualities of the photons are small compared to the typical scales of a hard-scattering process, making them effectively real. In the longitudinal direction the characteristic momentum scale over which the nuclear enhancement in the photon flux persists is multiplied by an additional Lorentz boost factor.
As a result, the enhancement extents to energies∼50 GeV which are energetic enough to stimulate hard- scattering processes at low x in the nucleus. For photo-nuclear processes in Pb+Pb collisions, the total enhancement compared toppcollisions is Z2A ∼ 1.5×10⁶, and the resulting rates for photon-nucleus scattering processes are large enough to be measurable at the LHC. Such collisions are often referred to as
“ultra-peripheral” because they can occur when the impact parameters between the incoming nuclei are large such that there is no hadronic interaction between the nuclei.
Photo-nuclear dijet production represents only a subset of ultra-peripheral Pb+Pb collisions that can be studied at the LHC. Indeed, ATLAS has recently produced a preliminary measurement of di-muon production in ultra-peripheral photon-photon collisions [10]. While that process is primarily governed by QED, and thus is not directly relevant to this measurement, it does provide an important experimental constraint on photon fluxes in ultra-peripheral Pb+Pb collisions. Another class of ultra-peripheral collision more directly related to the measurements described here involve exclusive vector meson production [11, 12,13, 14,13]. The exclusive nature and the different virtualities probed in such processes makes exclusive vector meson measurements complementary to the measurements presented here, which have a hard scale determined by the jet transverse momenta and/or the jet system mass.
Nucleus intact No neutrons
Nucleus breaks up Multiple neutrons
Rapidity gap
No rapidity gap
Nucleus intact No neutrons
Nucleus breaks up Multiple neutrons Gap partially
filled
No rapidity gap
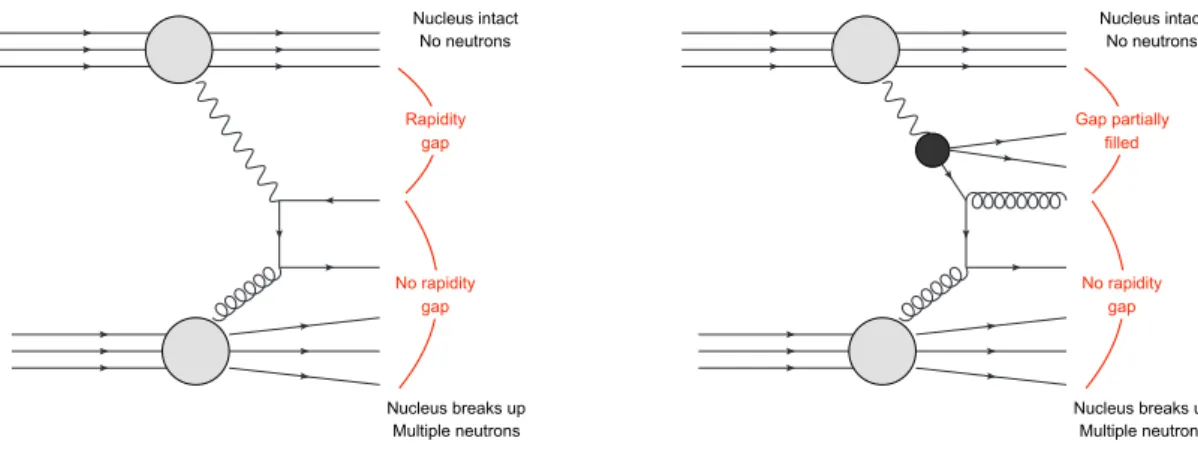
Figure 1: Diagrams representing different types of leading-order contributions to dijet production in high-energy photo-nuclear collisions. The left diagram represents the direct contribution in which the photon itself participates in the hard scattering. The right diagram represents the “resolved” contribution in which virtual excitations of the photon, into a state involving at least aqq¯pair and possibly multiple gluons, participates in the hard scattering in the target nucleus.
The simplest picture of a photo-nuclear reaction is “direct” photo-production. This process, depicted in the left panel of Fig.1, occurs when the photon acts like a point-like object interacting with the partons in the other nucleus. However, “resolved” processes may also occur in which virtual excitations of the photon may also be probed by the hard interaction in which case the photon serves as a source of partons.
In this contribution, depicted in the right panel of Fig.1, only a fraction of the photon’s four-momentum contributes to the hard scattering. Hard photo-production was studied extensively at HERA, where the interplay between the direct and resolved contributions was exploited to study the partonic structure of both the proton and the photon [15,16].
As neither type of process involves the exchange of color with the photon-emitting nucleus, no significant particle production is expected in the rapidity region between the dijet system and that nucleus. Thus a rapidity gap is expected, and a requirement of a minimum rapidity gap may be used to separate photo- nuclear events from hadronic Pb+Pb collisions. The gap is expected to be smaller in resolved photon events due to the additional particle production associated with the “photon-remnant”. This was also studied at HERA [17], and these measurements provide important experimental input into the modeling of resolved photon processes by event generators.
The photon-emitting nucleus is also expected to produce few or no neutrons because the photon flux is largest for momenta in the range where they couple to the entire nucleus. The emission of such photons is not expected to excite the nucleus. Thus a combination of a rapidity gap and zero neutrons in the same direction provide straightforward criteria to identify these events experimentally. However, additional soft photon exchanges during the ultra-peripheral collision can cause the photon-emitting nucleus to be excited into low-lying states where it may emit a small number of evaporation neutrons and a measurement must either correct for this effect or be compared to a theoretical model that includes it.
This note presents a measurement of photo-nuclear jet production cross-sections in Pb+Pb collisions at a per nucleon center-of-mass energy of √
sNN = 5.02 TeV, recorded in 2015. Photo-nuclear events are identified by requirements on the number of neutrons in the acceptance of the ATLAS zero degree calorimeters and the presence of rapidity gaps in the main detector. Specifically, events are required to
have zero neutrons in one direction and one or more neutrons in the opposite direction, referred to as the
“0nXn” event topology. The photon-going direction is defined to be the direction in which zero neutrons are observed. Background events are removed by requiring a minimum rapidity gap in this direction and requiring that there is no large gap in the opposite direction. Corrections are applied to account for signal events removed by these requirements, and thus they are not part of the fiducial definition of the measurement. Event-level observables are constructed from all jets having transverse momenta pT > 15 GeV and pseudo-rapidities |η| < 4.4. Events are required to have two or more such jets and at least one jet withpT > 20 GeV. The jets are used to define the event-level variables:
HT ≡X
i
pTi, mjets≡
* ,
X
i
Ei+
-
2
−
X
i
~ pi
2
1/2
, yjets≡ 1 2ln P
iEi+P
ipz i P
iEi−P
ipz i
!
, (1)
whereiruns over the measured jets in an event, Eand ~prepresent jet energies and momentum vectors, respectively, andpz represents the longitudinal component of the jet momenta. The signs ofpzare chosen to be positive in the photon-going direction. A further requirement is imposed that the jet-system mass, mjets, satisfiesmjets>35 GeV.
The differential cross-sections are measured as a function ofHTand zγ ≡ mjets
√s e+yjets, xA≡ mjets
√s e−yjets. (2)
In the limit of 2→2 scattering kinematics,xAcorresponds to the ratio of the energy of the struck parton in the nucleus to the (per nucleon) beam energy. zγ = xγy, whereyis the energy fraction carried by the photon. For direct processes,xγis unity, while for resolved events, it is the fraction of the photon’s energy carried by the resolved parton entering the hard scattering.
The remainder of this note is structured as follows: Section2 describes the ATLAS detector and the triggers used for the measurements in this analysis. Section3describes the data and Monte Carlo (MC) samples used in the analysis and provides information on how the MC sample obtained from Pythia is re-weighted for use in Pb+Pb collisions. Section5 describes all aspects of the data analysis and the measurement of the photo-nuclear dijet production cross-sections. Section6discusses the evaluation of the systematic uncertainties, and Section7discusses possible backgrounds to the measurement. Section8 presents the final results figures with comparison to Monte Carlo and theory. Section9summarizes this note and provides conclusions.
2 ATLAS detector
The measurements described in this note are performed using the ATLAS detector [18] in the Run 2 configuration. They rely on the calorimeter system, the inner detector, the zero degree calorimeters, and the trigger system. The calorimeters, which cover the pseudo-rapidity range |η| < 4.91, are used for measuring the jets and for the rapidity gap analysis. The inner detector is used to measure charged particle tracks over|η| < 2.5. The zero degree calorimeters (ZDCs), which measure neutrons emitted at
1ATLAS uses a right-handed coordinate system with its origin at the nominal interaction point (IP) in the center of the detector and thez-axis along the beam pipe. The x-axis points from the IP to the center of the LHC ring, and the y-axis points upward. Cylindrical coordinates(r, φ)are used in the transverse plane,φbeing the azimuthal angle around thez-axis. The pseudorapidity is defined in terms of the polar angleθasη=−ln tan(θ/2).
small rapidity separation from the incident nuclei, were used for triggering and for offline event selection.
The ZDCs are located a distance of±140 m from the nominal interaction point and cover |η| > 8.3.
Each calorimeter consists of four modules, and each module contains one interaction length of tungsten absorber.
The ATLAS trigger system consists of a Level-1 trigger followed by a processor-based high-level trigger (HLT) that can apply algorithms similar to those used in offline analysis. Level-1 ZDC triggers were obtained, separately, from each calorimeter. These required the total energy in the given ZDC to be above a threshold set well below the single-neutron energy. The primary triggers used for this measurement required detection of at least one neutron in only one of the ZDCs, a minimum total transverse energy,P
ET, measured in the calorimeters of 5 GeV, and a maximumP
ET of 200 GeV, all applied at Level-1. One trigger required only these conditions (UPC) while two additional triggers combined this Level-1 trigger with HLT selections on “central” (|η| < 3.2) jets (UPC-Jet) or “forward” (|η| > 3.2) jets (UPC-FWJet).
The HLT jet reconstruction used the ATLAS heavy ion jet reconstruction and background subtraction procedure applied to anti-kt R=0.4 jets.
3 Data sets and reconstruction
3.1 Pb+Pb data
In 2015, ATLAS recorded a Pb+Pb data set corresponding to a total luminosity of 0.48 nb−1. The luminosity was calibrated using established methods [19] from measurements performed during three beam-separation (van der Meer) scans carried out during the 2015 Pb+Pb run. The combined systematic uncertainty on the luminosity calibration and luminosity measurements for the current (preliminary) calibration is 6.1%
The triggers used for this measurement sampled a fraction of the total luminosity; the UPC trigger sampled an integrated luminosity of 95 µb−1, while the UPC-Jet and UPC-FWJet triggers sampled luminosities of 300 µb−1 and 380 µb−1, respectively. A total of 100047, 116090, and 5740 events were recorded for the UPC, UPC-Jet, and UPC-FWJet triggers, respectively.
3.2 Monte Carlo samples
The primary Monte Carlo sample for this analysis was obtained from Pythia version 6.41 [20] using the Perugia2012 tune [21] configured for γ∗+ p collisions with the photons produced via bremsstrahlung from a muon beam (gamma/mu+ mode). The muon-proton center of mass energy was 5.02 TeV. The Pythia generator was configured to include the default combination of three photo-production processes:
direct, vector meson dominance (VMD), and anomalous. The VMD mechanism treats the photon as a vector meson and describes the hard-scattering process as a meson-proton interaction. The anomalous contribution interpolates between the lower-Q2virtual excitations of the photon described by the VMD mechanism and the harder virtual excitations for which it samples the photon parton distribution. The VMD and anomalous mechanisms together describe the resolved-photon contribution to dijet photo-production.
The Pythia event generation used the CTEQ6L1 proton PDF set and the SaS 1D photon PDFs [22,23] for the anomalous processes. To match the kinematics of the UPC photo-nuclear events in the measurement, the photon virtuality was limited to p
Q2 . 30 MeV and the minimum photon-proton invariant mass
was set to 15 GeV. The photo-nuclear dijets were sampled over a wide kinematic range by filtering the Pythia-generated events according to the leading jetpTusing three sample ranges: 7< pTlead <20 GeV, 20 < pTlead < 60 GeV, and 60< pTlead < 160 GeV. Here, and for the remainder of this note, “leading”
refers to the jet having the highest transverse momentum in the event, while “sub-leading” refers to the jet having the second-highest transverse momentum. For each of thepTleadintervals, 500,000 events were produced for each of the two possible photon directions.
A separate sample of 100,000 Herwig++ [24] 5.02 TeVppevents were generated with exclusive production ofqq¯ pairs via the process γ+γ → qq¯. The events were sampled according to the STARlight [25]
photon spectrum and are used to evaluate potential backgrounds to this measurement.
The Pythia- and Herwig++-generated events were passed through a GEANT4 [26] simulation of the ATLAS detector response [27] and analyzed in the same manner as ATLAS data.
4 Theory and models
To compare to the measured cross-sections presented in this note, a model was constructed combining elements of Pythia and the STARlight [25] generator. This model, referred to as Pythia+STARlight in the rest of this note, is described in the following.
The cross-section for photo-nuclear dijet production can be calculated using the formalism of the equivalent photon-approximation (EPA). Pythia is capable of simulating photon-nucleon events using the equivalent photon flux from a lepton beam as the source of photons, providing a mixture of direct and resolved processes described in the previous section. Despite the sophisticated description of photon-nucleon interactions contained in Pythia, it is insufficient to satisfactorily describe photo-nuclear dijet production.
Specifically, the photon spectrum it uses is not appropriate for nuclear collisions. Furthermore, in nucleus- nucleus collisions, when the impact parameter approaches twice the nuclear radius, hadronic interactions become prevalent and greatly alter the characteristics of the events. Such interactions will result in particle production over the entire rapidity range and will cause the photon-emitting nucleus to break up. These features result in events that are nearly identical to those where a photo-nuclear reaction did not occur making an experimental identification of the photo-nuclear processes impossible. These effects can be accounted for by applying a reweighting to Pythia to provide a flux integrated over impact parameter that contains these effects.
STARlight [25] is a Monte Carlo model and event generator that has been used to simulate two-photon and photon-pomeron scattering in heavy ion collisions. The model has been tested using data from both RHIC and the LHC including a preliminary ATLAS measurement of γ+γ → µ+µ− production in 5.02 TeV Pb+Pb collisions [10]. In that measurement, STARlight was found to reproduce well the shape and absolute normalization of the measured di-muon spectrum. STARlight uses the equivalent photon approximation to calculate these cross-sections and for nucleus-nucleus collisions, the formalism uses classical electrodynamics to calculate the energy flux from the charge distribution of the nucleus and then reinterprets this energy flux asE NγA, whereE represents the photon energy andNγAthe number of photons associated with the nucleus. For a point charge,
dNγA
dEd2b =αEM Z2 π2γ2L
E (~c)2*
,
K12(ξ)+ 1
γL2K02(ξ)+ -
, ξ = Eb
~c 1
γL, (3)
whereγL = EA/mA is the (longitudinal) Lorentz boost factor andKn are modified Bessel functions of ordern. The quantities,EAandmA, represent the total energy and total mass of the nucleus, respectively.
At high energies, theγLis so large that the second term can be neglected, as is the case in STARlight.
As discussed above, the experimentally accessible part of the photo-nuclear cross-section only receives contributions from events where there are no additional hadronic interactions. Thus the cross-section must be multiplied by a factorPUPC(b), wherebis the impact parameter of the collision. STARlight also contains a model of the nuclear geometry and hadronic interactions and can be used to calculate PUPC(b).
For the process A+B→γ+B→X, the EPA cross-section is:
dσEPAAB
d2rAd2rBdE ≡ dNγA dEd2rA
dσγB
d2rB , (4)
whererA andrB denote coordinates in the transverse plane of the target and projectile nuclei A and B, respectively. The cross-section forγ+B scattering can be expressed in terms of theγ+N cross-section and the nuclear thickness functionTB(rb), which is the transverse density of nucleons in the nucleus per unit area,
dσγB
d2rB =TB(rb)σγN. (5)
The total cross-section is obtained by multiplying byPUPC and integrating over the projectile and target.
Thus,
dσUPCPb+Pb dE =2
Z
d2b PUPC(b) Z
d2rB d2NγPb dE d2rA
r~A=~b−r~B
TPb(rB)σγN ≡ dNγeff
dE σγN, (6) where factor of 2 has been inserted to account for the symmetry of the Pb+Pb collision system. The Pythia + STARlight model is constructed by using STARlight to obtain dNγeff/dE and evaluating a weight,
w(E) ≡ dNγeff dE
, dNγPythia
dE , (7)
which is applied to the generated Pythia events. The spectrum, dNγPythia/dE, is obtained from the Pythia EPA formula [20] evaluated at fixed virtualityQ2= (15 MeV)2.
5 Data analysis
5.1 Reconstruction
The events used for this analysis were reconstructed using a configuration of the ATLAS software typically used inppcollisions. The reconstruction of charged particle tracks used the same settings and selections as those applied in minimum-bias measurements [28]. Calorimeter clusters were reconstructed using the same method applied in other ATLAS analyses [29] but with thresholds set appropriately for low- luminosity conditions. The jets were reconstructed using a combination of the anti-kt [30] algorithm withR= 0.4 and the heavy ion subtraction procedure [31] configured for small underlying event energy densities.
Following well-established procedures within ATLAS [32], the jet energies are calibrated initially using constants obtained from MC evaluations of the jet response in √
s = 5 TeV pp collisions. A set of corrections is applied to the jet energies to account for changes in the jet energy scale (JES) arising from differences in flavor composition between the jets produced in photo-nuclear events and in inclusive jet production in ppcollisions. Data-driven corrections are performed to account for differences between data and MC simulations. A relative energy scale calibration (inter-calibration) is performed by evaluating data-MC agreement in the dijet balance between jets in differentη regions. Thein situ calibration uses Z-jet andγ-jet balance to perform an absolute energy scale calibration.
The minimum transverse momenta for charged particles, clusters, and jets used in this analysis are 0.3 GeV, 0.2 GeV, and 15 GeV, respectively. Jets are required to be completely contained within the detector: |ηjet| <4.4.
5.2 ZDC calibration and trigger efficiency
The energy measurements in the ZDCs were calibrated using the single-neutron peak which is well- separated from the two-neutron peak in Pb+Pb collisions. In addition to setting the absolute energy scale in the ZDCs the calibration accounts for an instantaneous luminosity- and time-dependent response. The former results from large current draw in the ZDC photo-multiplier tubes at higher luminosities, while the latter results from radiation damage in detector.
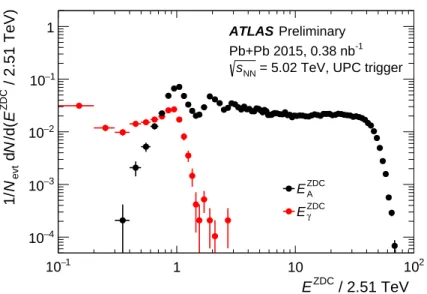
For a given event, the photon- and Pb-going directions are evaluated using the ZDC trigger: the side on which the trigger fired (did not fire) is assumed to be the Pb-going (photon-going) direction. Then, the 0nXn topologies are selected by requiring EZDCA > 1 TeV and EγZDC < 1 TeV, where EZDCA and EγZDC are the ZDC energies in the nucleus-going and photon-going directions, respectively. The distribution of calibrated energies divided by the per-nucleon beam energy,EZDC/2.51 TeV, on the side that fired the ZDC trigger and on the side that did not fire the ZDC trigger are shown in Figure2. The logarithmic horizontal scale shows the full distribution while also making visible the single-neutron region, but it excludes a large peak at zero for events which did not fire the trigger. The peak inEγZDCnearEγZDC/2.51 TeV ∼1 results from inefficiency in the level-1 ZDC trigger that allows some 1nXn events to satisfy the 0nXn condition.
At higher luminosities, an inefficiency in the ZDC trigger is observed that primarily results from large energy deposits in preceding collisions. This inefficiency is responsible for the non-zero energies observed in Figure2in the photon-going direction. Significant inefficiencies are only observed below and in the vicinity of the single-neutron peak. The trigger inefficiency was measured as a function of EZDC using Pb+Pb events satisfying a ZDC trigger on the opposite side.
5.3 Gap measurement
The triggers used in this measurement select both UPC events and a class of rapidity-asymmetric hadronic collisions that have characteristics similar to proton-nucleus collisions. These events can be efficiently removed by requiring the presence of a gap in the photon-going direction. The rapidity gap analysis proceeds by applying the same selections on calorimeter clusters as applied in other ATLAS measurements [33]. The resulting clusters and the charged particle tracks are ordered inηand intervals between adjacent tracks or clusters with separation∆η >0.5 are recorded. The minimum∆ηrequirement, excludes small
/ 2.51 TeV EZDC
−1
10 1 10 102
/ 2.51 TeV)ZDC E/d(N devtN1/
−4
10
−3
10
−2
10
−1
10 1
A
EZDC γZDC
E Preliminary ATLAS
Pb+Pb 2015, 0.38 nb-1
= 5.02 TeV, UPC trigger sNN
Figure 2: Distributions of ZDC energy in the photon-going and nucleus-going direction for events satisfying the UPC trigger. The vertical line indicates the location of the single-neutron selection applied in the analysis.
gaps that may occur purely due to fluctuations in the particle rapidity density. Any such intervals at the edge of the detector,∆ηedge, are taken as “edge gaps”.
Due to the presence of resolved-photon events that can contribute additional particles in the photon-going direction, this analysis primarily relies on the sum of the gaps having∆η >0.5 that lie between the largest- η and smallest-η jets and the closest detector boundary. The sums on the photon-going and Pb-going sides of the detector will be referred to asP
γ∆η, andP
A∆η, respectively.
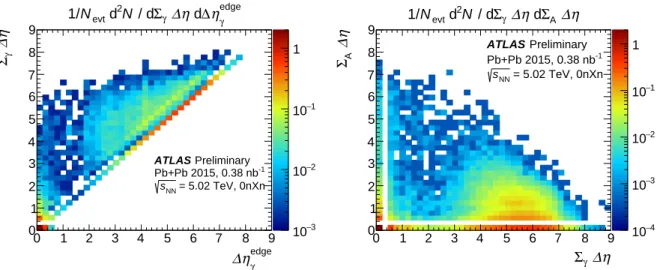
Figure 3 demonstrates the results of the gap analysis for events selected by the UPC trigger having at least two jets passing the minimum pT requirement. The left panel shows the correlation between the photo-going edge gap,∆ηγedge, andP
γ∆η, while the right panel shows the correlation between P
γ∆η andP
A∆η. The presence of resolved-photon events can be seen in the left panel as events for which Pγ∆η >∆ηedgeγ . The right panel shows that there are events having smallP
γ∆ηbut largeP
A∆η. The P
A∆η < 3 requirement suppresses the contribution of such events in the regionP
γ∆η > 2.
As suggested above, events selected by the UPC trigger and having two jets look very different depending on whether they have gaps in the photon-going direction or not. This is demonstrated in Figure4which shows in the left panel the correlation between charged particle multiplicity,Ntrk, andP
γ∆η. Events with small or no gaps,P
γ∆η < 1, have a much broader multiplicity distribution than the events with larger Pγ∆η. The right panel in the figure shows the multiplicity distributions for two selections on P
γ∆η: Pγ∆η < 1 andP
γ∆η > 2. The multiplicity distributions are completely different, demonstrating that the events in the two classes arise from different physics.
5.4 Event selection
Events used in the measurement are required to satisfy the 0nXn condition in the ZDCs and to have Pγ∆η > 2 and P
A∆η < 3. The last requirement reduces background fromγ+γ collisions and non- photo-nuclear UPC processes. Events are required to have a reconstructed vertex and at least one charged
γ
ηedge
∆
0 1 2 3 4 5 6 7 8 9
η∆γΣ
0 1 2 3 4 5 6 7 8 9
−3
10
−2
10
−1
10 1
Preliminary ATLAS
Pb+Pb 2015, 0.38 nb-1
= 5.02 TeV, 0nXn sNN
edge
ηγ
∆ η d
γ ∆ Σ / d
2N
evt d N 1/
η
γ ∆ Σ
0 1 2 3 4 5 6 7 8 9
η∆AΣ
0 1 2 3 4 5 6 7 8 9
−4
10
−3
10
−2
10
−1
10 1 Preliminary
ATLAS
Pb+Pb 2015, 0.38 nb-1
= 5.02 TeV, 0nXn sNN
η
A ∆ Σ η d
γ ∆ Σ / d
2N
evt d N 1/
Figure 3: Left: two-dimensional distribution ofP
γ∆ηvs∆ηγedgefor events selected by the UPC trigger having at least two jets. Right: two-dimensional distribution ofP
A∆ηversusP
γ∆η.
η
γ ∆ Σ
0 1 2 3 4 5 6 7 8
trkN
0 50 100 150 200 250 300
−5
10
−4
10
−3
10
−2
10
−1
Preliminary 10 ATLAS
Pb+Pb 2015, 0.38 nb-1
= 5.02 TeV, 0nXn sNN
Ntrk
η d
γ ∆ Σ / d
2N
evt d N 1/
Ntrk
0 50 100 150 200 250 300 350 400
trkN/dN devtN1/
−6
10
−5
10
−4
10
−3
10
−2
10
−1
10
> 2 η
γ∆ Σ
< 1 η
γ∆ Σ Preliminary ATLAS
Pb+Pb 2015, 0.38 nb-1
= 5.02 TeV, 0nXn sNN
Figure 4: Left: two-dimensional distribution ofNtrkvsP
γ∆ηfor events selected by the UPC trigger having at least two jets. Right: distributions of charged particle multiplicity for events withP
γ∆η >2 andP
γ∆η <1.
particle track passing applied selections if at least one of the jets falls within the inner detector acceptance.
Events used in the analysis were required to have at least two jets satisfying thepTjet>15 GeV and|η| < 4.4 requirements. Furthermore, the leading jet is required to satisfypTlead > 20 GeV. The azimuthal angle difference between the leading and sub-leading jets is required to be greater than 0.2 and the combined mass of all reconstructed jets,mjets, is required to be greater than 35 GeV.
Figure5provides a summary of the jet kinematics in events passing the above-described selections. The left panel on the top shows thepTdistributions for leading, sub-leading and other jets in the event. The spectra are similar to those observed in other hard-scattering processes though the leading and sub-leading jet spectra at low pT are affected by the pT thresholds applied in the analysis. The panel on the right of the figure shows the leading-sub-leading jet∆φdistribution for events having two, three, or and more than three jets. The dijet events have a∆φdistribution that is sharply peaked at∆φ= πwhile the other
[GeV]
pT
20 40 60 80 100
]-1 [GeV Tp / djetN devtN1/
−7
10
−6
10
−5
10
−4
10
−3
10
−2
10
−1
10 1
leading
sub-leading (/ 10) other
Preliminary ATLAS
Pb+Pb 2015, 0.38 nb-1
= 5.02 TeV, 0nXn sNN
= 0.4 jets
tR anti-k
Not unfolded for detector response
φ
∆
0 1 2 3
φ∆/dN devtN1/
−4
10
−3
10
−2
10
−1
10 1 10 102
jet = 2 N
= 3 (/ 10) Njet
> 3 (/ 100) Njet
Preliminary ATLAS
Pb+Pb 2015, 0.38 nb-1
= 5.02 TeV, 0nXn sNN
= 0.4 jets
tR anti-k
Not unfolded for detector response
Figure 5: Left: distribution of leading jet, sub-leading jet, and other jet transverse momentum for events included in this analysis. Right: distribution of∆φbetween leading and sub-leading jets for events with 2, 3, or more jets.
distributions are much broader confirming that the the additional jets reflects real changes in the topology of the events.
The kinematics of the photo-nuclear hard scattering processes are evaluated as follows. The total four- momentum of the jet system is evaluated by summing the four-vectors for all jets. The rapidity and mass of the jet system,yjetsandmjets then determine the kinematics of the photon and the parton from which it scattered according to Eq.2. TheHTvariable is computed by summing the transverse momenta of the jets.
5.5 Data-Monte Carlo comparisons
The distributions of various event or jet quantities are compared to the same distributions from the MC sample in Figs.6–9. Unless stated otherwise, the events used to produce the distributions satisfy all of the above-described event selection criteria on reconstructed quantities for both the data and the MC.
Each figure compares distributions in the data to those from un-reweighted (Pythia) and reweighted (Pythia+STARlight) MC to demonstrate the sensitivity of the observable to the shape of the true zγ distribution and to demonstrate the level of agreement between the data and MC.
Figure6shows the actual zγ distributions. Prior to reweighting, thezγ spectrum produced by Pythia is much harder than that observed in the measurement. After reweighting, the distributions agree well over most of thezγrange, though anzγ-dependent difference is observed at the smallestzγ values.
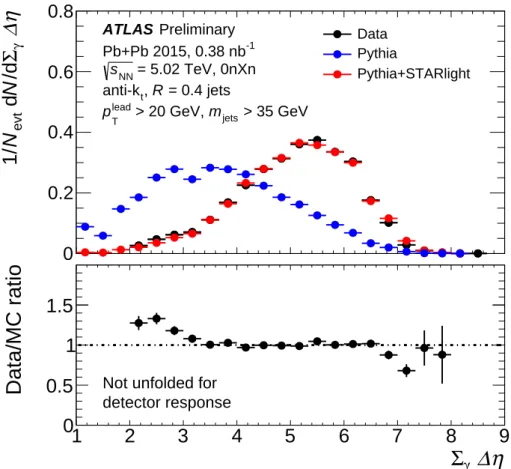
Figure7comparesP
γ∆ηdistributions between data and MC. Similar to the behavior observed for thezγ distributions, the un-reweighted MCP
γ∆η distribution is very different from the measured distribution, while the reweighted MC agrees much better with the data. The ratio is consistent with unity except at largeP
γ∆ηwhere there are few counts and below 2.5 where a∼30% excess can be observed in the data
γ
z /d N d
evtN 1/
−1
10 1 10 102
103
104
Preliminary ATLAS
Pb+Pb 2015, 0.38 nb-1
= 5.02 TeV, 0nXn sNN
, R = 0.4 jets anti-kt
> 35 GeV mjets
> 20 GeV,
lead
pT
Data Pythia
Pythia+STARlight
z
γ−4
10 10
−310
−2Data/MC ratio
0 0.5 1 1.5
Not unfolded for detector response
Figure 6: Comparison of data and Pythia+STARlight MCzγdistributions. The top panel shows thezγdistributions in data (black), Pythia (blue), and Pythia+STARlight (red). The bottom panel shows the ratio of data to Pythia+STARlight. The error bars represent the statistical uncertainties only.
compared to the MC. The shapes of theP
A∆η distribution also agree well between data and MC (not shown) though the fraction of the events withP
A∆η=0 differs between data and reweighted MC.
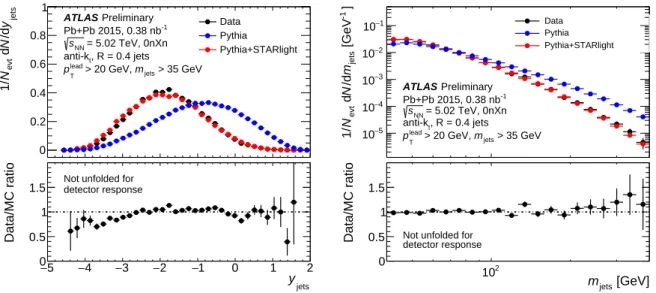
Figure8shows a comparison of the data and MC jet rapidity (left) and mass (right) distributions. As for the previous distributions, the reweighted MC distributions are in much better agreement with the data than the un-reweighted distributions. For both variables, the reweighted MC distributions show a slight excess over the data at more forward rapidities while the data show a small excess over the reweighted MC near the peak of the rapidity distribution.
Figure 9 shows data-MC comparisons for the leading-sub-leading ∆φ (left) and jet system HT (right) distributions. Once again, the reweighted MC distributions are in approximate agreement with the data, though a slow variation in the data/MC ratio is observed for the jet mass distribution.
The agreement between the measured distributions shown above and the reweighted MC distributions indicates that Pythia is accurately modeling both the direct and resolved contributions of the photo- nuclear collisions. The extent to which the different distributions change under the reweighting indicate the sensitivity of the given observable to the photon spectrum. Since the jet kinematics will also be sensitive to the parton energies, it is likely that the distributions which are most sensitive to thezγ re- weighting may also be sensitive to nuclear PDF modifications. It should also be noted that the lack of
η
γ
∆
1 2 3 4 5 6 7 8 Σ 9
Data/MC ratio
0 0.5 1 1.5
Not unfolded for detector response
η∆
γΣ /d N d
evtN 1/
0 0.2 0.4 0.6 0.8
Preliminary ATLAS
Pb+Pb 2015, 0.38 nb-1
= 5.02 TeV, 0nXn sNN
= 0.4 jets R
t, anti-k
> 35 GeV mjets
> 20 GeV,
lead
pT
Data Pythia
Pythia+STARlight
Figure 7: Comparison of data and Pythia+STARlight MCP
γ∆ηdistributions. The top panel shows distributions for data (black), Pythia (blue), and Pythia+STARlight (red). The MC distributions are shown over the fullP
γ∆η range while the data are required to satisfy the event selectionP
γ∆η >2. The bottom panel shows the ratio of data to Pythia+STARlight. The error bars represent the statistical uncertainties only.
γ+nMC simulations and the resulting isospin mismatch with dijet photo-production in Pb+Pb collisions will influence the data-MC agreement even after the STARlight re-weighting is applied.
5.6 Cross-section measurement
The UPC photo-nuclear differential cross-section, uncorrected for jet response is generically calculated using
d ˜σ= 1 L
∆N
εtrigεsel, (8)
where∆Nrepresents the number of events measured in some bin in the space of kinematic variables used for the cross-section. The tilde on the cross-section provides a reminder that the cross-sections presented here are not unfolded for detector response. In Eq.8, εtrig represents the efficiency of a given trigger, andεselrepresents the event selection efficiency. The trigger efficiency depends both onEZDCand the jet momenta, whileεselis evaluated as a function ofzγ andxA.
jetsy/dN devtN1/
0 0.2 0.4 0.6 0.8
1 ATLAS Preliminary Pb+Pb 2015, 0.38 nb-1
= 5.02 TeV, 0nXn sNN
, R = 0.4 jets anti-kt
> 35 GeV mjets
> 20 GeV,
lead
pT
Data Pythia Pythia+STARlight
yjets
−5 −4 −3 −2 −1 0 1 2
Data/MC ratio
0 0.5 1
1.5 Not unfolded for detector response
]-1 [GeVjetsm/dN devtN1/ 5−10
−4
10
−3
10
−2
10
−1
10
Preliminary ATLAS
Pb+Pb 2015, 0.38 nb-1
= 5.02 TeV, 0nXn sNN
, R = 0.4 jets anti-kt
> 35 GeV mjets
> 20 GeV,
lead
pT
Data Pythia Pythia+STARlight
[GeV]
mjets
102
Data/MC ratio
0 0.5 1 1.5
Not unfolded for detector response
Figure 8: Comparison of data and Pythia+STARlight MC jet rapidity distributions for the rapidity (left) and mass (right) of the N-jet system (right). The top panels shows the distributions in data (black), Pythia (blue), and Pythia+STARlight (red). The bottom panels shows the ratio of data to Pythia+STARlight. The error bars represent the statistical uncertainties only.
φ∆/dN devtN1/
−4
10
−3
10
−2
10
−1
10 1 10 102
Preliminary ATLAS
Pb+Pb 2015, 0.38 nb-1
= 5.02 TeV, 0nXn sNN
, R = 0.4 jets anti-kt
> 35 GeV mjets
> 20 GeV,
lead
pT
Data Pythia Pythia+STARlight
φ
0 0.5 1 1.5 2 2.5 ∆3
Data/MC ratio
0 0.5 1 1.5
Not unfolded for detector response
]-1 [GeVTH/dN devtN1/
−5
10
−4
10
−3
10
−2
10
−1
10 1
Preliminary ATLAS
Pb+Pb 2015, 0.38 nb-1
= 5.02 TeV, 0nXn sNN
, R = 0.4 jets anti-kt
> 35 GeV mjets
> 20 GeV,
lead
pT
Data Pythia Pythia+STARlight
[GeV]
HT
102
Data/MC ratio
0 0.5 1 1.5
Not unfolded for detector response
Figure 9: Comparison of data and Pythia+STARlight MC leading-sub-leading ∆φ (left) and jet HT (right) distributions. The top panels shows the distributions in data (black), Pythia (blue), and Pythia+STARlight (red). The bottom panels shows the ratio of data to Pythia+STARlight. The error bars represent the statistical uncertainties only.
Many of the results in this note are presented in terms of the triple-differential cross-sections, d3σ/˜ dHTdxAdzγ, which is obtained using
d3σ˜
dHTxAdzγ = 1 L
∆N
∆HT∆xA∆zγ 1
εtrig εsel. (9)
Here∆xA,∆zγ, and∆HTrepresent the sizes of the bins inxAandzγ, andHT, respectively.
The cross-sections are measured within the following fiducial ranges: 35<mjets <400 GeV,−5< yjets<
3, 35 < HT < 200 GeV, 5×10⁻⁴ < xA < 1, and 10−4 < zγ < 0.05. The cross-sections are evaluated using logarithmic binning formjets,HT,zγ, andxA.
The event selection efficiencyεsel differs from unity primarily due to the applied gap requirements. It is evaluated as a function of zγ and xA using the MC sample and over most of the fiducial range of the measurement the efficiency is> 99%. However, for zγ > 0.01, theP
γ∆η selection introduces an inefficiency that is as high as 30% for the smallestxAvalues.
The trigger efficiency,εtrig, accounts for inefficiency arising from the ZDC component of the UPC trigger, small inefficiencies in the jet trigger described below, and for losses of 0nXn events due to pileup from electromagnetic (EM) dissociation processes. The ZDC trigger inefficiency is∼2% and is approximately independent of the kinematics of the measured photo-nuclear events. The loss of events due to second EM dissociation collisions during the same bunch crossing as a photo-nuclear event and that contribute neutrons in the photon-going direction is estimated using the single EM dissociation cross-section from the RELDIS model [34,35] which is reported to be 205±10 b [36]. Averaged over the 2015 Pb+Pb run, the EM dissociation induces a 5% inefficiency that iszγ-,xA-, andHT-independent because the EM pileup is uncorrelated with the photo-nuclear collision.
The results from the three primary triggers are combined using exclusive regions in the four-dimensional space(pTlead,ylead,pTsublead,ysublead)as follows:
• The UPC-Jet trigger is used when eitherpTlead > 32 GeV and|ylead| < 3.1 orpTsublead > 32 GeV and|ysublead| <3.1.
• The UPC-FWJet trigger is used when the above conditions are not filled and when either pTlead >33 GeVand|ylead|> 3.4 orpTsublead> 33 GeV and|ysublead| >3.4.
• The UPC trigger is used when neither of the above conditions is filled.
For each region, the cross-section is evaluated in the space of the above four variables plus the desired kinematic variables and then integrated over(pTlead,ylead,pTsublead,ysublead)to obtain the cross-section in the space of the kinematic variables. The trigger efficiency factor includes corrections of up to 2% and 4%
for the UPC-Jet and UPC-FWJet triggers for residual inefficiency in thepTrange where they are used.
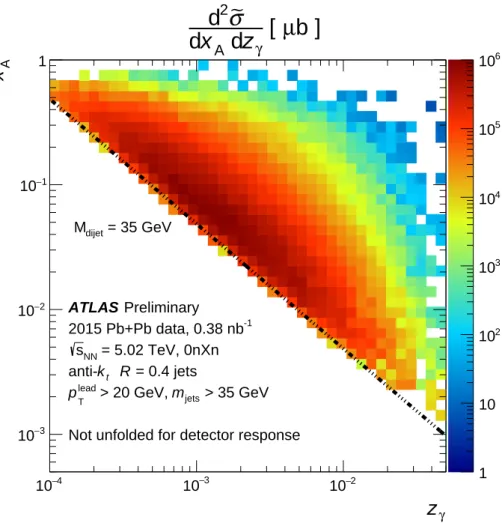
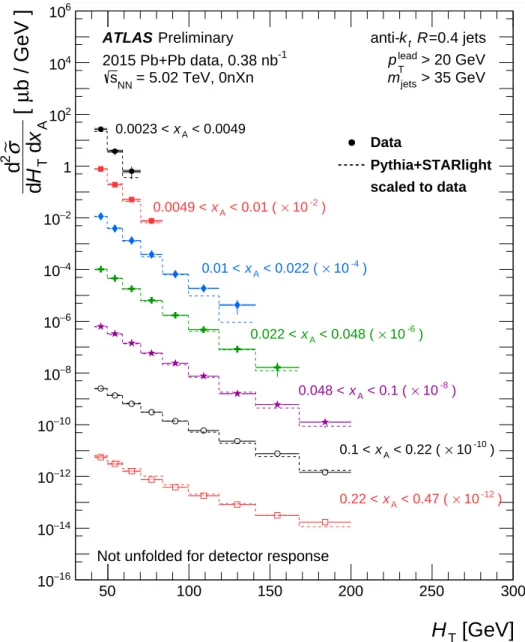
Figures 10 and 11 show the cross-sections, d2σ/˜ dxAdzγ and d2σ/˜ dHTdxA, obtained by integrating d3σ/˜ dHTdxAdzγoverHTandzγ, respectively. The coverage in (xA,zγ) is constrained by the kinematic range of the measurement. In particular, the minimum mjets constraint restricts the acceptance of the measurement to the upper right region. This constraint is indicated on the figure by the line which shows the locus of events havingmjets=35 GeV.
The coverage in the HT–xA space is constrained at low HT by the minimum values for pTlead and pTsubleadused in the analysis. The acceptance is also determined by the range ofzγ values accessible in
√sNN = 5.02 TeV Pb+Pb collisions. The rapidity acceptance of the ATLAS detector also introduces an acceptance restriction at lowxA.
1 10 102
103
104
105
106
z
γ−4
10 10−3 10−2
A
x
−3
10
−2
10
−1
10 1
Preliminary ATLAS
2015 Pb+Pb data, 0.38 nb-1
= 5.02 TeV, 0nXn sNN
= 0.4 jets R
t k anti-
> 35 GeV mjets
> 20 GeV,
lead
pT
Not unfolded for detector response
µ b ]
γ
[ z
A
d x d d
2σ∼
= 35 GeV
dijet
M
Figure 10: Two-dimensional presentation of the double-differential cross-section, d2σ/˜ dxAdzγ, integrated over the HTrange of the measurement, 35<HT<200 GeV. The dot-dashed line represents the possible(zγ,xA)values for jet systems having a mass of 35 GeV– the minimummjetsvalue for events included in the analysis.
The correlation between the reconstructedzγ,xA, andHTand the corresponding particle- and parton-level quantities was studied in the Pythia+STARlight sample. The response in each quantity was found to be approximately symmetric, with events typically reconstructed in the same kinematic bin from which they originated.
x
A−3
10 10−2 10−1 1
[GeV]
TH
50 100 150 200 250
−2
10
−1
10 1 10 102
Preliminary ATLAS
2015 Pb+Pb data, 0.38 nb-1
= 5.02 TeV, 0nXn sNN
= 0.4 jets R
t k anti-
> 35 GeV mjets
> 20 GeV,
lead
pT
< 0.05 0.0001 < zγ
Not unfolded for detector response
-1
] b GeV µ
[ x
A Td H d d
2σ∼
Figure 11: Two-dimensional presentation of the double-differential cross-section, d2σ/˜ dHTdxA, integrated over the fullzγrange used in the analysis.
6 Systematic uncertainties
The primary sources of systematic uncertainty in this measurement are the luminosity measurement, ZDC trigger efficiency and EM dissociation pileup corrections, corrections for event selection efficiency, and uncertainties in the jet response.
As discussed in Sec3.1, the luminosity calibration for the 2015 Pb+Pb data-taking period has a relative systematic uncertainty of 6.1%. The correction for EM pileup introduces a potential systematic uncertainty due to the uncertainty in the nuclear EM dissociation cross-section. That uncertainty was evaluated to be 0.5%. The systematic uncertainty on the ZDC trigger efficiency correction is conservatively taken to be half the correction,±1%. All three of these uncertainties are manifestly (luminosity and EM pileup) or approximately (ZDC efficiency) independent of the kinematics of the photo-nuclear scattering and are fully correlated over every bin in measured differential cross-sections. Combined in quadrature they contribute a 6.2% systematic uncertainty on the normalization.
The correction for event selection efficiency introduces potential systematic uncertainties due to imperfect agreement between the data and MC distributions of quantities used in the event selection. The dominant
sources of event selection inefficiency are the requirements on P
γ∆η and P
A∆η. To estimate the systematic uncertainty on the efficiency correction, each of the gap requirements was separately varied by±0.65, the resolution on the gap sum for smallP
γ∆ηandP
A∆ηvalues evaluated using the MC. For each variation, a new efficiency was calculated and applied to the cross-section obtained using the same gap selection. The upward and downward variations were evaluated separately forP
γ∆ηandP
A∆ηand combined in quadrature to obtain an asymmetric systematic uncertainty on the event selection efficiency correction. The estimated systematic is typically a few percent or less except at the largestzγvalues where it varies from∼25% at the extremes of thexArange to∼10% in the middle of the xArange.
Systematic uncertainties in the measured cross sections from uncertainties in the jet energy scale and jet energy resolution were evaluated by applying variations to reconstructed jetpTvalues in the MC sample and considering the fractional change in the resulting cross section. The procedure was applied to the MC sample instead of the data, so as not to include statistical fluctuations in the latter in the systematics. As the MC distributions, after reweighting, were found to match the measured distributions well, the effect of the systematic variations on the MC sample is expected to be similar to those in the data. The procedure was also applied to the data and the results were found to be compatible modulo features in the data result attributable to statistical fluctuations.
The jet energy resolution (JER) uncertainty was evaluated in the MC sample by adding additional pT smearing to account for possible under-estimation of the JER in the MC. The evaluation of the JES uncertainties follows from the cross calibration procedure [37]. For each jet in the MC sample, the four- momentum was varied according to 74 nuisance parameters, the majority of which result from statistical and modeling uncertainties in the inter-calibration andin situcalibrations.
Separately, contributions to the jet response systematic result from the flavor-dependence of the jet response and the fact that the flavor composition of the photo-nuclear jets is different than that used in the in situcalibration. Specifically, the flavor-dependent contribution to the JES systematic uncertainty can be written:
∆Rphoto−nuclear =∆Rq+∆fg(Rq− Rg)+ fg∆Rg. (10) Here, ∆Rq and ∆Rg represent the uncertainties on the quark and gluon JES, respectively, Rq − Rg represents the difference in the JES between quarks and gluons, fg represents the gluon fraction in the photo-nuclear sample, and∆fg the uncertainty on that fraction. It is assumed that thein situsample is entirely composed of quark jets, and thus∆Rqis removed by thein situcorrection. The second and third terms are referred to as theflavor compositionandflavor responseterms, respectively, and depend on the fraction of gluon jets in photo-nuclear events. The fgis obtained from studying the gluon fraction in the Pythia photo-nuclear sample including the reweighting. Without additional information,∆fgwas taken to be fg, i.e. a 100% uncertainty on the gluon flavor fraction was assumed. Both uncertainties are largest at lowerpTand at negativeη(opposite the photon-going direction) where the gluon fraction is largest and reach maximal values of 1 and 2% for the response and composition components, respectively.
The jet response systematic uncertainties, combined in quadrature, have a complicated dependence onzγ andxAsince these have a non-linear dependence on the jetpTand rapidities. In most cases, the dominant contribution to the jet response systematic uncertainty arises from the in situcalibration. However, at small zγ, xA, or HT, the contribution from the JER uncertainty is comparable. Generally, the relative systematic uncertainties on the measured cross-sections rising from jet response are largest for the extreme values of xA and zγ where the differential cross-sections are the steepest. At intermediate zγ and xA, where the cross-sections are the flattest, the jet response systematic uncertainties are smaller than the