ATLAS-CONF-2016-045 08August2016
ATLAS NOTE
ATLAS-CONF-2016-045
6th August 2016
Search for new high-mass resonances in the dilepton final state using proton–proton collisions at √
s = 13 TeV with the ATLAS detector
The ATLAS Collaboration
Abstract
A search is conducted for resonant high-mass new phenomena in dielectron and dimuon final states. The search uses 13.3 fb
−1of proton–proton collision data, collected at
√s
=13 TeV by the ATLAS experiment at the LHC in 2015 and 2016. The dilepton invariant mass is used as the discriminating variable. No significant deviation from the Standard Model prediction is observed. Upper limits at 95% credibility level are set on the cross- section times branching ratio for resonances decaying to dileptons, which are converted into lower limits on the resonance mass, ranging between 3.36 TeV and 4.05 TeV, depending on the model.
c
2016 CERN for the benefit of the ATLAS Collaboration.
Reproduction of this article or parts of it is allowed as specified in the CC-BY-4.0 license.
1 Introduction
The dilepton (ee or
µµ) final-state signature has excellent sensitivity to a wide variety of new phenomenaexpected in theories beyond the Standard Model (SM). It benefits from high signal selection e
fficiencies and relatively small, well-understood backgrounds.
Models with extended gauge groups often feature additional U (1) symmetries with corresponding heavy spin-1 Z
0bosons whose decay would manifest itself as a narrow resonance in the dilepton mass spectrum.
Grand Unified Theories (GUT) have inspired models based on the E
6gauge group [1, 2], which, for a particular choice of symmetry-breaking pattern, includes two neutral gauge bosons that mix with an angle
θE6. This mixing yields a physical state defined by Z
0(θ
E6)
=Z
ψ0cos
θE6+Z
0χsin
θE6, where the gauge fields Z
ψ0and Z
χ0are associated with two separate U (1) groups resulting from the breaking of the E
6symmetry. All Z
0signals in this model are defined by specific values of
θE6ranging from
−πto
π, andthe six commonly motivated cases are investigated in this search, namely Z
ψ0, Z
η0, Z
N0, Z
0I, Z
S0, and Z
0χ. The widths of these states vary from 0.5% to 1.2% of the resonance mass, respectively. In addition to the GUT-inspired E
6models, the Sequential Standard Model (SSM) [2] provides a common benchmark model that includes a Z
SSM0boson with couplings to fermions identical to those of the SM Z boson.
This search is also sensitive to a series of other models that predict the presence of narrow dilepton resonances; however, constraints on these models are not explicitly evaluated in this note. These models include the Randall–Sundrum (RS) model [3] with a warped extra dimension giving rise to spin-2 graviton excitations, the quantum black hole model [4], the Z
∗model [5], and the minimal walking technicolour model [6].
The most sensitive previous searches for a Z
0decaying to the dilepton final state were carried out by the ATLAS and CMS collaborations [7, 8]. Using 3.2 fb
−1of pp collision data at
√s
=13 TeV collected in 2015, ATLAS set a lower limit at 95% credibility level (CL) on the Z
SSM0pole mass of 3.36 TeV for the combined ee and
µµchannels. Similar limits were set by CMS using the 2015 dataset.
In this note, a search for resonant new phenomena is presented using the observed ee and
µµmass spectra extracted from pp collisions with the ATLAS detector at the Large Hadron Collider (LHC) operating at
√
s
=13 TeV, corresponding to an integrated luminosity of 13.3 fb
−1. The analysis and interpretation of these spectra rely primarily on simulated samples of signal and background processes. The inter- pretation is performed taking into account the expected shape of di
fferent signals in the dilepton mass distribution.
2 ATLAS detector
The ATLAS experiment [9, 10] at the LHC is a multi-purpose particle detector with a forward-backward symmetric cylindrical geometry and a near 4π coverage in solid angle.
1It consists of an inner tracking detector surrounded by a thin superconducting solenoid providing a 2 T axial magnetic field, electromag- netic and hadronic calorimeters, and a muon spectrometer. The inner tracking detector (ID) covers the
1ATLAS uses a right-handed coordinate system with its origin at the nominal interaction point (IP) in the centre of the detector and thez-axis along the beam pipe. The x-axis points from the IP to the centre of the LHC ring, and the y-axis points upwards. Cylindrical coordinates (r, φ) are used in the transverse plane, φ being the azimuthal angle around thez-axis.
The pseudorapidity is defined in terms of the polar angleθasη =−ln tan(θ/2). Angular distance is measured in units of
∆R≡p
(∆η)2+(∆φ)2.
pseudorapidity range
|η| <2.5. It consists of silicon pixel, silicon microstrip, and transition-radiation tracking detectors. Lead/liquid-argon (LAr) sampling calorimeters provide electromagnetic (EM) energy measurements with high granularity. A hadronic (steel
/scintillator-tile) calorimeter covers the central pseudorapidity range (|η
| <1.7). The endcap and forward regions are instrumented with LAr calorimet- ers for EM and hadronic energy measurements up to
|η|=4.9. The total thickness of the EM calorimeter is more than twenty radiation lengths. The muon spectrometer (MS) surrounds the calorimeters and is based on three large superconducting air-core toroids with eight coils each. The field integral of the tor- oids ranges between 2.0 and 6.0 T m for most of the detector. The MS includes a system of precision tracking chambers and fast detectors for triggering. A dedicated trigger system is used to select events.
The first-level trigger is implemented in hardware and uses the calorimeter and muon detectors to reduce the accepted rate to below 100 kHz. This is followed by a software-based trigger that reduces the accepted event rate to 1 kHz on average.
3 Data and Monte Carlo samples
The data sample used in this analysis was collected during the 2015 and 2016 LHC runs with pp collisions at
√s
=13 TeV. Excluding periods of data-taking without all relevant detectors functional, the data set used for the analysis corresponds to 13.3 fb
−1of integrated luminosity. Event quality is also checked to remove those events which contain noise bursts or coherent noise in the calorimeters.
Modelling of the various background sources primarily relies on Monte Carlo (MC) simulation. The dom- inant background contribution arises from the Drell-Yan (DY) process [11]. Other background sources originate from top-quark [12] and diboson (W W, W Z, Z Z) [13] production. In the case of the dielectron channel, multi-jet and W
+jets processes (which contribute due to the misidentification of jets as electrons)are estimated using a data-driven method, described in Section 5.
DY events are simulated using P
owheg-
boxv2 [14] at next-to-leading order (NLO) in Quantum Chro- modynamics (QCD), and interfaced to the P
ythia8.186 [15] parton shower model. The CT10 parton distribution function (PDF) set [16] is used in the matrix element calculation. The AZNLO [17] set of tuned parameters (“tune”) is used, with the CTEQ6L1 PDF set [18], for the modelling of non-perturbative effects. The EvtGen v1.2.0 program [19] is used for properties of the bottom and charm hadron decays.
P
hotos++version 3.52 [20] is used for Quantum Electrodynamic (QED) emissions from electroweak vertices and charged leptons. Event yields are corrected with a mass-dependent rescaling to next-to- next-to-leading order (NNLO) in the QCD coupling constant, computed with VRAP 0.9 [21] and the CT14NNLO PDF set [22]. The NNLO QCD corrections are a factor of
∼0.98 at m
`` =3 TeV. Mass- dependent electroweak (EW) corrections are computed at NLO with M
csanc1.20 [23]. The NLO EW corrections are a factor of
∼0.86 at m
``=3 TeV. Those include photon-induced contributions (γγ
→``via t- and u-channel processes) computed with the MRST2004QED PDF set [24].
Diboson processes with four charged leptons, three charged leptons and one neutrino, or two charged
leptons and two neutrinos are simulated using the S
herpa2.1.1 generator [25]. The matrix elements
contain all diagrams with four electroweak vertices. They are calculated for up to one (4`, 2`
+2ν) or no
additional partons (3`
+1ν) at NLO. Diboson processes with one of the bosons decaying hadronically andthe other leptonically are simulated using the S
herpa2.1.1 generator. They are calculated for up to one
(Z Z) or no (W W, W Z) additional partons at NLO. All are calculated with up to three additional partons
at leading-order (LO) using the Comix [26] and OpenLoops [27] matrix element generators and merged
with the S
herpaparton shower [28] using the ME+PS@NLO prescription [29]. The CT10 PDF set is
used in conjunction with dedicated parton shower tuning developed by the S
herpaauthors. The S
herpadiboson sample cross-section was scaled down to account for its use of
αQ E D=1/129 rather than 1/132corresponding to the use of current PDG parameters as input to the G
µscheme. Background processes involving bosons decaying into tau lepton(s) were found to have a negligible contribution, and as such are not included.
For the generation of t t ¯ and single top quarks in the W t-channel and s-channel, the P
owheg-
boxv2 gen- erator with the CT10 PDF set in the matrix element calculations is used. EW t-channel single-top-quark events are generated using the P
owheg-
boxv1 generator. This generator uses the four-flavour scheme for the NLO matrix elements calculations together with the fixed four-flavour PDF set CT10f4 [16]. For all top-quark processes, top-quark spin correlations are preserved (for t-channel, top quarks are decayed using MadSpin [30]). The parton shower, fragmentation, and the underlying event are simulated using P
ythia6.428 [31] with the CTEQ6L1 PDF set and the Perugia 2012 tune (P2012) [32]. The top-quark mass is set to 172.5 GeV. The EvtGen v1.2.0 program is used for properties of the bottom and charm had- ron decays. The t t ¯ and single-top-quark MC samples are normalised to a cross-section as calculated with the Top
++2.0 program [33], which is accurate to NNLO in perturbative QCD, including resummation of next-to-next-to-leading logarithmic soft gluon terms.
Signal processes are produced at LO using P
ythia8.186 with the NNPDF23LO PDF set [34] and A14 tune [35] for event generation, parton showering and hadronisation. Interference e
ffects (such as with DY production) are not included. Higher-order QCD corrections are computed and applied as for the DY background. EW corrections are not applied to the signal samples due to the large model dependence.
The detector response is simulated with G
eant4 [36], and the events are processed with the same recon- struction software [37] as used for the data. Furthermore, the distribution of the number of additional simulated pp collisions in the same or neighbouring beam crossings (pile-up) is accounted for by over- laying simulated minimum-bias events and re-weighting the MC to match the distribution observed in the data.
4 Event selection
In the central region of the ATLAS detector (|η|
<2.47) electrons are reconstructed by combining calor- imetric and tracking information as described in Ref. [38]. The transition region between the central and forward regions of the calorimeters, in the range 1.37
≤|η|≤1.52, exhibits degraded energy resolu- tion and is therefore excluded. A likelihood discriminant is built to suppress electron candidates resulting from hadronic jets, photon conversions, Dalitz decays and semileptonic heavy-flavour hadron decays. The likelihood discriminant utilises lateral and longitudinal shower shape, tracking and cluster–track match- ing quantities. Several operating points are defined for the likelihood discrimination. In this analysis, the Medium working point is used in the search, and the Very Loose and Loose working points are used in the data-driven background estimation described in Section 5. In addition to the likelihood discriminant, selection criteria based on track quality are applied. The selection efficiency is approximately 96% for electrons with transverse energy (E
T) between 30 GeV and 500 GeV, and drops to approximately 95% for electrons with E
T=1.5 TeV. The selection efficiency modelling is evaluated in the data using a tag-and- probe method [39] up to E
Tof 500 GeV and the uncertainties due to the modelling of the shower shape variables are evaluated for electrons with higher E
Tusing MC, as described in Section 6. The electron energy scale and resolution have been calibrated up to E
Tof 500 GeV using data taken at
√s
=8 TeV [40].
The energy resolution for high-E
Telectrons is approximately 1%.
To suppress background from misidentified jets as well as from light- and heavy-flavour hadron decays inside jets, electrons are required to satisfy calorimeter-based and track-based isolation criteria with a fixed e
fficiency of 99% over the full range of electron momentum. The calorimeter-based isolation re- lies on the ratio of the transverse energy deposited in a cone of size
∆R =0.2, centred at the electron cluster barycentre, to the total transverse energy (E
T) measured for the electron. Likewise, the track- based isolation relies on the ratio of the scalar sum of transverse momenta of tracks within a cone of size
∆R=
10 GeV/p
Tto the transverse momentum (p
T) of the electron track. The tracks are required to have p
T >1 GeV,
|η| <2.5, meet all track quality criteria, and originate from the primary vertex, defined as the vertex with the highest sum of track p
T2.
Candidate muon tracks are, at first, reconstructed independently in the ID and the MS [41]. The two tracks are then used as input to a combined fit which takes into account the energy loss in the calorimeter and multiple-scattering e
ffects. The ID track used for the combined fit is required to be within the ID acceptance,
|η| <2.5, and to have a minimum number of hits in each ID sub-system. Muon candidates in the overlap of the MS barrel and endcap region (1.01
< |η| <1.10) are rejected due to the potential for p
Tmismeasurement resulting from relative barrel–endcap misalignment. In order to reduce the back- ground from light- and heavy-hadron decays inside jets, muons are required to fulfil track-based isolation requirements which are similar to those applied to electron candidates, with a fixed efficiency of 99%.
Since momentum resolution is a key ingredient of this analysis, muon tracks are required to have at least three hits in each of three precision chambers in the MS and not to traverse regions of the MS which are poorly aligned. This requirement reduces the muon reconstruction efficiency by about 20% for muons with a p
Tgreater than 1.5 TeV. Finally, the q/p (charge divided by momentum) measurements performed independently in the ID and MS must agree within seven standard deviations, calculated from the sum in quadrature of the ID and MS momentum uncertainties.
Events with two high-E
Telectrons or high-p
Tmuons, satisfying the criteria described above, are selected in data and MC samples, in order to search for signals of new physics in the high-mass dilepton spectrum.
In the dielectron channel, a two-electron trigger based on the Loose identification criteria with an E
Tthreshold of 17 GeV for each electron is used. Events in the dimuon channel are required to pass at least one of two single-muon triggers with p
Tthresholds of 26 GeV and 50 GeV, with the former also requiring the muon to be isolated. These triggers select events from a simulated sample of Z
0χwith a pole mass of 3 TeV with an e
fficiency of about 87% and 94% for the dielectron and dimuon channels, respectively.
Electron (muon) candidates are required to have E
T(p
T) greater than 30 GeV, to have a transverse impact parameter consistent with the beam-line, and to pass near to the interaction point in the z coordinate.
Events are required to have at least one reconstructed primary vertex and at least one pair of same-flavour lepton candidates.
Only the electron (muon) pair with the highest scalar sum of E
T( p
T) is retained in each event and an opposite-charge requirement is applied in the dimuon case. The opposite-charge requirement is not ap- plied in the dielectron channel due to higher chance of charge misidentification for high-E
Telectrons.
Energy (momentum) calibration and resolution smearing are applied to electron (muon) candidates in the simulated samples to match the performance observed in data [40, 41]. Data-derived corrections are applied in the simulated samples to match the trigger, reconstruction and isolation efficiencies.
Representative values of the total acceptance times e
fficiency for a Z
0χboson with a pole mass of 3 TeV
are 73% in the dielectron channel and 44% in the dimuon channel.
5 Background estimation
The backgrounds from processes producing two real leptons in the final state are modelled using MC simulated samples as described in Section 3. The processes for which MC simulation is used are: DY, t¯ t and single-top-quark, and diboson (W W, W Z, and Z Z) production.
In the dimuon channel, contributions from W
+jets and multi-jet production are negligible, and therefore are not included in the expected yield. However, the W
+jets, multi-jet and other production processes, where at most one real electron is produced, do contribute to the selected ee sample due to having one or more hadronic jets satisfying the electron selection criteria — so called “fakes”. The contribution from these processes is estimated simultaneously with a data-driven technique, the matrix method, described in Ref. [42]. In this technique, probabilities for electrons and jets to pass electron candidate selection are used. Probabilities of electron identification are estimated from MC simulated DY samples in several bins of E
Tand
|η|. Probabilities of jet misidentification as an electron in different E
Tbins are estimated in data samples triggered on the presence of a Very Loose or a Loose electron candidate. The estimate is extrapolated by fitting a smooth function to the m
eedistribution between 120 and 600 GeV to mitigate e
ffects of limited event counts in the high-mass region and of method instability due to a fractionally very small fake component contribution in the Z peak region. The uncertainties in this background estimate are evaluated by considering differences in the estimates for events with same-charge and opposite-charge electrons as well as by varying the electron identification probabilities and changing the parameters of the extrapolation functions.
6 Systematic uncertainties
Systematic uncertainties estimated to have a non-neglibile impact on the expected cross-section limit are considered as nuisance parameters in the statistical interpretation and include both the theoretical and experimental e
ffects on the total background and experimental e
ffects on the signal.
Theoretical uncertainties in the background prediction are dominated by the DY background in this search. They arise from the PDF eigenvector variations of the nominal PDF set, as well as variations of PDF scale,
αS, EW corrections, and photon-induced (PI) corrections. The effects of different PDF set choices are also considered. At generator level, the theoretical uncertainties are the same for the dielec- tron and dimuon channels, but result in di
fferent uncertainties at reconstruction level, due to the di
ffering resolutions between the two channels. The PDF variation uncertainty is obtained using the 90% C.L.
CT14NNLO PDF error set and by following the procedure described in Refs. [42–44]. Rather than using
a single nuisance parameter to describe the 28 eigenvectors of this PDF error set, which could lead to
an underestimation of its effect, a re-diagonalised set of 7 PDF eigenvectors was used [22], which are
treated as separate nuisance parameters. The sum in quadrature of these eigenvectors matches the ori-
ginal CT14NNLO error envelope well. The uncertainties due to the variation of PDF scale and
αSare
derived using VRAP with the former obtained by varying the renormalisation and factorisation scales of
the nominal CT14NNLO PDF up and down simultaneously by a factor of two. The value of
αSused
(0.118) is varied by
±0.003. The EW correction uncertainty was assessed by comparing the nominal
additive (1
+δEW+δQCD) treatment with the multiplicative approximation ((1
+δEW)(1
+δQCD)) treatment
of the EW correction in the combination of the higher-order EW and QCD effects. The uncertainty in
the photon-induced correction is calculated based on the uncertainty of the quark masses and the photon
PDF. An additional uncertainty is derived due to the choice of nominal PDF set, by comparing the central
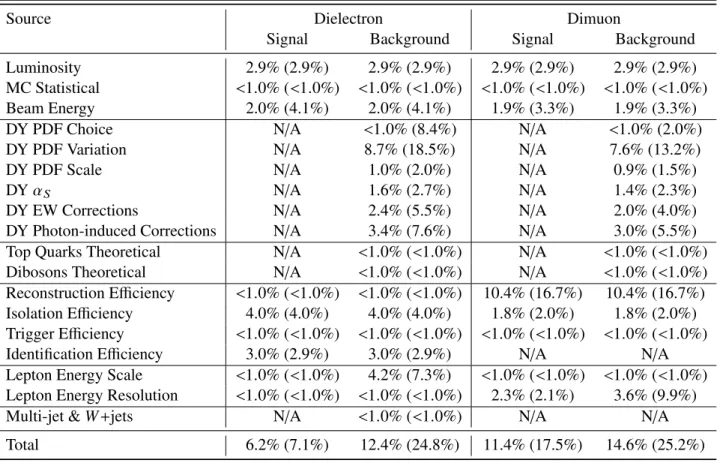
Table 1: Summary of the relative systematic uncertainties in the expected number of events at a dilepton mass of 2 TeV (4 TeV). The values quoted for the background represent the relative change in the total expected number of events in the givenm``histogram bin containing the given reconstructedm``mass of 2 TeV (4 TeV). For the signal uncertainties the values were computed using aZ0χsignal model with a pole mass of 2 TeV (4 TeV) by comparing yields in the core of the mass peak (within the full width at half maximum) between the distribution varied under a given uncertainty and the nominal distribution. “N/A" represents cases where the uncertainty is not applicable.
Source Dielectron Dimuon
Signal Background Signal Background
Luminosity 2.9% (2.9%) 2.9% (2.9%) 2.9% (2.9%) 2.9% (2.9%)
MC Statistical
<1.0% (<1.0%) <1.0% (<1.0%) <1.0% (<1.0%) <1.0% (<1.0%)Beam Energy 2.0% (4.1%) 2.0% (4.1%) 1.9% (3.3%) 1.9% (3.3%)
DY PDF Choice N/A
<1.0% (8.4%)N/A
<1.0% (2.0%)DY PDF Variation N
/A 8.7% (18.5%) N
/A 7.6% (13.2%)
DY PDF Scale N
/A 1.0% (2.0%) N
/A 0.9% (1.5%)
DY
αSN/A 1.6% (2.7%) N/A 1.4% (2.3%)
DY EW Corrections N
/A 2.4% (5.5%) N
/A 2.0% (4.0%)
DY Photon-induced Corrections N
/A 3.4% (7.6%) N
/A 3.0% (5.5%)
Top Quarks Theoretical N
/A
<1.0% (<1.0%)N
/A
<1.0% (<1.0%)Dibosons Theoretical N/A
<1.0% (<1.0%)N/A
<1.0% (<1.0%)Reconstruction Efficiency
<1.0% (<1.0%) <1.0% (<1.0%)10.4% (16.7%) 10.4% (16.7%) Isolation Efficiency 4.0% (4.0%) 4.0% (4.0%) 1.8% (2.0%) 1.8% (2.0%) Trigger E
fficiency
<1.0% (<1.0%) <1.0% (<1.0%) <1.0% (<1.0%) <1.0% (<1.0%)Identification Efficiency 3.0% (2.9%) 3.0% (2.9%) N/A N/A
Lepton Energy Scale
<1.0% (<1.0%)4.2% (7.3%)
<1.0% (<1.0%) <1.0% (<1.0%)Lepton Energy Resolution
<1.0% (<1.0%) <1.0% (<1.0%)2.3% (2.1%) 3.6% (9.9%)
Multi-jet & W
+jetsN/A
<1.0% (<1.0%)N/A N/A
Total 6.2% (7.1%) 12.4% (24.8%) 11.4% (17.5%) 14.6% (25.2%)
values of CT14NNLO with those from other PDF sets as recommended by the PDF4LHC forum [44], namely MMHT14 [45] and NNPDF3.0 [46]. The maximum absolute deviation from the envelope of these comparisons is used as the PDF choice uncertainty, where it is larger than the CT14NNLO PDF eigenvector variation envelope. Theoretical uncertainties are not applied to the signal prediction in the statistical interpretation.
Theoretical uncertainties in the t¯ t and diboson backgrounds were also considered. The t¯ t MC sample is normalised to a cross-section of
σtt¯=832
+−2920(scale)
±35 (PDF
+ αS) pb, calculated with the Top
++2.0 program as described in Section 3. The first uncertainty comes from the independent variation of the factorisation and renormalisation scales,
µFand
µR, while the second one is associated to variations in the PDF and
αS, following the PDF4LHC prescription. Normalisation uncertainties in the top quarks and diboson background were found to be negligible. These sources of systematic uncertainty are included in the “Top Quarks Theoretical” and “Dibosons Theoretical” entry in Table 1.
The following sources of experimental uncertainty are accounted for: lepton trigger, identification, recon-
struction, and isolation e
fficiency, lepton energy scale and resolution, multi-jet and W
+jets background estimate. Efficiencies are evaluated using events from the Z
→ ``peak and then extrapolated to high energies. The uncertainty in the muon reconstruction e
fficiency is the largest experimental uncertainty in the dimuon channel. It includes the uncertainty obtained from Z
→ µµdata studies and a high-p
Textrapolation uncertainty corresponding to the magnitude of the decrease in the muon reconstruction and selection e
fficiency with increasing p
Tthat is predicted by the MC simulation. The e
ffect on the muon reconstruction e
fficiency was found to be approximately 3% per TeV as a function of muon p
T. The un- certainty in the electron identification efficiency extrapolation is based on the differences in the electron shower shapes in the EM calorimeters between data and MC simulation in the Z
→ee peak, which are propagated to the high-E
Telectron sample. The e
ffect on the electron identification e
fficiency was found to be 2.0% and is independent of E
Tfor electrons with E
Tabove 150 GeV. Mismodelling of the muon momentum resolution due to residual misalignments in the MS can alter the steeply falling background shape at high dilepton mass and can significantly modify the width of the signal line shape. This uncer- tainty is obtained by studying dedicated data-taking periods with no magnetic field in the MS [41]. For the dielectron channel, the uncertainty includes a contribution from the multi-jet and W
+jets data-driven estimate that is obtained by varying both the overall normalisation and the extrapolation methodology, which is explained in Section 5. Luminosity uncertainty of 2.9% was calculated using the same method- ology as for
√s
=7 TeV [47]. Systematic uncertainties used in the statistical analysis of the results are summarised in Table 1 at dilepton mass values of 2 TeV and 4 TeV.
7 Event yields
Expected and observed event yields, in bins of invariant mass, are shown in Table 2 for the dielectron channel, and in Table 3 for the dimuon channel. Expected event yields are split into the different back- ground sources and the yields for two signal scenarios are also provided. The DY process is dominant over the entire mass range. In general, the observed data are in good agreement with the SM prediction, taking uncertainties into account as described in Section 6. A deficit is observed for the dimuon channel in the invariant mass region between 300 GeV and 500 GeV. Extensive cross-checks were performed in this region, and the deficit was quantified by calculating the local Poisson p-value, using the sources of systematic uncertainty described in Section 6, which gives a significance of -1.4
σfor this mass inter- val.
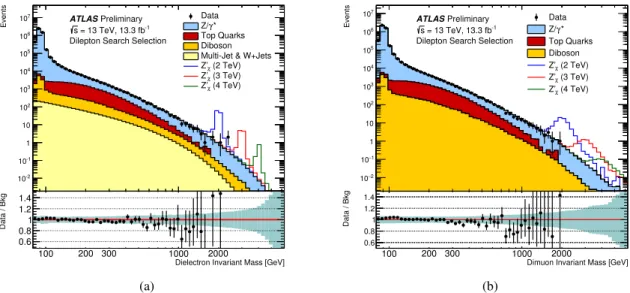
Distributions of m
``in the dielectron and dimuon channels are shown in Fig. 1. No significant excess is observed, as discussed in Section 8. The highest invariant mass event is found at 2.38 TeV, with second highest at 2.35 TeV, in the dielectron channel, and 1.98 TeV in the dimuon channel. All of these events appear to be very clean with little other detector activity.
8 Statistical analysis
A search for a resonant signal is performed using the m
``distribution in the dielectron and dimuon chan-
nels utilising the log-likelihood ratio (LLR) test described in Ref. [48]. To perform the LLR search, the
Histfactory [49] package, together with RooStats [50] and RooFit [51] packages are used. The p-value
for finding a Z
χ0signal excess (at a given pole mass) more significant than the observed, is computed
Table 2: Expected and observed event yields in the dielectron channel in different dilepton mass intervals. The quoted errors correspond to the combined statistical, theoretical, and experimental systematic uncertainties.
mee[GeV] 80–120 120–300 300–500 500–700
Drell-Yan 4550000±260000 85000±5000 3840±260 610±50 Top Quarks 10900±800 18600±1300 1810±140 212±18
Diboson 12000±1300 2900±310 304±34 54±6
Multi-Jet & W+jets 1000±1000 900±500 129±20 31±4 Total SM 4570000±260000 108000±5000 6080±300 900±50
Data 4626011 107141 5895 846
SM+Z0(mZ0=3 TeV) 4570000±260000 108000±5000 6080±300 900±50 SM+Z0(mZ0=4 TeV) 4570000±260000 108000±5000 6080±300 900±50 mee[GeV] 700–900 900–1200 1200–1800 1800–3000 3000–6000 Drell-Yan 156±13 67±6 23.1±2.4 3.3±0.4 0.126±0.024 Top Quarks 36.9±3.4 10.0±1.1 1.90±0.32 <0.001 <0.001 Diboson 14.6±1.7 6.2±0.8 2.18±0.27 0.277±0.034 0.0105±0.0013 Multi-Jet & W+jets 9.8±1.2 4.5±1.5 1.5±1.3 0.16±0.30 0.002±0.009 Total SM 218±14 88±6 28.7±2.7 3.7±0.5 0.139±0.026
Data 206 75 20 4 0
SM+Z0(mZ0=3 TeV) 218±14 88±6 28.9±2.7 10.3±2.0 3.7±1.9 SM+Z0(mZ0=4 TeV) 218±14 88±6 28.7±2.7 3.8±0.5 1.14±0.05
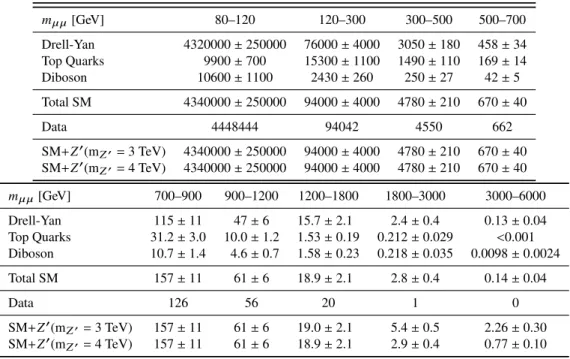
Table 3: Expected and observed event yields in the dimuon channel in different dilepton mass intervals. The quoted errors correspond to the combined statistical, theoretical, and experimental systematic uncertainties.
mµ µ[GeV] 80–120 120–300 300–500 500–700
Drell-Yan 4320000±250000 76000±4000 3050±180 458±34 Top Quarks 9900±700 15300±1100 1490±110 169±14
Diboson 10600±1100 2430±260 250±27 42±5
Total SM 4340000±250000 94000±4000 4780±210 670±40
Data 4448444 94042 4550 662
SM+Z0(mZ0=3 TeV) 4340000±250000 94000±4000 4780±210 670±40 SM+Z0(mZ0=4 TeV) 4340000±250000 94000±4000 4780±210 670±40 mµ µ[GeV] 700–900 900–1200 1200–1800 1800–3000 3000–6000 Drell-Yan 115±11 47±6 15.7±2.1 2.4±0.4 0.13±0.04 Top Quarks 31.2±3.0 10.0±1.2 1.53±0.19 0.212±0.029 <0.001 Diboson 10.7±1.4 4.6±0.7 1.58±0.23 0.218±0.035 0.0098±0.0024 Total SM 157±11 61±6 18.9±2.1 2.8±0.4 0.14±0.04
Data 126 56 20 1 0
SM+Z0(mZ0=3 TeV) 157±11 61±6 19.0±2.1 5.4±0.5 2.26±0.30 SM+Z0(mZ0=4 TeV) 157±11 61±6 18.9±2.1 2.9±0.4 0.77±0.10
analytically, using the test statistic q
0. The test statistic q
0is based on the logarithm of the profile likeli-
100 200 10002000
Events
10-2 10-1 1 10 102 103 104 105 106
107 Data
* Z/γ Top Quarks Diboson Multi-Jet & W+Jets
(2 TeV) Z’χ
(3 TeV) Z’χ
(4 TeV) Z’χ
Preliminary ATLAS
= 13 TeV, 13.3 fb-1
s
Dilepton Search Selection
Dielectron Invariant Mass [GeV]
100 200 300 1000 2000
Data / Bkg
0.6 0.8 1 1.2 1.4
(a)
Events
2 10−
1 10−
1 10 102 103 104 105 106
107 Data
* Z/γ Top Quarks Diboson
(2 TeV) Z’χ
(3 TeV) Z’χ
(4 TeV) Z’χ
Preliminary ATLAS
= 13 TeV, 13.3 fb-1
s
Dilepton Search Selection
Dimuon Invariant Mass [GeV]
100 200 300 1000 2000
Data / Bkg
0.6 0.8 1 1.2 1.4
(b)
Figure 1: Distributions of(a)dielectron and(b)dimuon reconstructed invariant mass distributions (m``) after selec- tion, for data and the SM background estimates as well as their ratio. SelectedZχ0 signals with a pole mass of 2, 3 and 4 TeV are overlaid. The bin width of the distributions is constant in log(m``) and the shaded band in the lower panel illustrates the total systematic uncertainty, as explained in Section6. The data points are shown together with their statistical uncertainty.
hood ratio
λ(µ) which includes a treatment of the systematic uncertainties. The parameter µis defined as a ratio of the signal production cross-section times branching ratio to the dilepton final state (σB) to its theoretically predicted value. The test statistic is modified for signal masses below 900 GeV to also quantify the significance of potential deficits in the data. The analytical calculation of p-values is cross- checked using MC simulations. Multiple mass hypotheses are tested in pole-mass steps corresponding to the histogram bin width to compute the local p-values — that is p-values corresponding to specific signal mass hypotheses. The chosen bin width for the m
``histogram corresponds to the resolution in the dielectron (dimuon) channel, which varies from 10 (60) GeV at m
`` =1 TeV to 15 (200) GeV at m
`` =2 TeV, and 20 (420) GeV at m
``=3 TeV. Pseudo-experiments are used to estimate the distribution of the lowest local p-value in the absence of any signal. The p-value to find anywhere in the m
``distribution (120–6000 GeV) an excess more significant than the one in the data (global p-value) is then computed.
Upper limits on the
σB for Z
0bosons are set in a Bayesian approach. The logarithmic m
``histogram binning shown in Fig. 1 uses 66 mass bins and is chosen for setting limits on resonant signals using Z
0χsignal templates. Invariant mass spectrum from 80 to 120 GeV is included in the likelihood as a single bin to aid constraining of mass-independent components of systematic uncertainties.
The prior probability is chosen to be uniform and positive in the Z
0cross-section. The upper 95% per-
centile of the posterior probability is then quoted as the upper 95% credibility-level limit on
σB. The
above calculations are performed with the Bayesian Analysis Toolkit (BAT) [52], which uses a Markov
Chain MC technique to integrate over the nuisance parameters. Limit values obtained using the exper-
imental data are quoted as observed limits, while median values of the limits from a large number of
pseudo-experiments, where only SM background is present, are quoted as the expected limits. The upper
limits on the
σB are interpreted as lower limits on the Z
0pole mass using the relationship between the
pole mass and the theoretical Z
0cross-section.
9 Results
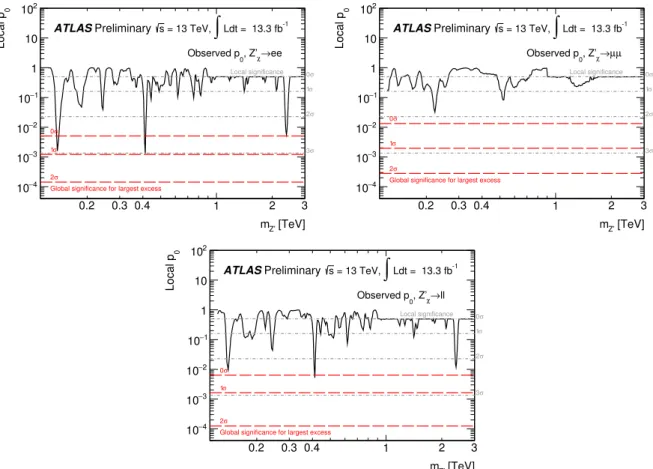
The statistical tests described in the previous section do not reveal the presence of a signal. The LLR tests for a Z
χ0find global p-values of 17%, 77% and 43% in the dielectron, dimuon, and combined channels, respectively. The local and global p-values as a function of the Z
0pole mass are shown in Fig. 2.
The largest deviation from the background-only hypothesis using the LLR tests for a Z
0χis observed at 2.38 TeV in the dielectron mass spectrum with a local significance of 2.6
σ, but is not globally significant(0.2
σ).[TeV]
mZ’
0.2 0.3 0.4 1 2 3
0Local p
−4
10
−3
10
−2
10
−1
10 1 10 102
σ Local significance 0
σ 1
σ 2
σ 3 σ
0
σ 1
σ 2
Global significance for largest excess
ATLASPreliminary s = 13 TeV,
∫
Ldt = 13.3 fb-1→ee , Z’χ
Observed p0
[TeV]
mZ’
0.2 0.3 0.4 1 2 3
0Local p
−4
10
−3
10
−2
10
−1
10 1 10 102
σ Local significance 0
σ 1
σ 2
σ 3 σ
0
σ 1
σ 2
Global significance for largest excess
ATLASPreliminary s = 13 TeV,
∫
Ldt = 13.3 fb-1 µ µχ→
0, Z’
Observed p
[TeV]
mZ’
0.2 0.3 0.4 1 2 3
0Local p
−4
10
−3
10
−2
10
−1
10 1 10 102
σ Local significance 0
σ 1
σ 2
σ 3 σ
0
σ 1
σ 2
Global significance for largest excess
ATLASPreliminary s = 13 TeV,
∫
Ldt = 13.3 fb-1→ll , Z’χ
Observed p0
Figure 2: The local p-value derived assumingZ0χ signal shapes with pole masses between 0.15 and 2.5 TeV. Ac- companying local and global significance levels are shown as dashed lines. Shown are results for the (upper-left) dielectron, (upper-right) dimuon, and (lower) dilepton channels. Theun-capped p0value is used for pole masses below 900 GeV, while thecapped p0value is used above.
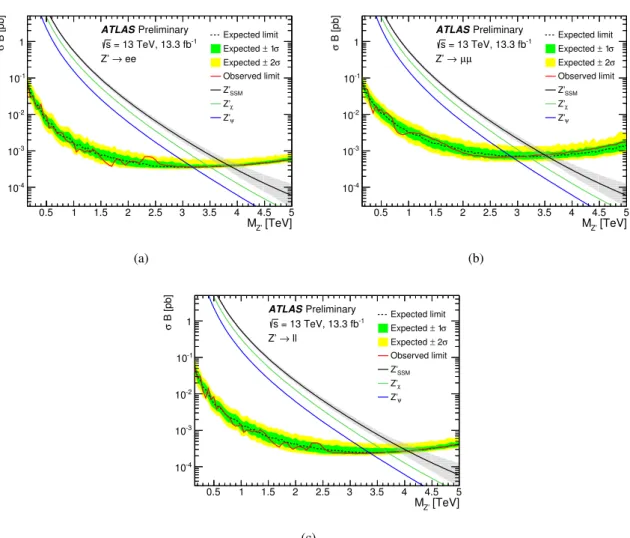
Upper limits on the cross-section times branching ratio (σB) for Z
0bosons are presented in Fig. 3. The
observed and expected lower pole-mass limits for various Z
0scenarios are summarised in Table 4. The
upper limits on
σB for Z
0bosons start to weaken above a pole mass of
∼3 TeV. This is mainly due to
the combined effect of a rapidly-falling signal cross-section as the kinematic limit is approached, and the
natural width of the resonance. The effect is more pronounced in the dimuon channel due to worse mass
resolution than in the dielectron channel. The selection e
fficiency also starts to slowly decrease at very
high pole mass, but this is a sub-dominant effect.
[TeV]
MZ’
0.5 1 1.5 2 2.5 3 3.5 4 4.5 5
B [pb]σ
10-4
10-3
10-2
10-1
1 Expected limit
1σ Expected ±
σ 2
± Expected Observed limit
Z’SSM
Z’χ
Z’ψ
Preliminary ATLAS
ee Z’ →
= 13 TeV, 13.3 fb-1
s
(a)
[TeV]
MZ’
0.5 1 1.5 2 2.5 3 3.5 4 4.5 5
B [pb]σ
10-4
10-3
10-2
10-1
1 Expected limit
1σ Expected ±
σ 2
± Expected Observed limit
Z’SSM
Z’χ
Z’ψ
Preliminary ATLAS
µ µ Z’ →
= 13 TeV, 13.3 fb-1
s
(b)
[TeV]
MZ’
0.5 1 1.5 2 2.5 3 3.5 4 4.5 5
B [pb]σ
10-4
10-3
10-2
10-1
1 Expected limit
σ 1
± Expected
2σ Expected ± Observed limit
Z’SSM
Z’χ
Z’ψ
Preliminary ATLAS
ll Z’ →
= 13 TeV, 13.3 fb-1
s
(c)
Figure 3: Upper 95% C.L. limits on the Z0 production cross section times branching ratio to two leptons as a function of Z0 pole mass (MZ0). Shown are results for the (a) dielectron channel, (b) dimuon channel and (c) combined channels. The signal theory lines are calculated with Pythia8 using the NNPDF23LO PDF set [34], and corrected to next-to-next-to-leading order in QCD using VRAP [21] and the CT14NNLO PDF set [22]. The signal theoretical uncertainties are shown as a band on theZSSM0 theory line for illustration purposes, but are not included in theσBlimit calculation.
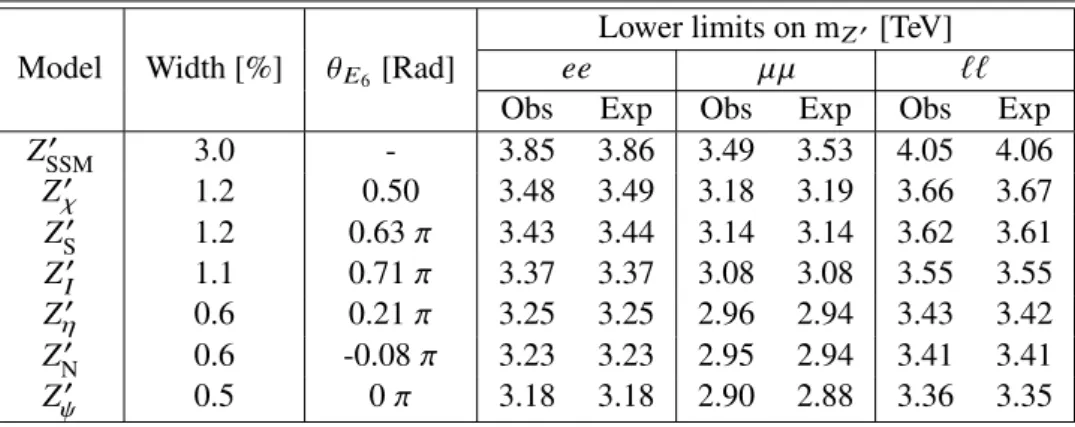
Table 4: Observed and expected 95% C.L. lower mass limits for variousZ0 gauge boson models. The widths are quoted as a percentage of the resonance mass.
Model Width [%]
θE6[Rad]
Lower limits on m
Z0[TeV]
ee
µµ ``Obs Exp Obs Exp Obs Exp
Z
SSM03.0 - 3.85 3.86 3.49 3.53 4.05 4.06
Z
χ01.2 0.50 3.48 3.49 3.18 3.19 3.66 3.67
Z
S01.2 0.63
π3.43 3.44 3.14 3.14 3.62 3.61 Z
I01.1 0.71
π3.37 3.37 3.08 3.08 3.55 3.55 Z
η00.6 0.21
π3.25 3.25 2.96 2.94 3.43 3.42
Z
N00.6 -0.08
π3.23 3.23 2.95 2.94 3.41 3.41
Z
ψ00.5 0
π3.18 3.18 2.90 2.88 3.36 3.35
10 Conclusions
The ATLAS detector at the Large Hadron Collider has been used to search for resonant new phenomena in the dilepton invariant mass spectrum above the Z -boson pole. The search is conducted with 13.3 fb
−1of pp collision data at
√s
=13 TeV, recorded during 2015 and 2016. The highest invariant mass event is found at 2.38 TeV in the dielectron channel, and 1.98 TeV in the dimuon channel. The observed dilepton invariant mass spectrum is consistent with the Standard Model prediction, within systematic and statistical uncertainties. Among a choice of di
fferent models, the data are interpreted in terms of resonant spin-1 Z
0gauge boson production. Upper limits are therefore set on the cross-section times branching ratio for a spin-1 Z
0gauge boson. The resulting lower mass limits are 4.05 TeV for the Z
SSM0, 3.66 TeV for the Z
0χ, and 3.36 TeV for the Z
ψ0. Other E
6Z
0models are also constrained in the range between those quoted for the Z
0χand Z
ψ0. This result is more stringent than the previous ATLAS result at
√s
=13 TeV obtained
with 2015 data, by up to 700 GeV.
References
[1] D. London and J. L. Rosner, Extra Gauge Bosons in E(6), Phys. Rev. D
34(1986) 1530.
[2] P. Langacker, The Physics of Heavy Z
0Gauge Bosons, Rev. Mod. Phys.
81(2009) 1199, arXiv:
0801.1345 [hep-ph].
[3] L. Randall and R. Sundrum, A Large Mass Hierarchy from a Small Extra Dimension, Phys. Rev.
Lett.
83(1999) 3370, arXiv: hep-ph/9905221.
[4] P. Meade and L. Randall, Black Holes and Quantum Gravity at the LHC, JHEP
05(2008) 003, arXiv: 0708.3017 [hep-ph].
[5] M. V. Chizhov, V. A. Bednyakov and J. A. Budagov, Proposal for chiral bosons search at LHC via their unique new signature, Phys. Atom. Nucl.
71(2008) 2096, arXiv: 0801.4235 [hep-ph].
[6] F. Sannino and K. Tuominen, Orientifold theory dynamics and symmetry breaking, Phys. Rev. D
71(2005) 051901, arXiv: hep-ph/0405209.
[7] ATLAS Collaboration, Search for high-mass new phenomena in the dilepton final state using proton–proton collisions at
√s
=13 TeV with the ATLAS detector, (2016), Submitted to Phys.
Lett. B, arXiv: 1607.03669 [hep-ex].
[8] CMS Collaboration, Search for a Narrow Resonance Produced in 13 TeV pp Collisions Decaying to Electron Pair or Muon Pair Final States, (2015),
url: http://cds.cern.ch/record/2114855.
[9] ATLAS Collaboration, The ATLAS Experiment at the CERN Large Hadron Collider, JINST
3(2008) S08003.
[10] ATLAS Collaboration, ATLAS Insertable B-Layer Technical Design Report, (2010),
url: http:
/ / cds . cern . ch / record / 1291633, ATLAS Insertable B-Layer Technical Design Report Ad- dendum, ATLAS-TDR-19-ADD-1 (2012),
URL: http://cds.cern.ch/record/1451888.
[11] ATLAS Collaboration, Monte Carlo Generators for the Production of a W or Z/γ
∗Boson in Association with Jets at ATLAS in Run 2, (2016),
url: http://cds.cern.ch/record/2120133.
[12] ATLAS Collaboration, Simulation of top quark production for the ATLAS experiment at
√s
=13 TeV, (2016),
url:http://cds.cern.ch/record/2120417.
[13] ATLAS Collaboration, Multi-Boson Simulation for 13 TeV ATLAS Analyses, (2016),
url:http:
//cds.cern.ch/record/2119986.
[14] S. Alioli et al., A general framework for implementing NLO calculations in shower Monte Carlo programs: the POWHEG BOX, JHEP
06(2010) 043, arXiv: 1002.2581 [hep-ex].
[15] T. Sjöstrand, S. Mrenna and P. Z. Skands, A Brief Introduction to PYTHIA 8.1, Comput. Phys.
Commun.
178(2008) 852, arXiv: 0710.3820 [hep-ph].
[16] H.-L. Lai et al., New parton distributions for collider physics, Phys. Rev. D
82(2010) 074024, arXiv: 1007.2241 [hep-ph].
[17] ATLAS Collaboration, Measurement of the Z/γ
∗boson transverse momentum distribution in pp collisions at
√s
=7 TeV with the ATLAS detector, JHEP
09(2014) 55, arXiv: 1406.3660 [hep-ex].
[18] J. Pumplin et al., New generation of parton distributions with uncertainties from global QCD analysis, JHEP
07(2002) 012, arXiv: hep-ph/0201195.
[19] D. J. Lange, The EvtGen particle decay simulation package, Nucl. Instrum. Meth. A
462(2001) 152.
[20] N. Davidson, T. Przedzinski and Z. Was, PHOTOS Interface in C
++: Technical and Physics Doc- umentation, Comput. Phys. Commun.
199(2016) 86, arXiv: 1011.0937 [hep-ph].
[21] C. Anastasiou et al., High precision QCD at hadron colliders: Electroweak gauge boson rapidity distributions at NNLO, Phys. Rev. D
69(2004) 094008, arXiv: hep-ph/0312266.
[22] S. Dulat et al., New parton distribution functions from a global analysis of quantum chromodynam- ics, Phys. Rev. D
93(2016) 033006, arXiv: 1506.07443 [hep-ph].
[23] S. G. Bondarenko and A. A. Sapronov, NLO EW and QCD proton-proton cross section calculations with mcsanc-v1.01, Comput. Phys. Commun.
184(2013) 2343, arXiv: 1301.3687 [hep-ph].
[24] A. D. Martin et al., Parton distributions incorporating QED contributions, Eur. Phys. J. C
39(2005) 155, arXiv: hep-ph/0411040 [hep-ph].
[25] T. Gleisberg et al., Event generation with SHERPA 1.1, JHEP
02(2009) 007, arXiv: 0811.4622 [hep-ph].
[26] T. Gleisberg and S. Höche, Comix, a new matrix element generator, JHEP
12(2008) 039, arXiv:
0808.3674 [hep-ph].
[27] F. Cascioli, P. Maierhofer and S. Pozzorini, Scattering Amplitudes with Open Loops, Phys. Rev.
Lett.
108(2012) 111601, arXiv: 1111.5206 [hep-ph].
[28] S. Schumann and F. Krauss, A Parton shower algorithm based on Catani-Seymour dipole factor- isation, JHEP
03(2008) 038, arXiv: 0709.1027 [hep-ph].
[29] S. Höche et al., QCD matrix elements
+parton showers: The NLO case, JHEP
04(2013) 027, arXiv: 1207.5030 [hep-ph].
[30] P. Artoisenet et al., Automatic spin-entangled decays of heavy resonances in Monte Carlo simula- tions, JHEP
03(2013) 015, arXiv: 1212.3460 [hep-ph].
[31] T. Sjöstrand, S. Mrenna and P. Z. Skands, PYTHIA 6.4 Physics and Manual, JHEP
05(2006) 026, arXiv: hep-ph/0603175.
[32] P. Z. Skands, Tuning Monte Carlo Generators: The Perugia Tunes, Phys. Rev. D
82(2010) 074018, arXiv: 1005.3457 [hep-ph].
[33] M. Czakon and A. Mitov, Top
++: A Program for the Calculation of the Top-Pair Cross-Section at Hadron Colliders, Comput. Phys. Commun.
185(2014) 2930, arXiv: 1112.5675 [hep-ph].
[34] R. D. Ball et al., Parton distributions with LHC data, Nucl. Phys. B
867(2013) 244, arXiv: 1207.
1303 [hep-ph].
[35] ATLAS Collaboration, ATLAS Pythia 8 tunes to 7 TeV data, ATL-PHYS-PUB-2014-021, 2014,
url:http://cds.cern.ch/record/1966419.
[36] S. Agostinelli et al., GEANT4: A Simulation toolkit, Nucl. Instrum. Meth. A
506(2003) 250.
[37] ATLAS Collaboration, The ATLAS Simulation Infrastructure, Eur. Phys. J. C
70(2010) 823, arXiv:
1005.4568 [hep-ph].
[38] ATLAS Collaboration, Electron e
fficiency measurements with the ATLAS detector using the 2012 LHC proton–proton collision data, ATLAS-CONF-2014-032, 2014,
url:http://cdsweb.cern.
ch/record/1706245.
[39] ATLAS Collaboration, Electron e
fficiency measurements with the ATLAS detector using the 2015 LHC proton-proton collision data, ATLAS-CONF-2016-024, 2016,
url: https://cds.cern.
ch/record/2157687.
[40] ATLAS Collaboration, Electron and photon energy calibration with the ATLAS detector using LHC Run 1 data, Eur. Phys. J. C
74(2014) 3071, arXiv: 1407.5063 [hep-ex].
[41] ATLAS Collaboration, Muon reconstruction performance of the ATLAS detector in proton–proton collision data at
√s
=13 TeV, Eur. Phys. J. C
76(2016) 292, arXiv: 1603.05598 [hep-ex].
[42] ATLAS Collaboration, Search for high-mass dilepton resonances in pp collisions at
√s
=8 TeV with the ATLAS Detector, Phys. Rev. D
90(2014) 052005, arXiv: 1405.4123 [hep-ex].
[43] J. Gao and P. Nadolsky, A meta-analysis of parton distribution functions, JHEP
07(2014) 035, arXiv: 1401.0013 [hep-ph].
[44] J. Butterworth et al., PDF4LHC recommendations for LHC Run II, J. Phys. G
43(2016) 023001, arXiv: 1510.03865 [hep-ph].
[45] P. Motylinski et al., Updates of PDFs for the 2nd LHC run, (2014), arXiv: 1411.2560 [hep-ph].
[46] R. D. Ball et al., Parton distributions for the LHC Run II, JHEP
04(2015) 040, arXiv: 1410.8849 [hep-ph].
[47] ATLAS Collaboration, Improved luminosity determination in pp collisions at sqrt(s)
=7 TeV using the ATLAS detector at the LHC, Eur. Phys. J. C
73(2013) 2518, arXiv: 1302.4393 [hep-ex].
[48] G. Cowan et al., Asymptotic formulae for likelihood-based tests of new physics, Eur. Phys. J. C
71(2011) 1554, arXiv: 1007.1727 [physics.data-an], Erratum: Eur. Phys. J. C
73(2013) 2501.
[49] K. Cranmer et al., HistFactory: A tool for creating statistical models for use with RooFit and RooStats, (2012),
url: http://cds.cern.ch/record/1456844.
[50] L. Moneta et al., The RooStats project, (2010), arXiv: 1009.1003 [physics.data-an].
[51] W. Verkerke and D. P. Kirkby, The RooFit toolkit for data modeling, (2003), arXiv: physics / 0306116.
[52] A. Caldwell, D. Kollar and K. Kroninger, BAT: The Bayesian Analysis Toolkit, Comput. Phys.
Commun.
180(2009) 2197, arXiv: 0808.2552 [physics.data-an].
Appendix
30 100200 1000 2000
Events
10-2 10-1 1 10 102 103 104 105 106 107
108 Data
* Z/γ Top Quarks Diboson Multi-Jet & W+Jets
(2 TeV) Z’χ
(3 TeV) Z’χ
(4 TeV) Z’χ
Preliminary ATLAS
= 13 TeV, 13.3 fb-1
s
Dilepton Search Selection > 120 GeV mee
[GeV]
Leading and Subleading Electron ET
30 40 100 200 300 1000 2000
Data / Bkg
0.6 0.8 1 1.2 1.4
Events
2 10−
1 10−
1 10 102 103 104 105 106 107
Data
* Z/γ Top Quarks Diboson
(2 TeV) Z’χ
(3 TeV) Z’χ
(4 TeV) Z’χ
Preliminary ATLAS
= 13 TeV, 13.3 fb-1
s
Dilepton Search Selection > 120 GeV
µ
mµ
[GeV]
Leading and Subleading Muon pT
30 40 100 200 300 1000 2000
Data / Bkg
0.6 0.8 1 1.2 1.4
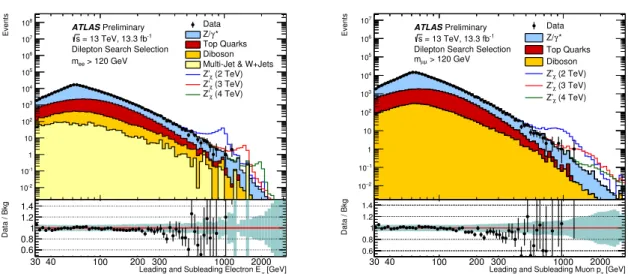
Figure 4: Reconstructed leptonET (or pT) distribution after selection for the (left column) dielectron and (right column) dimuon channels. “Leading” denotes the electron (muon) with the highestET(pT) of the selected pair, while “Subleading” denotes the second highestET(pT) electron (muon). The distributions are shown for dilepton invariant masses greater than 120 GeV. Data and the SM background estimates as well as their ratio are displayed, along with three selected resonant signals overlaid, Z0χ with a pole mass of 2, 3, and 4 TeV. The shaded band in the lower panel illustrates the total systematic uncertainty, as explained in Section6. The data points are shown together with their statistical uncertainty.
-3 -2 -1 0 1 2 3
Events
5000 10000 15000 20000
25000 Data
* Z/γ Top Quarks Diboson Multi-Jet & W+Jets
(2 TeV) Z’χ
(3 TeV) Z’χ
(4 TeV) Z’χ
Preliminary ATLAS
= 13 TeV, 13.3 fb-1
s
Dilepton Search Selection > 120 GeV mee
Leading and Subleading Electron η
-3 -2 -1 0 1 2 3
Data / Bkg
0.6 0.8 1 1.2 1.4
Events
0 2000 4000 6000 8000 10000 12000 14000 16000 18000 20000 22000 24000
Data
* Z/γ Top Quarks Diboson
(2 TeV) Z’χ
(3 TeV) Z’χ
(4 TeV) Z’χ
Preliminary ATLAS
= 13 TeV, 13.3 fb-1
s
Dilepton Search Selection > 120 GeV
µ
mµ
Leading and Subleading Muon η 3
− −2 −1 0 1 2 3
Data / Bkg
0.6 0.8 1 1.2 1.4
Figure 5: Reconstructed leptonη distribution after selection for the (left column) dielectron and (right column) dimuon channels. “Leading” denotes the electron (muon) with the highest ET (pT) of the selected pair, while
“Subleading” denotes the second highestET(pT) electron (muon). The distributions are shown for dilepton invariant masses greater than 120 GeV. Data and the SM background estimates as well as their ratio are displayed, along with three selected resonant signals overlaid,Z0χwith a pole mass of 2, 3, and 4 TeV. The shaded band in the lower panel illustrates the total systematic uncertainty, as explained in Section6. The data points are shown together with their statistical uncertainty.
-3 -2 -1 0 1 2 3
Events
2000 4000 6000 8000 10000 12000
14000 Data
* γ Z/
Top Quarks Diboson Multi-Jet & W+Jets
(2 TeV) Z’χ
(3 TeV) Z’χ
(4 TeV) Z’χ
Preliminary ATLAS
= 13 TeV, 13.3 fb-1
s
Dilepton Search Selection > 120 GeV mee
φ Leading and Subleading Electron
-3 -2 -1 0 1 2 3
Data / Bkg
0.6 0.8 1 1.2 1.4
Events
0 2000 4000 6000 8000 10000 12000 14000 16000
Data γ* Z/
Top Quarks Diboson
(2 TeV) Z’χ
(3 TeV) Z’χ
(4 TeV) Z’χ
Preliminary ATLAS
= 13 TeV, 13.3 fb-1
s
Dilepton Search Selection > 120 GeV
µ
mµ
φ Leading and Subleading Muon 3
− −2 −1 0 1 2 3
Data / Bkg
0.6 0.8 1 1.2 1.4
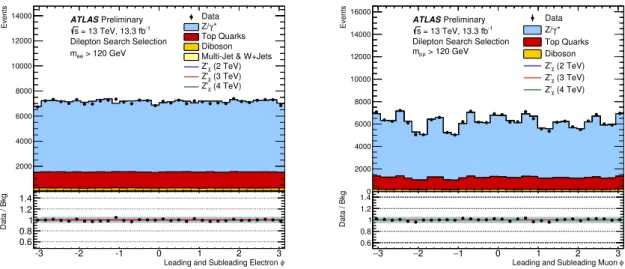
Figure 6: Reconstructed lepton φdistribution after selection for the (left column) dielectron and (right column) dimuon channels. “Leading” denotes the electron (muon) with the highest ET (pT) of the selected pair, while
“Subleading” denotes the second highestET(pT) electron (muon). The distributions are shown for dilepton invariant masses greater than 120 GeV. Data and the SM background estimates as well as their ratio are displayed, along with three selected resonant signals overlaid,Z0χwith a pole mass of 2, 3, and 4 TeV. The shaded band in the lower panel illustrates the total systematic uncertainty, as explained in Section6. The data points are shown together with their statistical uncertainty.
[TeV]
Z’χ
0.5 1 1.5 2 2.5 3 3.5 4 M4.5 5
Acceptance x Efficiency
0.2 0.3 0.4 0.5 0.6 0.7 0.8 0.9 1
Simulation ATLAS
= 13 TeV s
Dilepton Search Selection ee
Z’ → µ µ Z’ →
Figure 7: Product of acceptance and efficiency for the dielectron (upper curve) and dimuon (lower curve) selections as a function of theZ0χpole mass.
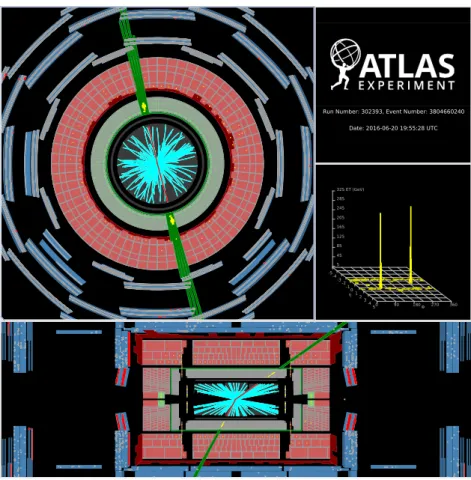
Figure 8: Event display for the selected event with the highest dielectron invariant mass. Green towers represent energy deposition in the cells of the electromagnetic calorimeter for the two selected electron candidates. Red lines represent the reconstructed tracks associated to the two selected electron candidates. Cyan lines correspond to other energetic tracks in the event, including some tracks from pile-up. Candidate leptons withET>30 GeV are displayed. The highest momentum electron has anETof 889 GeV and anηof -0.51. The subleading electron has anETof 868 GeV and anηof 1.14. The invariant mass of the pair is 2.38 TeV.