A TLAS-CONF-2017-027 12/04/2017
ATLAS CONF Note
ATLAS-CONF-2017-027
Search for new high-mass phenomena in the
dilepton final state using 36.1 fb −1 of proton–proton collision data at √
s = 13 TeV with the ATLAS detector
The ATLAS Collaboration
9th April 2017
A search is conducted for new resonant and non-resonant high-mass phenomena in dielectron and dimuon final states. The search uses 36.1 fb
−1of proton–proton collision data, collected at √
s = 13 TeV by the ATLAS experiment at the LHC in 2015 and 2016. The dilepton invari- ant mass is used as the discriminating variable. No significant deviation from the Standard Model prediction is observed. Upper limits at 95% credibility level are set on the cross- section times branching ratio for resonances decaying to dileptons, which are converted into lower limits on the resonance mass, up to 4.1 TeV for the E6-motivated Z
0χ. Lower limits on the ``qq contact interaction scale are set between 23.5 TeV and 40.1 TeV, depending on the model.
UPDATE: Figure 8 has been added to the appendix.
c
2017 CERN for the benefit of the ATLAS Collaboration.
Reproduction of this article or parts of it is allowed as specified in the CC-BY-4.0 license.
1 Introduction
This article presents a search for resonant and non-resonant new phenomena, based on the analysis of dilepton final states (ee and µµ) in proton–proton (pp) collisions with the ATLAS detector at the Large Hadron Collider (LHC) operating at √
s = 13 TeV, corresponding to an integrated luminosity of 36.1 fb
−1, collected during 2015 and 2016. In the search for New Physics carried out at hadron colliders, the study of dilepton final-states provides excellent sensitivity to a large variety of phenomena. This experimental signature benefits from a fully reconstructed final state, high signal selection e ffi ciencies and relatively small, well-understood backgrounds, representing a powerful test for a wide range of theories beyond the Standard Model (SM).
Models with extended gauge groups often feature additional U (1) symmetries with corresponding heavy spin-1 bosons, generally referred to as Z
0, the decay of which would manifest itself as a narrow resonance in the dilepton mass spectrum. Among these models are those inspired by Grand Unified Theories (GUT), which are motivated by gauge unification or a restoration of the left-right symmetry violated by the weak interaction. Examples considered in this article include the Z
0bosons of the E
6-motivated [1, 2] theories as well as Minimal models [3]. The Sequential Standard Model (SSM) [2] manifests a Z
SSM0boson with couplings to fermions equivalent to those of the SM Z
0boson. This model is considered due to its inherent simplicity and usefulness as a benchmark model.
The most sensitive previous searches for a Z
0decaying to the dilepton final state were carried out by the ATLAS and CMS collaborations [4, 5]. Using 3.2 fb
−1of pp collision data at √
s = 13 TeV collected in 2015, ATLAS set a lower limit at 95% credibility level (CL) on the Z
SSM0pole mass of 3.4 TeV for the combined ee and µµ channels. Similar limits were set by CMS using the 2015 dataset.
This search is also sensitive to a series of other models that predict the presence of narrow dilepton resonances; however, constraints on these models are not explicitly evaluated in this article. These models include the Randall–Sundrum (RS) model [6] with a warped extra dimension giving rise to spin-2 graviton excitations, the quantum black hole model [7], the Z
∗model [8], and the minimal walking technicolour model [9]. In order to facilitate interpretation of the results in the context of these or any other model predicting a new dilepton resonance limits are set on the production of a generic Z
0-like excess.
In addition to the result from a direct search, results from a search for non-resonant phenomena is also reported: the presence of a new interaction can, in fact, be detected at an energy much lower than that required to produce direct evidence of the existence of a new gauge boson. The charged weak interaction responsible for nuclear β decay provides such an example. A non-renormalisable description of this pro- cess was successfully formulated by Fermi in the form of a four-fermion contact interaction (CI) [10].
The most stringent constraints on CI searches are also provided by the ATLAS and CMS collaborations [4, 11]. Using 3.2 fb
−1of pp collision data at √
s = 13 TeV collected in 2015, ATLAS set lower limits on the
``qq CI scale of Λ > 25.2 TeV and Λ > 17.8 TeV at 95% CL for constructive and destructive interference, respectively, in the case of left-left interactions and assuming a uniform positive prior in 1/ Λ
2. Similar limits were set by CMS using the 2015 dataset. Both resonant and non-resonant models considered as the benchmark for this search are further discussed in Sec. 2.
The presented search utilises the invariant mass spectra of the observed dilepton final states as discrim-
inating variables. The analysis and interpretation of these spectra rely primarily on simulated samples of
signal and background processes. The interpretation is performed taking into account the expected shape
of different signals in the dilepton mass distribution. The use of the full dilepton invariant mass shape of
the distribution increases the sensitivity of this analysis against uncertainties in the background modelling at high masses.
2 Theoretical models
2.1 E 6 -motivated Z 0 models
In the class of models based on the E
6gauge group, the unified symmetry group can break to the SM in a number of di ff erent ways [1]. In many of them, E
6is first broken to SO (10) × U (1)
ψ, with SO (10) then breaking either to SU (4) × SU (2)
L× SU (2)
Ror SU (5) × U (1)
χ. In the first of these two possibilities, a Z
3R0coming from SU(2)
Ror a Z
B−L0from the breaking of SU(4) into SU (3)
C× U(1)
B−Lcould exist at the TeV scale. Both of these Z
0bosons appear in the Minimal Z
0models discussed in the next section. In the SU (5) case, the presence of U(1)
ψand U (1)
χsymmetries implies the existence of associated gauge bosons Z
ψ0and Z
0χthat can mix. When SU (5) is broken down to the SM, one of the U (1) can remain unbroken down to intermediate energy scales [1, 2]. Therefore, the precise model is governed by a mixing angle θ
E6, with the new potentially observable Z
0boson defined by Z
0(θ
E6) = Z
ψ0cos θ
E6+ Z
0χsin θ
E6. The value of θ
E6specifies the Z
0boson’s coupling strength to SM fermions as well as its intrinsic width.
In comparison to the benchmark Z
SSM0, which has a width of approximately 3% of its mass, the E
6models predict narrower Z
0signals. The Z
ψ0considered here has a width of 0.5% of its mass, and the Z
χ0has a width of 1.2% of its mass [12, 13]. All other Z
0signals in this model are defined by specific values of θ
E6ranging from 0 to π, and have widths between those of the Z
ψ0and Z
χ0.
2.2 Minimal Z 0 models
In the Minimal Z
0models [3], the phenomenology of Z
0boson production and decay is characterized by three parameters: two e ff ective coupling constants, g
BLand g
Y, and the Z
0boson mass. This para- meterisation encompasses Z
0bosons from many models, including the Z
0χbelonging to the E
6-motivated model of the previous section, the Z
3R0in a left-right symmetric model [14, 15] and the Z
B−L0of the pure (B − L) model [16], where B (L) is the baryon (lepton) number and (B − L) is the conserved quantum number. The coupling parameter g
BLdefines the coupling of a new Z
0boson to the (B − L) current, while the g
Yparameter represents the coupling to the weak hypercharge Y. It is convenient to refer to the ratios ˜ g
BL≡ g
BL/g
Zand ˜ g
Y≡ g
Y/g
Z, where g
Zis the coupling of the SM Z boson defined by g
Z= 2M
Z/v. Here v = 246 GeV is the SM Higgs vacuum expectation value. To simplify further, the additional parameters γ
0and θ
Minare chosen as independent parameters with the following definitions:
˜
g
BL= γ
0cos θ
Min, ˜ g
Y= γ
0sin θ
Min. The γ
0parameter measures the strength of the Z
0boson coupling re- lative to that of the SM Z boson, while θ
Mindetermines the mixing between the generators of the (B − L) and the weak hypercharge Y gauge groups. Specific values of γ
0and θ
Mincorrespond to Z
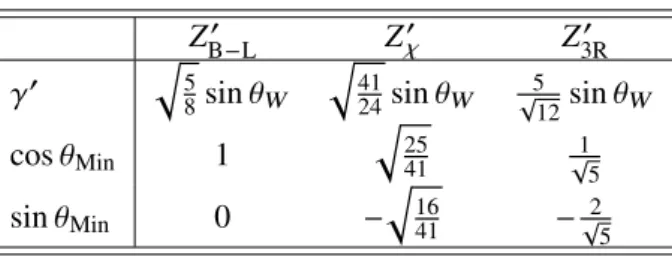
0bosons in various models, as is shown in Table 1 for the three cases mentioned in this section.
For the Minimal Z
0models, the width depends on γ
0and θ
Min, and the Z
0interferes with the SM Z/γ
∗process. For example, taking the 3R and B − L models investigated in this search, the width varies from
< 1% up to 12.8% and 39.5% respectively, for the γ
0range considered. The branching fraction to leptons
is the same as for the other Z
0models considered in this search. Couplings to hypothetical right-handed
neutrinos, the Higgs boson, and to W boson pairs are not included. Previous limits on the Z
0mass versus
couplings in the context of these models were set by the ATLAS experiment; the specific mass limit varies
Table 1: Values for γ
0and θ
Minin the Minimal Z
0models corresponding to three specific Z
0bosons: Z
B−L0, Z
0χand Z
3R0. The SM weak mixing angle is denoted by θ
W.
Z
B−L0Z
χ0Z
3R0γ
0q
5 8
sin θ
Wq
4124
sin θ
W √512
sin θ
Wcos θ
Min1
q
25 41√1 5
sin θ
Min0 −
q
1641
−
√25
with γ
0. For γ
0= 0.2, the range of Z
0mass limits at 95% CL corresponding to θ
Min∈ [0, π] is 1.11 TeV to 2.10 TeV [17].
2.3 Contact interaction
Some models of physics beyond the SM result in non-resonant deviations from the predicted SM dilepton mass spectrum. Compositeness models motivated by the repeated pattern of quark and lepton generations predict new interactions involving their constituents. These interactions may be represented as a contact interaction between initial-state quarks and final-state leptons [18, 19]. Other models producing non- resonant e ff ects are models with large extra dimensions [20] motivated by the hierarchy problem. This search is sensitive to these non-resonant new physics scenarios; however, constraints on these models are not evaluated in this paper.
The following four-fermion CI Lagrangian [18, 19] is used to describe a new interaction or compositeness in the process qq → `
+`
−:
L = g
2Λ
2[η
LL(q
Lγ
µq
L) (`
Lγ
µ`
L) + η
RR(q
Rγ
µq
R) (`
Rγ
µ`
R) (1) + η
LR(q
Lγ
µq
L) (`
Rγ
µ`
R) + η
RL(q
Rγ
µq
R) (`
Lγ
µ`
L)] ,
where g is a coupling constant set to be √
4π by convention, Λ is the CI scale, and q
L,Rand `
L,Rare
left-handed and right-handed quark and lepton fields, respectively. The symbol γ
µdenotes the gamma
matrices, and the parameters η
i j, where i and j are L or R (left or right), define the chiral structure of
the new interaction. Di ff erent chiral structures are investigated here, with the left-right (right-left) model
obtained by setting η
LR= ±1 (η
RL= ±1) and all other parameters to zero. Likewise, the left-left and
right-right models are obtained by setting the corresponding parameters to ±1, and the others to zero. The
sign of η
i jdetermines whether the interference between the SM Drell–Yan (DY) qq → Z/γ
∗→ `
+`
−process and the CI process is constructive (η
i j= −1) or destructive (η
i j= +1).
3 ATLAS detector
The ATLAS experiment [21, 22] at the LHC is a multi-purpose particle detector with a forward-backward symmetric cylindrical geometry and a near 4π coverage in solid angle 1 . It consists of an inner tracking detector surrounded by a thin superconducting solenoid providing a 2 T axial magnetic field, electromag- netic and hadronic calorimeters, and a muon spectrometer. The inner tracking detector (ID) covers the pseudorapidity range |η| < 2.5. It consists of silicon pixel, silicon microstrip, and transition-radiation tracking detectors. Lead / liquid-argon (LAr) sampling calorimeters provide electromagnetic (EM) energy measurements with high granularity. A hadronic (steel/scintillator-tile) calorimeter covers the central pseudorapidity range (|η | < 1.7). The endcap and forward regions are instrumented with LAr calorimet- ers for EM and hadronic energy measurements up to |η | = 4.9. The total thickness of the EM calorimeter is more than twenty radiation lengths. The muon spectrometer (MS) surrounds the calorimeters and is based on three large superconducting air-core toroids with eight coils each. The field integral of the tor- oids ranges between 2.0 and 6.0 T m for most of the detector. The MS includes a system of precision tracking chambers and fast detectors for triggering. A dedicated trigger system is used to select events.
The first-level trigger is implemented in hardware and uses the calorimeter and muon detectors to reduce the accepted rate to below 100 kHz. This is followed by a software-based trigger that reduces the accepted event rate to 1 kHz on average [23].
4 Data and Monte Carlo samples
This analysis uses data collected at the LHC during 2015 and 2016 pp collisions at √
s = 13 TeV. The total integrated luminosity corresponds to 36.1 fb
−1, after excluding the periods of data-taking without all sub-detectors functioning nominally. The event quality is also checked to remove events which contain noise bursts or coherent noise in the calorimeters.
Modelling of the various background sources primarily relies on Monte Carlo (MC) simulation. The dom- inant background contribution arises from the DY process, which is simulated using the next-to-leading- order (NLO) P owheg [24] event generator, implementing the CT10 [25] Parton Distribution Function (PDF), in conjunction with Pythia 8.186 [26] for event showering, and the ATLAS AZNLO tune [27].
More details for the description of this process are provided in Ref. [28]. The DY event yields are cor- rected with a mass-dependent rescaling from NLO to next-to-next-to-leading order (NNLO) in the QCD coupling constant, computed with VRAP 0.9 [29] and the CT14NNLO PDF set [30]. The NNLO QCD corrections are a factor of ∼ 0.98 at m
``= 3 TeV. Mass-dependent electroweak (EW) corrections are computed at NLO with M csanc 1.20 [31]. The NLO EW corrections are a factor of ∼ 0.86 at m
``= 3 TeV. Those include photon-induced contributions (γγ → `` via t- and u-channel processes) computed with the MRST2004QED PDF set [32]. The corrected DY background has been smoothed to remove stat- istical fluctuations due to limited MC statistics compared to the large integrated luminosity of the data, by fitting the spectrum in the range 120 GeV < m
``< 1 TeV, and using the resulting fitted function to set the expected event yields in that mass region. The chosen fit function consists of a relativistic Breit-Wigner
1
ATLAS uses a right-handed coordinate system with its origin at the nominal interaction point (IP) in the centre of the detector and the z-axis along the beam pipe. The x-axis points from the IP to the centre of the LHC ring, and the y-axis points upwards. Cylindrical coordinates (r, φ) are used in the transverse plane, φ being the azimuthal angle around the z-axis.
The pseudorapidity is defined in terms of the polar angle θ as η = − ln tan(θ/2). Angular distance is measured in units of
∆R ≡ p
(∆ η)
2+ (∆ φ)
2.
function with mean and width fixed to m
Zand Γ
Zmultiplied with a analytic function taking into account detector resolution, selection efficiency, parton distribution effects, and contributions from the photon in- duced process and virtual photons. At higher dilepton invariant masses the statistical uncertainty of the MC is much smaller than the data through the use of mass-binned MC samples.
Other background sources originate from top-quark [33] and diboson (W W, W Z, Z Z) [34] production.
The diboson processes are simulated using S herpa 2.2.1 [35] with the CT10 PDF. The t t ¯ and single-top- quark MC samples are simulated using the Powheg generator with the CT10 PDF, and are normalised to a cross-section as calculated with the Top++ 2.0 program [36], which is accurate to NNLO in perturb- ative QCD, including resummation of next-to-next-to-leading logarithmic soft gluon terms. Background processes involving bosons decaying into tau lepton(s) were found to have a negligible contribution, and are not included. In the case of the dielectron channel, multi-jet and W +jets processes (which contribute due to the misidentification of jets as electrons) are estimated using a data-driven method, described in Sec. 6.
Signal processes are produced at LO using P ythia 8.186 with the NNPDF23LO PDF set [37] and A14 tune [38] for event generation, parton showering and hadronisation. Interference e ff ects (such as with DY production) are not included for the SSM and E
6model Z
0signal, but are included for the CI signal and Minimal model approach. Higher-order QCD corrections are computed and applied as for the DY background. EW corrections are not applied to the Z
0signal samples due to the large model depend- ence. However, the EW corrections are applied to the CI signal samples, because interference effects are included.
The detector response is simulated with G eant 4 [39], and the events are processed with the same recon- struction software [40] as used for the data. Furthermore, the distribution of the number of additional simulated pp collisions in the same or neighbouring beam crossings (pile-up) is accounted for by over- laying simulated minimum-bias events and re-weighting the MC to match the distribution observed in the data.
5 Event selection
Dilepton candidates are selected in the data and simulated events with at least one pair of reconstructed same-flavour lepton candidates (electrons or muons) and at least one reconstructed primary vertex, defined as the vertex with the highest sum of track transverse momenta (p
T) squared.
Electron candidates are identified in the central region of the ATLAS detector (|η | < 2.47) by combining
calorimetric and tracking information in a likelihood discriminant with four operating points: Very Loose,
Loose, Medium and Tight each with progressively higher threshold on the discriminant, and stronger
background rejection, as described in Ref. [41]. The transition region between the central and forward
regions of the calorimeters, in the range 1.37 ≤ | η | ≤ 1.52, exhibits poorer energy resolution and is
therefore excluded. Electron candidates are required to have transverse energy (E
T) greater than 30 GeV,
and a track consistent with the primary vertex both along the beamline and in the transverse plane. The
Medium working point of the likelihood discrimination is used to select electron candidates while the Very
Loose and Loose working points are used in the data-driven background estimation described in Sec. 6. In
addition to the likelihood discriminant, selection criteria based on track quality are applied. The selection
e ffi ciency is approximately 96% for electrons with E
Tbetween 30 GeV and 500 GeV, and decreases to
approximately 95% for electrons with E
T= 1.5 TeV. The selection efficiency is evaluated in the data
using a tag-and-probe method [42] up to E
Tof 500 GeV and the uncertainties due to the modelling of the shower shape variables are evaluated for electrons with higher E
Tusing MC, as described in Section 7.
The electron energy scale and resolution have been calibrated up to E
Tof 1 TeV using data collected at
√ s = 8 TeV and √
s = 13 TeV [43]. The energy resolution extrapolated for high-E
Telectrons (greater than 1 TeV) is approximately 1%.
Muon-candidate tracks are, at first, reconstructed independently in the ID and the MS [44]. The two tracks are then used as input to a combined fit (for p
Tless than 300 GeV) or to a statistical combination (for p
Tgreater than 300 GeV). The combined fit takes into account the energy loss in the calorimeter and multiple-scattering e ff ects. The statistical combination for high transverse momenta is performed to mitigate the effects of relative ID and MS misalignments. The ID track used for the combined fit is required to be within the ID acceptance, |η | < 2.5, and to have a minimum number of hits in each ID sub-system. Muons are required to have p
Tgreater than 30 GeV, and to be consistent with the primary vertex both along the beamline and on the transverse plane.
In order to optimise momentum resolution, muon tracks are required to have at least three hits in each of three precision chambers in the MS and not to traverse regions of the MS which are poorly aligned. This requirement reduces the muon reconstruction efficiency by about 20% for muons with a p
Tgreater than 1.5 TeV. Furthermore, muon candidates in the overlap of the MS barrel and endcap region (1.01 < |η | <
1.10) are rejected due to the potential relative misalignment between barrel and endcap. Measurements of the ratio between charge and momentum (q/p) performed independently in the ID and MS must agree within seven standard deviations, calculated from the sum in quadrature of the ID and MS momentum uncertainties. Finally, in order to reject events that contain a muon with poor track resolution in the MS, due to a low magnetic field integral and other effects, an event veto based on the MS track momentum measurement uncertainty is also applied.
To further suppress background from misidentified jets as well as from light-flavour and heavy-flavour hadron decays inside jets, lepton candidates are required to satisfy calorimeter-based (only for electrons) and track-based (for both electrons and muons) isolation criteria. The calorimeter-based isolation relies on the ratio of the E
Tdeposited in a cone of size ∆R = 0.2, centred at the electron cluster barycentre, to the total E
Tmeasured for the electron. Likewise, the track-based isolation relies on the ratio of the scalar sum p
Tof tracks within a cone of size ∆R = 10 GeV/p
Tto the p
Tof the track associated to the candidate lepton. The tracks are required to have p
T> 1 GeV, |η| < 2.5, meet all track quality criteria, and originate from the primary vertex. Isolation criteria each with a fixed efficiency of 99% over the full range of lepton momenta are applied in both channels.
Calibration corrections are applied to electron (muon) candidates to reconcile energy (momentum) scale and resolution between data and simulation [44, 45].
In the dielectron channel, a two-electron trigger based on the Loose identification criteria with an E
Tthreshold of 17 GeV for each electron is used. Events in the dimuon channel are required to pass at least one of two single-muon triggers with p
Tthresholds of 26 GeV and 50 GeV, with the former also requiring the muon to be isolated. These triggers select events from a simulated sample of Z
χ0with a pole mass of 3 TeV with an efficiency of about 86% and 91% for the dielectron and dimuon channels, respectively.
Data-derived corrections are applied in the simulated samples to match the trigger, reconstruction and isolation e ffi ciencies.
For each event with at least two same-flavour leptons, the dilepton candidate is built. If more than two
electrons (muons) are found, the ones with highest E
T(p
T) are chosen. In the muon channel only opposite-
charge candidates are retained. This requirement is not applied in the electron channel due to a higher chance of charge misidentification for high-E
Telectrons.
Representative values of the total acceptance times e ffi ciency for a Z
0χboson with a pole mass of 3 TeV are 71% in the dielectron channel and 40% in the dimuon channel.
6 Background estimation
The backgrounds from processes including two real leptons in the final state (DY, t¯ t, single-top-quark, W W , W Z, and Z Z production) are modelled using the MC samples described in Sec. 4.
An additional background arises from W +jets and multi-jet events, from which at most one real lepton is produced. This background contributes to the selected samples due to having one or more jets satisfying the lepton selection criteria (so called “fakes”). In the dimuon channel, contributions from W + jets and multi-jet production are found to be negligible, and therefore are not included in the expected yield. In the dielectron channel the contributions from these processes are determined with a data-driven technique, the matrix method. It is based on the di ff erent probabilities of a jet and an electron to be identified as an electron, when nominal or loosened selectrion criteria are applied. The loosened selection differs from the nominal one by the use of the Loose identification criteria and no isolation criterion. A probability r that a real electron in the loosened selection satisfies the nominal electron selection criteria is estimated from MC simulated DY samples in several regions of E
Tand |η | . The probability f that a jet in the loosened selection satisfies the nominal electron selection criteria is determined in regions of E
Tand |η | in data samples triggered on the presence of a Very Loose or a Loose electron candidate. Contributions to these samples from the production of W and Z bosons are suppressed by vetoing events with large missing transverse energy (E
Tmiss> 25 GeV) or with two electron candidates compatible with Z boson mass, or two candidates passing the Medium identification criteria. Residual contributions from processes with real electrons in the calculation of f are accounted for by using the MC simulated samples.
The selected events are grouped according to the identification criteria matched by the electrons. A system of equations between numbers of paired objects (N
ab, with E
Ta> E
Tb) is used to solve for the unknown contribution to the background from events with one or more fake electrons:
N
T TN
T LN
LTN
L L
=
r
2r f f r f
2r (1 − r ) r (1 − f ) f (1 − r ) f (1 − f ) (1 − r )r (1 − r ) f (1 − f )r (1 − f ) f (1 − r )
2(1 − r )(1 − f ) (1 − f )(1 − r ) (1 − f )
2
N
R RN
R FN
F RN
F F
(2)
The subscripts R and F refer to real electrons and fakes (jets), respectively. The subscript T refers to electrons that pass the nominal selection criteria. The subscript L corresponds to electrons that pass the loosened requirements described above but fail the nominal requirements.
The background is given as the part of N
T T, the number of pairs passing the signal selection, originating from a pair of objects with at least one fake:
N
Multi−jet & W+jetsT T
= r f (N
R F+ N
F R) + f
2N
F F(3)
The true paired objects on the right-hand side of Eq. 3 can be expressed in terms of measureable quantities
(N
T T, N
T L, N
LT, N
L L) by inverting the matrix in Eq. 2.
The estimate is extrapolated by fitting an analytic function to the m
eedistribution above about 125 GeV to mitigate effects of limited event counts in the high-mass region and of method instabilities due to a very small contribution from fakes in the Z peak region. The fit is repeated by increasing progress- ively the starting point of the fit by about 10 GeV per step until about 195 GeV. The weighted mean of all fits is taken as central value and the envelope as uncertainty. Additional uncertainties in this back- ground estimate are evaluated by considering di ff erences in the estimates for events with same-charge and opposite-charge electrons as well as by varying the electron identification probabilities. The uncer- tainty on this background can, due to the extrapolation, become very large at high mass, which has only a negligible impact on the final results of this analysis.
7 Systematic uncertainties
Systematic uncertainties estimated to have a non-negligible impact on the expected cross-section limit are considered as nuisance parameters in the statistical interpretation and include both the theoretical and experimental effects on the total background and experimental effects on the signal.
Theoretical uncertainties in the background prediction are dominated by the DY background, throughout the entire dilepton invariant mass range. They arise from the eigenvector variations of the nominal PDF set, as well as variations of PDF scale, α
S, EW corrections, and photon-induced (PI) corrections. The e ff ects of di ff erent PDF set choices are also considered. The theoretical uncertainties are the same for both channels at generator level, but they result in different uncertainties at reconstruction level due to the di ff ering resolutions between the dielectron and dimuon channels.
The PDF variation uncertainty is obtained using the 90% CL CT14NNLO PDF error set and by fol- lowing the procedure described in Refs. [17, 46, 47]. Rather than using a single nuisance parameter to describe the 28 eigenvectors of this PDF error set, which could lead to an underestimation of its e ff ect, a re-diagonalised set of 7 PDF eigenvectors was used [30], which are treated as separate nuisance para- meters. This represents the minimal set of PDF eigenvectors that maintains the necessary correlations, and the sum in quadrature of these eigenvectors matches the original CT14NNLO error envelope well.
The uncertainties due to the variation of PDF scale and α
Sare derived using VRAP with the former ob- tained by varying the renormalisation and factorisation scales of the nominal CT14NNLO PDF up and down simultaneously by a factor of two. The value of α
Sused (0.118) is varied by ± 0.003. The EW correction uncertainty was assessed by comparing the nominal additive (1 + δ
EW+ δ
QCD) treatment with the multiplicative approximation ((1+ δ
EW)(1+ δ
QCD)) treatment of the EW correction in the combination of the higher-order EW and QCD e ff ects. The uncertainty in the photon-induced correction is calculated based on the uncertainty of the quark masses and the photon PDF. Following the recommendations of the PDF4LHC forum [47], an additional uncertainty is derived due to the choice of nominal PDF set, by comparing the central values of CT14NNLO with those from other PDF sets, namely MMHT14 [48] and NNPDF3.0 [49]. The maximum absolute deviation from the envelope of these comparisons is used as the PDF choice uncertainty, where it is larger than the CT14NNLO PDF eigenvector variation envelope.
Theoretical uncertainties are not applied to the signal prediction in the statistical interpretation.
Theoretical uncertainties in the top-quark and diboson backgrounds were also considered, both from the
independent variation of the factorisation and renormalisation scales, µ
Fand µ
R, and from the variations
in the PDF and α
S, following the PDF4LHC prescription. Normalisation uncertainties in the top quarks
and diboson background are shown in the “Top Quarks Theoretical” and “Dibosons Theoretical” entry in
Table 2.
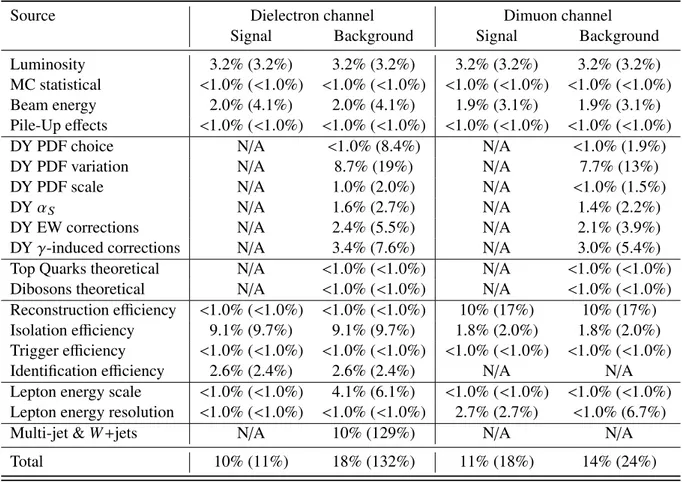
Table 2: Summary of the pre-marginalised relative systematic uncertainties in the expected number of events at dilepton masses of 2 TeV and 4 TeV. The values reported in parenthesis correspond to the 4 TeV mass. The values quoted for the background represent the relative change in the total expected number of events in the corresponding m
``histogram bin containing the reconstructed m
``mass of 2 TeV (4 TeV). For the signal uncertainties the values were computed using a Z
0χsignal model with a pole mass of 2 TeV (4 TeV) by comparing yields in the core of the mass peak (within the full width at half maximum) between the distribution varied under a given uncertainty and the nominal distribution. “N / A" represents cases where the uncertainty is not applicable.
Source Dielectron channel Dimuon channel
Signal Background Signal Background
Luminosity 3.2% (3.2%) 3.2% (3.2%) 3.2% (3.2%) 3.2% (3.2%)
MC statistical <1.0% (<1.0%) <1.0% (<1.0%) <1.0% (<1.0%) <1.0% (<1.0%)
Beam energy 2.0% (4.1%) 2.0% (4.1%) 1.9% (3.1%) 1.9% (3.1%)
Pile-Up e ff ects <1.0% (<1.0%) <1.0% (<1.0%) <1.0% (<1.0%) <1.0% (<1.0%)
DY PDF choice N / A <1.0% (8.4%) N / A <1.0% (1.9%)
DY PDF variation N/A 8.7% (19%) N/A 7.7% (13%)
DY PDF scale N/A 1.0% (2.0%) N/A <1.0% (1.5%)
DY α
SN / A 1.6% (2.7%) N / A 1.4% (2.2%)
DY EW corrections N/A 2.4% (5.5%) N/A 2.1% (3.9%)
DY γ-induced corrections N/A 3.4% (7.6%) N/A 3.0% (5.4%)
Top Quarks theoretical N/A <1.0% (<1.0%) N/A <1.0% (<1.0%) Dibosons theoretical N / A <1.0% (<1.0%) N / A <1.0% (<1.0%) Reconstruction e ffi ciency <1.0% (<1.0%) <1.0% (<1.0%) 10% (17%) 10% (17%) Isolation e ffi ciency 9.1% (9.7%) 9.1% (9.7%) 1.8% (2.0%) 1.8% (2.0%) Trigger efficiency <1.0% (<1.0%) <1.0% (<1.0%) <1.0% (<1.0%) <1.0% (<1.0%) Identification e ffi ciency 2.6% (2.4%) 2.6% (2.4%) N / A N / A Lepton energy scale <1.0% (<1.0%) 4.1% (6.1%) <1.0% (<1.0%) <1.0% (<1.0%) Lepton energy resolution <1.0% (<1.0%) <1.0% (<1.0%) 2.7% (2.7%) <1.0% (6.7%)
Multi-jet & W + jets N / A 10% (129%) N / A N / A
Total 10% (11%) 18% (132%) 11% (18%) 14% (24%)
The following sources of experimental uncertainty are accounted for: lepton e ffi ciencies due to triggering, identification, reconstruction, and isolation, lepton energy scale and resolution, pile-up effects, as well as the multi-jet and W + jets background estimate. E ffi ciencies are evaluated using events from the Z → ``
peak and then extrapolated to high energies. The uncertainty in the muon reconstruction e ffi ciency is the largest experimental uncertainty in the dimuon channel. It includes the uncertainty obtained from Z → µµ data studies and a high-p
Textrapolation uncertainty corresponding to the decrease in the muon reconstruction and selection e ffi ciency with increasing p
Tthat is predicted by the MC simulation. The effect on the muon reconstruction efficiency was found to be approximately 3% per TeV as a function of muon p
T. The uncertainty in the electron identification e ffi ciency extrapolation is based on the di ff erences in the electron shower shapes in the EM calorimeters between data and MC simulation in the Z → ee peak, which are propagated to the high-E
Telectron sample. The effect on the electron identification e ffi ciency was found to be 2.0% and is independent of E
Tfor electrons with E
Tabove 150 GeV. For the isolation e ffi ciencies, uncertainties were estimated for 150 < p
T< 500 GeV and above 500 GeV re- spectively using DY candidates in data. Mismodelling of the muon momentum resolution due to residual misalignments in the MS can alter the steeply falling background shape at high dilepton mass and can significantly modify the width of the signal line shape. This uncertainty is obtained by studying dedicated data-taking periods with no magnetic field in the MS [44]. For the dielectron channel, the uncertainty in- cludes a contribution from the multi-jet and W +jets data-driven estimate that is obtained by varying both the overall normalisation and the extrapolation methodology, which is explained in Sec. 6. The systematic uncertainty for pile-up effects is assessed by inducing a variation in the pileup reweighting of MC and is included to cover the uncertainty on the ratio between the predicted and measured inelastic cross-section in the fiducial volume defined by M
X> 13 GeV, where M
Xis the mass of the non-di ff ractive hadronic system [50]. The uncertainty on the combined 2015 and 2016 integrated luminosity is 3.2%. It is derived, following a methodology similar to that detailed in Ref. [51], from a calibration of the luminosity scale using x-y beam-separation scans performed in August 2015 and May 2016. Systematic uncertainties used in the statistical analysis of the results are summarised in Table 2 at dilepton mass values of 2 TeV and 4 TeV. The systematic uncertainties are constrained in the likelihood during the statistical interpretation through marginalisation, as described in Sec 9.
8 Event yields
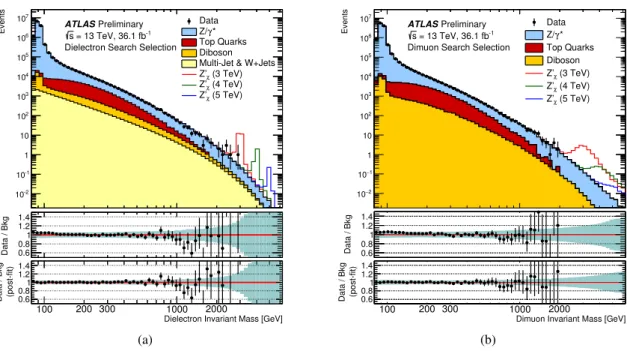
Expected and observed event yields, in bins of invariant mass, are shown in Table 3 for the dielectron channel, and in Table 4 for the dimuon channel. Expected event yields are split into the different back- ground sources and the yields for two signal scenarios are also provided. In general, the observed data are in good agreement with the SM prediction, taking into account the uncertainties as described in Sec. 7.
Distributions of m
``in the dielectron and dimuon channels are shown in Fig. 1. No clear excess is
apparently observed, but significances are quantified and discussed in Section 9. The highest invariant
mass event is found at 2.90 TeV, in the dielectron channel, and 1.99 TeV in the dimuon channel. Both of
these events have well-measured objects with little other detector activity.
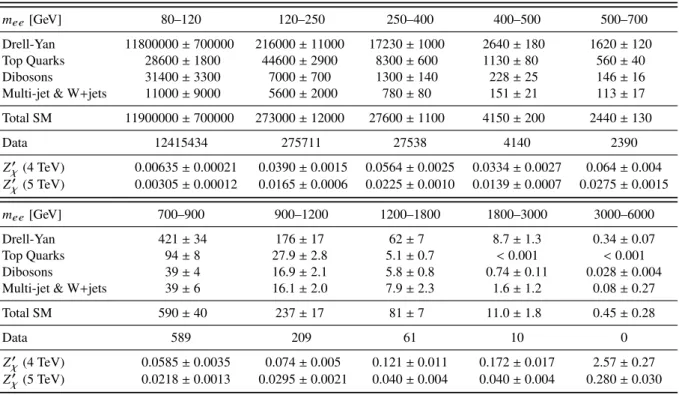
Table 3: Expected and observed event yields in the dielectron channel in di ff erent dilepton mass intervals. The quoted errors correspond to the combined statistical, theoretical, and experimental systematic uncertainties. Ex- pected event yields are reported for the Z
0χmodel, for two values of the pole mass. All numbers are shown pre- marginalisation.
m
ee[GeV] 80–120 120–250 250–400 400–500 500–700
Drell-Yan 11800000 ± 700000 216000 ± 11000 17230 ± 1000 2640 ± 180 1620 ± 120
Top Quarks 28600 ± 1800 44600 ± 2900 8300 ± 600 1130 ± 80 560 ± 40
Dibosons 31400 ± 3300 7000 ± 700 1300 ± 140 228 ± 25 146 ± 16
Multi-jet & W + jets 11000 ± 9000 5600 ± 2000 780 ± 80 151 ± 21 113 ± 17 Total SM 11900000 ± 700000 273000 ± 12000 27600 ± 1100 4150 ± 200 2440 ± 130
Data 12415434 275711 27538 4140 2390
Z
0χ(4 TeV) 0.00635 ± 0.00021 0.0390 ± 0.0015 0.0564 ± 0.0025 0.0334 ± 0.0027 0.064 ± 0.004 Z
0χ(5 TeV) 0.00305 ± 0.00012 0.0165 ± 0.0006 0.0225 ± 0.0010 0.0139 ± 0.0007 0.0275 ± 0.0015
m
ee[GeV] 700–900 900–1200 1200–1800 1800–3000 3000–6000
Drell-Yan 421 ± 34 176 ± 17 62 ± 7 8.7 ± 1.3 0.34 ± 0.07
Top Quarks 94 ± 8 27.9 ± 2.8 5.1 ± 0.7 < 0.001 < 0.001
Dibosons 39 ± 4 16.9 ± 2.1 5.8 ± 0.8 0.74 ± 0.11 0.028 ± 0.004
Multi-jet & W + jets 39 ± 6 16.1 ± 2.0 7.9 ± 2.3 1.6 ± 1.2 0.08 ± 0.27
Total SM 590 ± 40 237 ± 17 81 ± 7 11.0 ± 1.8 0.45 ± 0.28
Data 589 209 61 10 0
Z
0χ(4 TeV) 0.0585 ± 0.0035 0.074 ± 0.005 0.121 ± 0.011 0.172 ± 0.017 2.57 ± 0.27 Z
0χ(5 TeV) 0.0218 ± 0.0013 0.0295 ± 0.0021 0.040 ± 0.004 0.040 ± 0.004 0.280 ± 0.030
9 Statistical analysis
The m
``distributions are scrutinised for a resonant or non-resonant excess using two methods and are used to set limits on resonant and non-resonant new physics models, as well as on generic resonances. The signal search and limit setting rely on definition of a likelihood function, dependent on the parameter of interest, such as the signal cross-section, signal strength, coupling constant or the contact interaction scale.
The likelihood function also depends on nuisance parameters which describe the systematic variations. In this analysis a binned likelihood is used where the data is assumed to be Poisson-distributed in each bin of the m
``distribution. The logarithmic m
``histogram binning shown in Fig. 1 uses 66 mass bins and is chosen for setting limits on resonant signals. The chosen bin width for the m
``histogram in the search phase corresponds to the resolution in the dielectron (dimuon) channel, which varies from 10 (60) GeV at m
``= 1 TeV to 15 (200) GeV at m
``= 2 TeV, and 20 (420) GeV at m
``= 3 TeV. For setting limits on the contact interaction scale, the m
``mass distribution is binned into eight mass bins above 400 GeV with bin widths varying from 100 to 1500 GeV. The m
``region from 80 to 120 GeV is included in the likelihood as a single bin in the limit-setting on resonant signals to aid constraining of mass-independent components of systematic uncertainties, however that region is not searched for a new physics signal.
The parameter µ is defined as a ratio of the signal production cross-section times branching ratio to the
dilepton final state (σB) to its theoretically predicted value. Upper limits on the σB for specific Z
0boson models and generic Z
0bosons, γ
0of the Minimal Z
0boson, and lower limit on CI scale Λ are
set in a Bayesian approach. The above calculations are performed with the Bayesian Analysis Toolkit
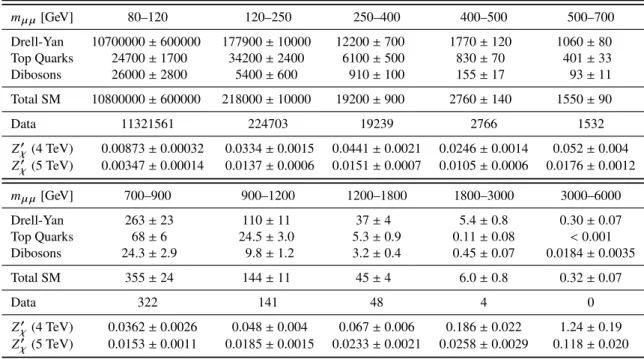
Table 4: Expected and observed event yields in the dimuon channel in di ff erent dilepton mass intervals. The quoted errors correspond to the combined statistical, theoretical, and experimental systematic uncertainties. Expected event yields are reported for the Z
0χmodel, for two values of the pole mass. All numbers are shown pre-marginalisation.
m
µ µ[GeV] 80–120 120–250 250–400 400–500 500–700
Drell-Yan 10700000 ± 600000 177900 ± 10000 12200 ± 700 1770 ± 120 1060 ± 80 Top Quarks 24700 ± 1700 34200 ± 2400 6100 ± 500 830 ± 70 401 ± 33
Dibosons 26000 ± 2800 5400 ± 600 910 ± 100 155 ± 17 93 ± 11
Total SM 10800000 ± 600000 218000 ± 10000 19200 ± 900 2760 ± 140 1550 ± 90
Data 11321561 224703 19239 2766 1532
Z
0χ(4 TeV) 0.00873 ± 0.00032 0.0334 ± 0.0015 0.0441 ± 0.0021 0.0246 ± 0.0014 0.052 ± 0.004 Z
0χ(5 TeV) 0.00347 ± 0.00014 0.0137 ± 0.0006 0.0151 ± 0.0007 0.0105 ± 0.0006 0.0176 ± 0.0012
m
µ µ[GeV] 700–900 900–1200 1200–1800 1800–3000 3000–6000
Drell-Yan 263 ± 23 110 ± 11 37 ± 4 5.4 ± 0.8 0.30 ± 0.07
Top Quarks 68 ± 6 24.5 ± 3.0 5.3 ± 0.9 0.11 ± 0.08 < 0.001
Dibosons 24.3 ± 2.9 9.8 ± 1.2 3.2 ± 0.4 0.45 ± 0.07 0.0184 ± 0.0035
Total SM 355 ± 24 144 ± 11 45 ± 4 6.0 ± 0.8 0.32 ± 0.07
Data 322 141 48 4 0
Z
0χ(4 TeV) 0.0362 ± 0.0026 0.048 ± 0.004 0.067 ± 0.006 0.186 ± 0.022 1.24 ± 0.19 Z
0χ(5 TeV) 0.0153 ± 0.0011 0.0185 ± 0.0015 0.0233 ± 0.0021 0.0258 ± 0.0029 0.118 ± 0.020
(BAT) [52], which uses a Markov Chain MC (MCMC) technique to marginalize the posterior probability.
Limit values obtained using the experimental data are quoted as observed limits, while median values of the limits obtained from a large number of simulated experiments, where only SM background is present, are quoted as the expected limits. The upper limits on the σ B are interpreted as lower limits on the Z
0pole mass using the relationship between the pole mass and the theoretical Z
0cross-section.
In the context of the Minimal Z
0model and CI, limits are set on the parameter of interest. In the case of the Minimal Z
0model the parameter of interest is γ
04. For CI the parameter of interest is set to either 1/Λ
2or to 1/Λ
4as this corresponds to the scaling of the CI-SM interference contribution or the pure CI contribution respectively. In both Minimal Z
0and CI cases, the nominal Poisson expectation of each m
``bin is expressed as a function of the parameter of interest. As in the context of the Z
0limit setting or the log-likelihood ratio (LLR) search, the Poisson mean is modified by shifts due to systematic uncertainties, however in both the Minimal Z
0and the CI cases, these shifts are also non-linear functions of the parameter of interest. A prior uniform in the parameter of interest is used for all limits.
Two complementary approaches are used in the search for a new physics signal. The first approach, which
does not rely on a specific signal model and therefore is sensitive to a wide range of new physics, uses the
B ump H unter (BH) [53] utility. In this approach all consecutive intervals in the m
``histogram spanning
from two bins to half of the bins in the histogram are searched for an excess. In each such interval a
Poisson probability (p-value) for an event count greater or equal to the observation found in data, given
the SM prediction is computed. The modes of marginalised posteriors of the nuisance parameters from
the MCMC are used to construct the SM prediction. The negative logarithm of the smallest p-value is
the BH statistic. The BH statistic is then interpreted as a global p-value utilising simulated experiments
where, in each simulated experiment, simulated data is generated from SM background model. Both
dielectron and dimuon channels are tested separately in this manner.
90
100200 1000 2000
Events
10-2
10-1
1 10 102
103
104
105
106
107 Data
* Z/γ Top Quarks Diboson Multi-Jet & W+Jets
(3 TeV) Z’χ
(4 TeV) Z’χ
(5 TeV) Z’χ
Preliminary ATLAS
= 13 TeV, 36.1 fb-1
s
Dielectron Search Selection
Data / Bkg 0.60.8 1 1.2 1.4
Dielectron Invariant Mass [GeV]
100 200 300 1000 2000
(post-fit)Data / Bkg 0.6 0.81 1.2 1.4
(a)
Events
2
10− 1
10−
1 10 102
103
104
105
106
107 Data
* Z/γ Top Quarks Diboson
(3 TeV) Z’χ
(4 TeV) Z’χ
(5 TeV) Z’χ
Preliminary ATLAS
= 13 TeV, 36.1 fb-1
s
Dimuon Search Selection
Data / Bkg 0.6
0.8 1 1.2 1.4
Dimuon Invariant Mass [GeV]
100 200 300 1000 2000
(post-fit)Data / Bkg 0.6 0.81 1.2 1.4
(b)
Figure 1: Distributions of (a) dielectron and (b) dimuon reconstructed invariant mass (m
``) after selection, for data and the SM background estimates as well as their ratio before and after marginalisation. Selected Z
χ0signals with a pole mass of 3, 4 and 5 TeV are overlaid. The bin width of the distributions is constant in log(m
``) and the shaded band in the lower panels illustrates the total systematic uncertainty, as explained in Sec. 7. The data points are shown together with their statistical uncertainty.
A search for Z
0χsignals as well as generic Z
0signals with widths from 1% to 12% is performed utilising the LLR test described in Ref. [54]. This second approach is specifically sensitive to narrow Z
0-like signals, and is thus complimentary to the more general BH approach. To perform the LLR search, the Histfactory [55] package, together with RooStats [56] and RooFit [57] packages are used. The p-value for finding a Z
0χsignal excess (at a given pole mass), as well as variable width generic Z
0excess (at a given central mass and with a given width), more significant than the observed, is computed analytically, using the test statistic q
0. The test statistic q
0is based on the logarithm of the profile likelihood ratio λ( µ).
The test statistic is modified for signal masses below 1.5 TeV to also quantify the significance of potential deficits in the data. As in the BH search the SM background model is constructed using the modes of marginalised posteriors of the nuisance parameters from the MCMC, and these nuisance parameters are not included in the likelihood at this stage. Starting with m
Z0of 150 GeV, multiple mass hypotheses are tested in pole mass steps corresponding to the histogram bin width to compute the local p-values — that is p-values corresponding to specific signal mass hypotheses. Simulated experiments (for m
Z0> 1.5 TeV) and asymptotic relations (for m
Z0< 1.5 TeV) in Ref. [54] are used to estimate the global p-value, which is the probability to find anywhere in the m
``distribution a Z
0-like excess more significant than that observed in the data.
10 Results
The data, scrutinised with the statistical tests described in the previous section, show no significant ex-
cesses. The LLR tests for a Z
χ0find global p-values of 58%, 91% and 83% in the dielectron, dimuon,
and combined channels, respectively. The local and global p-values as a function of the Z
0pole mass are shown in Fig. 2. The un-capped p-value is used below a pole mass of 1.5 TeV, which quantifies both excesses and deficits, where there are an adequate number of events. Above 1.5 TeV, one can end up with an ill-defined probability density function, with negative probabilities, and therefore the capped p-value, which only quantifies excesses, is used instead.
The largest deviation from the background-only hypothesis using the LLR tests for a Z
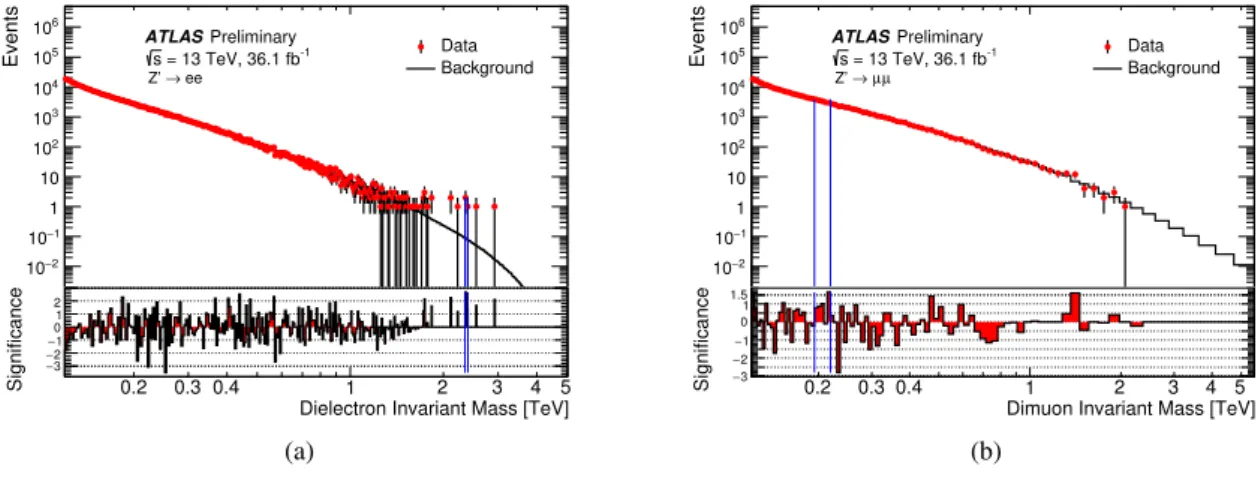
0χis observed at 2.37 TeV in the dielectron mass spectrum with a local significance of 2.5 σ, but globally the excess is not significant (-0.2 σ). The B ump H unter [53] test, which scans the mass spectrum with varying intervals to find the most significant excess in data, finds p-values of 71% and 94% in the dielectron and dimuon channels, respectively. Fig. 3 shows the dilepton mass distribution in the dielectron (left) and dimuon channel (right) respectively with the observed data overlaid on the combined background prediction as well as the local significance. The interval with the largest upward deviation has been indicated by a pair of blue lines.
[TeV]
MZ’
0.2 0.3 0.4 1 2 3 4
0Local p
3
10− 2
10− 1
10−
1 10 102
0σ Local significance
1σ
2σ
3σ 0σ
Global significance for largest excess 1σ
ATLASPreliminary s = 13 TeV, 36.1 fb-1 ll
χ→
0, Z’
Observed p
Figure 2: The local p-value derived assuming Z
0χsignal shapes with pole masses between 0.15 and 4.0 TeV for
the combined dilepton channel. Accompanying local and global significance levels are shown as dashed lines. The
un-capped p
0value is used for pole masses below 1.5 TeV, while the capped p
0value is used for higher pole masses.
0.2 0.3 0.4 1 2 3 4 5
Events
3
10− 2
10− 1
10−
1 10 102
103
104
105
106
Data Background = 13 TeV, 36.1 fb-1
s ee Z’ →
ATLASPreliminary
Dielectron Invariant Mass [TeV]
0.2 0.3 0.4 1 2 3 4 5
Significance
3
− 2
− 1
− 0 1 2
(a)
0.2 0.3 0.4 1 2 3 4 5
Events
3
10− 2
10− 1
10−
1 10 102
103
104
105
106
Data Background = 13 TeV, 36.1 fb-1
s µ µ Z’ →
ATLASPreliminary
Dimuon Invariant Mass [TeV]
0.2 0.3 0.4 1 2 3 4 5
Significance 3−
2
−
−1 0 1 1.5
(b)
Figure 3: Dilepton mass distribution in the (a) dielectron and (b) dimuon channel, showing the observed data
together with their statistical uncertainty, combined background prediction, and corresponding bin-by-bin signific-
ance. The most significant interval is denoted by the vertical blue lines.
10.1 Z 0 Cross-section and Mass Limits
Upper limits on the cross-section times branching ratio (σB) for Z
0bosons are presented in Fig. 4. The observed and expected lower pole mass limits for various Z
0scenarios are summarised in Table 5. The upper limits on σB for Z
0bosons start to weaken above a pole mass of ∼ 3.5 TeV. This is mainly due to the combined effect of a rapidly-falling signal cross-section as the kinematic limit is approached, with an increasing proportion of the signal being produced o ff -shell in the low-mass tail, and the natural width of the resonance. The effect is more pronounced in the dimuon channel due to worse mass resolution than in the dielectron channel. The selection efficiency also starts to slowly decrease at very high pole masses, but this is a sub-dominant e ff ect.
[TeV]
MZ’
0.5 1 1.5 2 2.5 3 3.5 4 4.5 5
B [pb]σ
10-5
10-4
10-3
10-2
10-1
1 Expected limit
1σ Expected ±
2σ Expected ± Observed limit Z’SSM
Z’χ
Z’ψ
Preliminary ATLAS
ll Z’ →
= 13 TeV, 36.1 fb-1
s
Figure 4: Upper 95% CL limits on the Z
0production cross-section times branching ratio to two leptons of a single flavour as a function of Z
0pole mass (M
Z0). Results are shown for the combined dilepton channel. The signal theory predictions are calculated with P ythia 8 using the NNPDF23LO PDF set [37], and corrected to next-to-next-to- leading order in QCD using VRAP [29] and the CT14NNLO PDF set [30]. The signal theoretical uncertainties are shown as a band on the Z
SSM0theory line for illustration purposes, but are not included in the σ B limit calculation.
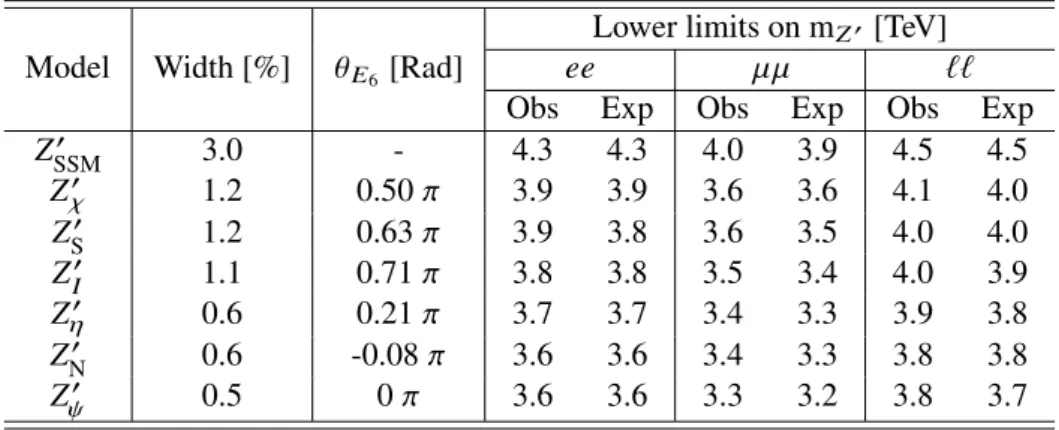
Table 5: Observed and expected 95% CL lower mass limits for various Z
0gauge boson models, quoted to the nearest 100 GeV. The widths are quoted as a percentage of the resonance mass.
Model Width [%] θ
E6[Rad]
Lower limits on m
Z0[TeV]
ee µµ ``
Obs Exp Obs Exp Obs Exp
Z
SSM03.0 - 4.3 4.3 4.0 3.9 4.5 4.5
Z
χ01.2 0.50 π 3.9 3.9 3.6 3.6 4.1 4.0
Z
S01.2 0.63 π 3.9 3.8 3.6 3.5 4.0 4.0
Z
I01.1 0.71 π 3.8 3.8 3.5 3.4 4.0 3.9
Z
η00.6 0.21 π 3.7 3.7 3.4 3.3 3.9 3.8
Z
N00.6 -0.08 π 3.6 3.6 3.4 3.3 3.8 3.8
Z
ψ00.5 0 π 3.6 3.6 3.3 3.2 3.8 3.7
10.2 Limits on Minimal Z 0 Models
Limits are set on the relative coupling strength of the Z
0boson coupling to that of the SM Z boson (γ
0) as a function of the Z
M i n0boson mass, as well as a function of the mixing angle θ
M i n, as shown in Fig. 5. The two θ
M i nvalues yielding the minimum and maximum cross-sections are used to define a band of limits in the (γ
0, M
ZM i n) plane. It is possible to put lower mass limits on specific models which are covered by the (γ
0, θ
M i n) parameterisation as in Table 6. The structure observed in the limits as a function of θ
M i n, such as the maximum around θ
M i n= 2.2, is due to the changing shape of the resonance at a given pole mass, from narrow to wide.
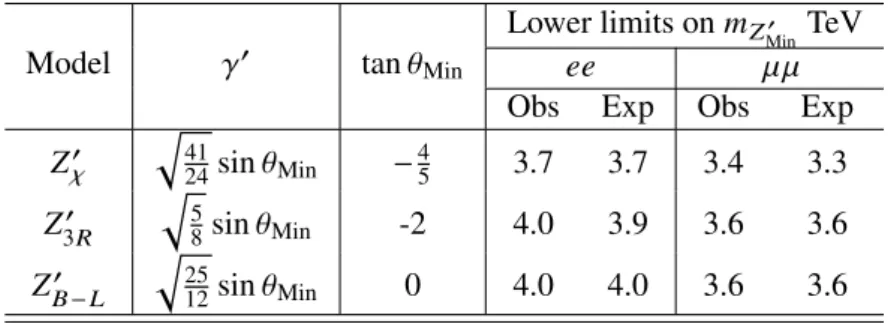
Table 6: Observed and expected 95% CL lower mass limits for various Z
M i n0models, rounded to the nearest 100 GeV.
Model γ
0tan θ
MinLower limits on m
Z0Min
TeV
ee µµ
Obs Exp Obs Exp
Z
0χq
4124
sin θ
Min−
453.7 3.7 3.4 3.3 Z
3R0q
58
sin θ
Min-2 4.0 3.9 3.6 3.6
Z
0B−Lq
2512
sin θ
Min0 4.0 4.0 3.6 3.6
[TeV]
Z’Min
0.5 1 1.5 2 2.5 3 3.5 4M 4.5 5
’γ
2
10− 1
10−
1
10 Exp. Obs.
] [0, π
Min∈ Limit range for θ
χ)
Min(Z’
θ
3R)
Min(Z’
θ
B-L)
Min(Z’
θ
Preliminary ATLAS
= 13 TeV, 36.1 fb-1
s ee
Min→ Z’
(a)
[TeV]
Z’Min
0.5 1 1.5 2 2.5 3 3.5 4M 4.5 5
’γ
2
10− 1
10−
1
10 Exp. Obs.
] [0, π
Min∈ Limit range for θ
χ)
Min(Z’
θ
3R)
Min(Z’
θ
B-L)
Min(Z’
θ
Preliminary ATLAS
= 13 TeV, 36.1 fb-1
s µ µ
Min→ Z’
(b)
θMin
0 0.5 1 1.5 2 2.5 3
’γ
2
10− 1
10−
1 10
Exp. Obs.
= 5.0 TeV
Z’Min
M = 4.5 TeV
Z’Min
M = 4.0 TeV
Z’Min
M = 3.5 TeV
Z’Min
M = 3.0 TeV
Z’Min
M = 2.5 TeV
Z’Min
M = 2.0 TeV
Z’Min
M = 1.5 TeV
Z’Min
M = 1.0 TeV
Z’Min
M = 0.5 TeV
Z’Min
M
Preliminary ATLAS
= 13 TeV, 36.1 fb-1
s ee
Min→ Z’
(c)
θMin
0 0.5 1 1.5 2 2.5 3
’γ
2
10− 1
10−
1 10
Exp. Obs.
= 5.0 TeV
Z’Min
M = 4.5 TeV
Z’Min
M = 4.0 TeV
Z’Min
M = 3.5 TeV
Z’Min
M = 3.0 TeV
Z’Min
M = 2.5 TeV
Z’Min
M = 2.0 TeV
Z’Min
M = 1.5 TeV
Z’Min
M = 1.0 TeV
Z’Min
M = 0.5 TeV
Z’Min
M
Preliminary ATLAS
= 13 TeV, 36.1 fb-1
s µ µ
Min→ Z’
(d)
Figure 5: Expected (dotted and dashed lines) and observed (filled area and lines) limits are set at 95% CL on the relative coupling strength γ
0for the (a) dielectron and (b) dimuon channels as a function of the Z
M i n0mass in the Minimal Z
0model. Limit curves are shown for three representative values of the mixing between the generators of the (B − L) and the weak hypercharge Y gauge groups θ
M i n. These are: tan θ
M i n= 0, tan θ
M i n= − 2 and tan θ
M i n= −0.8, which correspond respectively to the Z
B−L0, Z
3R0and Z
0χmodels at specific values of γ
0. The region above each line is excluded. The gray band envelops all observed limit curves, which depend on the choice of θ
M i n∈ [0, π]. The corresponding expected limit curves are within the area delimited by the two dotted lines.
Also shown are the expected (empty markers and dashed lines) and observed (filled markers and lines) limits at 95% CL on γ
0for the (c) dielectron and (d) dimuon channels as a function of θ
M i n. The limits are set for several representative values of the mass of the Z
0boson, M
Z0M i n
. The region above each line is excluded.
10.3 Generic Z 0 Limits
In order to derive more general limits, an approach to compare the data to signals that are more model- independent was developed. This was achieved by applying fiducial cuts to the signal templates (lepton p
T> 30 GeV, and lepton |η | < 2.5) and a mass window of two times the true signal width (width of the Breit-Wigner) around the pole mass of the signal. This is expected to give more independent limits since the e ff ects in the tails, foremost the parton luminosity tail and interference e ff ects are removed.
The resulting limits can be seen in Fig. 6. For other models to be interpreted with these cross-section limits, one should calculate the acceptance of a given model in the same fiducial region, multiply it by the total cross-section and overlay the resulting acceptance corrected cross-section theory curve, to extract the mass limit for that model. The dilepton invariant mass shape, and angular distributions for the chosen model, should be sufficiently close to a generic Z
0so as not to induce additional efficiency differences.
[TeV]
MZ’
0.5 1 1.5 2 2.5 3 3.5 4 4.5 5
B [pb]σA
4
10− 3
10− 2
10− 1
10−
1% width 2% width 4% width 8% width 16% width 32% width Preliminary
ATLAS
ll Z’ →
= 13 TeV, 36.1 fb-1
s
expected limits
(a)
[TeV]
MZ’
0.5 1 1.5 2 2.5 3 3.5 4 4.5 5
B [pb]σA
4
10− 3
10− 2
10− 1
10−
1% width 2% width 4% width 8% width 16% width 32% width Preliminary
ATLAS
ll Z’ →
= 13 TeV, 36.1 fb-1
s
observed limits