ATLAS-CONF-2013-017 15/03/2013
ATLAS NOTE
March 6, 2013
Minor revision: March 14, 2013
Search for high-mass dilepton resonances in 20 fb
−1of pp collisions at
√ s = 8 TeV with the ATLAS experiment
The ATLAS Collaboration
Abstract
The ATLAS detector at the Large Hadron Collider is used to search for high mass res- onances (Z
′) decaying to an electron-positron pair or a muon-antimuon pair. Results are presented from the analysis of
ppcollisions at a center-of-mass energy of 8 TeV corre- sponding to an integrated luminosity of approximately 20 fb
−1. A
Z′with Standard Model
Zcouplings to fermions is excluded at 95% C.L. for masses below 2.79 TeV in the electron channel, 2.48 TeV in the muon channel, and 2.86 TeV in the two channels combined. Lim- its on other model interpretations are also presented, including a Grand Unification model based on the
E6gauge group and a spin-2 Randall-Sundrum graviton.
Figure 1 has been revised to show example SSM Z’ signals at the correct pole masses and with correct scaling.
⃝c Copyright 2013 CERN for the benefit of the ATLAS Collaboration.
Reproduction of this article or parts of it is allowed as specified in the CC-BY-3.0 license.
1 Introduction
A search for high-mass resonances decaying into e
+e
−or
µ+µ−pairs is presented based on 8 TeV LHC pp collision data recorded with the ATLAS detector [1] in 2012. This note presents results on a new heavy neutral gauge boson with spin-1 [2, 3] and a Randall-Sundrum (RS) graviton with spin-2 [4].
The benchmark model for Z
′bosons is the Sequential Standard Model (SSM) [2], in which the Z
′(Z
SSM′) has the same couplings to fermions as the Standard Model (SM) Z boson. A more theoretically- motivated model is a Grand Unification model in which the E
6gauge group is broken into SU(5) and two additional U(1) groups [5]. The lightest linear combination of the corresponding two new neutral gauge bosons, Z
ψ′and Z
χ′, is considered the Z
′candidate: Z
′(
θE6)
=Z
ψ′cos
θE6 +Z
χ′sin
θE6, where 0
≤θE6 < πis the mixing angle between the two gauge bosons. The pattern of spontaneous symmetry breaking and the value of
θE6determine the Z
′couplings to fermions. Six di
fferent models [2, 5] lead to the specific Z
′states named Z
ψ′, Z
N′, Z
′η, Z
′I, Z
S′and Z
χ′, respectively. In this search, the resonances are assumed to have a narrow intrinsic width. The expected intrinsic width of the Z
SSM′as a fraction of the mass is 3.1%, while for any E
6model the intrinsic width is predicted to be between 0.5% and 1.3% [6].
Another set of models is motivated by various solutions to the hierarchy problem of the SM. The hierarchy problem originates from the fact that the energy scale of electroweak symmetry breaking,
O(1 TeV), is much smaller than the gravitational Planck scale, M
Pl∼ O(10
19GeV). The radiative correc- tions to the SM Higgs boson tend to drive the Higgs boson mass to the ultraviolet cuto
ffin the radiative loop, which in the absence of any other intermediate scale of new physics is M
Pl.
The hierarchy problem has been addressed by models invoking extra spatial dimensions, by allowing the gravitational force to permeate into the extra dimensions. In particular, the Randall-Sundrum model invokes an extra dimension with curvature k in order to generate a warped space-time metric in this dimension [4]. The effect of this warping is that the apparent strength of gravity in the 4-dimensional subspace populated by the SM particles is exponentially suppressed compared to the true strength of gravity in the extra dimension. Thus, the large hierarchy between the true M
Pl, which is postulated to be of order the electroweak scale, and the apparently large observed M
Plis bridged by this model. The Randall-Sundrum model predicts excited Kaluza-Klein modes of the graviton, which appear as spin-2 resonances and can decay into dileptons; the first excitation mode is called G
∗. These modes have a narrow intrinsic width when k/M
Pl<0.1, where k is the space-time curvature in the extra dimension and M
Plis the reduced Planck mass (M
Pl =M
Pl/√8
π); the expected intrinsic width of the G
∗is 1.4% for k
/M
Pl =0
.1.
Previous results from ATLAS using 6 fb
−1data at
√s
=8 TeV exclude a Z
′SSMboson with mass smaller than 2.49 TeV at 95% Credibility Level (C.L.) [7]. This note updates the previous analysis using 20 fb
−1of
√s
=8 TeV ATLAS data from 2012. Among other improvements, this analysis utilizes an improved lepton selection to increase signal efficiency and makes use of refined background estimation techniques and treatment of systematic uncertainties. For a Z
SSM′with a mass of 2.5 TeV, the expected cross section limit improved by approximately three and a half when compared to the previous ATLAS result [7].
2 ATLAS detector
The data used for this analysis were collected in 2012 using the ATLAS detector [1]. The latter consists of an inner tracking detector system (ID) surrounded by a superconducting solenoid, electromagnetic and hadronic calorimeters, and an external muon spectrometer (MS). Charged particles in the pseudorapidity
11ATLAS uses a right-handed coordinate system with its origin at the nominal interaction point in the center of the detector and thez-axis along the beam pipe. Thex-axis points from the interaction point to the center of the LHC ring, and theyaxis points upward. Cylindrical coordinates (r, ϕ) are used in the transverse plane,ϕ
range
|η| <2.5 are reconstructed with the inner detector, which consists of layers of silicon pixel and strip detectors and a straw-tube transition-radiation tracker, the latter extending to
|η| <2
.0. The ID is immersed in a 2 T magnetic field provided by a superconducting solenoid. The superconducting solenoid is surrounded by a hermetic calorimeter that covers
|η| <4.9 and provides three-dimensional reconstruction of particle showers using lead (copper) absorbers in the central (forward) region and liquid argon as the active material for the electromagnetic compartment followed by a hadronic compartment which is based on scintillating tiles sampling with iron absorbers for
|η| <1.7 and on liquid argon sampling with copper or tungsten absorbers for
|η|>1
.5. For
|η|<2
.5, the electromagnetic calorimeter is finely segmented and plays an important role in electron identification. Outside the calorimeter, air- core toroids provide the magnetic field for the muon spectrometer. Three stations of precision drift tubes and cathode strip chambers provide an accurate measurement of the muon track curvature in the region
|η|<
2
.7. Resistive-plate and thin-gap chambers provide muon triggering capability up to
|η|<2
.4.
3 Event selection
All candidate events must satisfy data-quality requirements, i.e., proper functioning of the ID, MS, solenoid, toroid, calorimeter and trigger subsystems, as well as stable LHC beam. Each event must have at least one primary vertex with more than two tracks.
In the e
+e
−channel, the events are required to have been triggered by a diphoton trigger with trans- verse energy threshold E
T >35 GeV and E
T >25 GeV for the leading and subleading candidate, respectively. The diphoton trigger is preferred over the dielectron trigger as the lack of requirements on the electron track is advantageous in the background-determination method. Electron candidates con- sist of clusters of energy deposited in the electromagnetic calorimeter that are associated to ID tracks.
For the 2012 LHC data taking, the electron reconstruction algorithm has been improved with respect to 2011 [8]. The ATLAS track pattern recognition and global
χ2fit were updated to account for en- ergy losses due to bremsstrahlung, and the track-to-cluster matching algorithm was improved to be less sensitive to bremsstrahlung losses.
At least two electron candidates within
|η| <2
.47 are required. The leading (subleading) electron must satisfy E
T >40 GeV (E
T >30 GeV). The region 1.37
≤ |η| ≤1.52 is excluded because it corre- sponds to a transition region between the barrel and endcap calorimeters which exhibits degraded energy resolution. Charge balance between the two electron candidates is not required because of possible charge mis-identification, either due to bremsstrahlung or to the limited momentum resolution of the in- ner detector at very high transverse momentum (p
T). Electron candidates must have a well-reconstructed ID track, and the cluster should satisfy a set of identification criteria [9] that were optimized to maintain good performance in high pile-up conditions and to take advantage of the new electron reconstruction.
The identification criteria require the shower profiles to be consistent with those expected for electro- magnetic showers as well as a minimum requirement on the amount of transition radiation. In addition, to suppress background from photon conversion, a hit in the first layer of the pixel detector is required if an active pixel layer is traversed. The electron energy is obtained from the calorimeter measurements and its direction from the associated track. To suppress background from jets misidentified as electrons, the electron candidate with the higher E
Tis required to be isolated by requiring
Σ
E
T(
∆R
<0
.2)
<0
.007
×E
T +5
.0 GeV
,where
∆R
= √(
∆η)
2+(
∆ϕ)
2and
ΣE
T(
∆R
<0
.2) is the sum of the cluster transverse energies around the electron direction in a cone of
∆R
<0
.2. The sum excludes the core of the electron energy deposition
pipe. The pseudorapidity is defined in terms of the polar angleθasη=−ln tan(θ/2).
and is corrected for transverse shower leakage and pile-up from additional pp collisions. Similarly, the electron candidate with the lower E
Tis required to satisfy
Σ
E
T(
∆R
<0
.2)
<0
.022
×E
T +6
.0 GeV
.The difference in the isolation requirement for leading and subleading electrons takes into account the di
fferent energy losses due to bremsstrahlung, while maintaining a high e
fficiency of
≈99% for both. If more than one electron pair is found in an event, the one with the highest transverse momentum scalar sum of the two electrons is selected. Using these selection criteria, the acceptance times efficiency for a Z
′ →e
+e
−of mass 2 TeV is 73%, as determined from simulation.
In the
µ+µ−channel, the events must be triggered by at least one of two single-muon triggers with thresholds of p
T >24 GeV and p
T >36 GeV. The complementary trigger with the higher threshold recovers small ine
fficiencies associated with the requirement that the muon is isolated for the lower threshold trigger requirement. Muon tracks are reconstructed independently in both the ID and MS.
The momentum is taken from a combined fit to the measurements from both subsystems and the muon has to satisfy p
T >25 GeV,
|η| <2
.4. Each muon is required to have a minimum number of hits in each of the inner detector components. To obtain optimal momentum resolution, selected muons are required to have at least three hits in each (inner, middle, and outer) station of the MS, and at least one hit in two layers of the trigger chambers. These muons are referred to as 3-station muons, and have p
Tresolution at 1 TeV ranging from 10% to 25%. In the forward region of the MS, the hit requirement on the inner station corresponds to at least two hits in the cathode strip chambers. In addition to 3-station muons, the best muons in the central region of the MS (
|η| <1.05) with at least five precision hits in each of the inner and outer stations are selected, and are referred to as 2-station muons. These 2-station muons are required to have at least one hit in one layer of the trigger chambers, and have slightly worse p
Tresolution than the 3-station muons. Muon candidates passing through known misaligned chambers are rejected. Residual misalignments of the muon detectors, which could cause a degradation of the momentum resolution, were studied with collision data in which the muons traversed overlapping sets of muon chambers. The e
ffect of the misalignments, and the intrinsic position resolution, for the present data set is included in the simulation. For each 3-station (2-station) muon, the di
fference between the standalone momentum measurements from the ID and MS must not exceed five (three) times the sum in quadrature of the standalone uncertainties. To suppress background from cosmic rays, the muons are also required to satisfy selections on the transverse impact parameter,
|d
0|<0
.2 mm, and the z coordinate with respect to the primary vertex (PV),
|z0−z(PV)|
<1 mm. To reduce the background from jets, each muon is required to be isolated such that
ΣpT(∆R
<0.3)/ p
T(µ)
<0.05, where
ΣpT(∆R
<0.3) is the sum of the p
Tof the other tracks in a cone with
∆R
<0
.3 around the direction of the muon.
The muons that pass the selection criteria described above are used to build opposite-sign muon pairs. First, if two opposite-sign muons passing the 3-station selection are found, they are used to make the pair, and the event is said to pass the “tight dimuon selection”. This category comprises about 90%
of the sample. If more than one tight dimuon candidate is found in an event, the one with the highest transverse momentum scalar sum is selected. If no tight dimuon candidate is found, pairs can be built with one 3-station muon and a 2-station muon of opposite-sign. Events with such pairs are said to pass the “loose dimuon selection”. Similarly, if more than one loose dimuon candidate is found in an event, the one with the highest transverse momentum scalar sum is selected. The acceptance times efficiency is 46% for a Z
′→µ+µ−of mass 2 TeV.
4 Backgrounds
For both channels, the dominant and irreducible background is the q q ¯
→Z/γ
∗ → ℓ+ℓ−(Drell-Yan)
+ −
multijet and W
+jet production, in which one or more jets pass the electron selection criteria. The former includes heavy flavor quarks and
γ +jet production, referred to below as dijet background. The latter includes semi-leptonic decays of t¯ t pairs and single-top production. Other important backgrounds are diboson (WW, WZ and ZZ) production and electrons from the dileptonic decay of t t. ¯
In the
µ+µ−channel, in order of dominance the backgrounds are Drell-Yan production, followed by t¯ t and diboson production; the dijet and W
+jet backgrounds are negligible.
Expected signal and backgrounds, with the exception of the dijet and W
+jet background, are evalu- ated with simulated samples and normalized with respect to one another using the highest-order available cross-section predictions. The signal processes are derived using P
ythia8 [10] samples, reweighted to the invariant-mass shape of the respective resonance. The parton distribution functions (PDFs) used are MSTW2008LO [11] for Z
′and CTEQ6L [12] for the G
∗samples.
The Drell-Yan sample for background modeling is generated at next-to-leading order (NLO) using P
owheg[13] with P
ythia8 to model hadronization and parton showering and the CT10 PDF [14]. The diboson processes are generated with H
erwig[15, 16], using the CTEQ6L1 PDF. The t t ¯ background is modeled with MC@NLO [17] with H
erwigusing the CT10 PDF. The diboson as well as the t¯ t sample are statistically limited at high invariant masses and therefore are extrapolated into this region using fits.
For all samples, the final-state photon radiation (FSR) is handled by P
hotos[18], and the interaction of particles and the response of the detector are modeled using a full ATLAS detector simulation [19] based on Geant4 [20].
The Z
/γ∗cross section is calculated at next-to-next-to-leading order (NNLO) pQCD using FEWZ [21, 22] with the MSTW2008NNLO PDFs [11]. The calculation includes NLO electroweak (EW) corrections beyond FSR, as well as a positive contribution from the irreducible, non-resonant photon-induced (PI) background, i.e.,
γγ→ℓ+ℓ−. The PI contribution has been estimated using the MRST2004qed [23] PDF at leading order (LO), currently the only set available that contains a description of the QED part of the proton, by taking an average of the predictions obtained under the current and constituent quark mass schemes. The di
fference to either scheme is used to assign the uncertainty on this additive correction.
The electroweak and photon induced corrections were verified by
SANC[24, 25]. An additional small correction arises from single boson production in which the final state charged lepton radiates a real W or Z. This has been estimated using M
adgraph5 [26], following the prescription outlined in Ref. [27].
The ratio of the calculated NNLO pQCD cross section with (without) the additional EW, PI and real W/Z corrections to the cross section from the Powheg (Pythia 8) sample is used to determine a mass- dependent K-factor for the DY background (signal) samples. The additional corrections are not applied to the signal samples, since they depend on the W and Z boson couplings of the new particle and are therefore model-dependent. The size of the K-factors at a dilepton mass of 2 TeV is 1.10 and 1.16 for the DY background and signal, respectively.
The diboson cross section is known to NLO with an uncertainty of 5%. The predicted t t ¯ cross section for pp collisions at a center-of-mass energy of
√s
=8 TeV is
σt¯t =238
+22−24pb for a top quark mass of 172.5 GeV. It has been calculated at approximate NNLO in QCD with Hathor 1.2 [28] using the MSTW2008 90% NNLO PDF sets [11]. PDF
+αSuncertainties are calculated according to the MSTW prescription [29] and added in quadrature to the scale uncertainty. The calculation is cross checked using a dedicated NLO+NNLL calculation [30] implemented in the Top++ program [31].
A data-driven method is used to evaluate the dijet and W
+jet background, due to the di
fficulty in
precisely modelling the probability of a jet to be mis-identified as an electron using Monte Carlo simu-
lation (MC). These probabilities (“fake rates”) are instead determined in an E
T- and
η-dependent way inbackground-enriched samples recorded by eleven di
fferent inclusive jet triggers, with E
Tthresholds in
the range 25 – 360 GeV. In each of these samples, the fake rate f
1( f
2) is calculated as the fraction of lead-
ing (subleading) electron candidates that pass the electron identification and isolation requirements with
respect to the entire sample of “loose” electron candidates. The latter pass only a subset of the electron
identification criteria, which is more strict than the ones the diphoton trigger imposes on a single object.
In order to avoid bias from real electron contribution from W decays or the Drell-Yan process, events are vetoed if the missing transverse momentum is larger than 25 GeV, or if they contain either two identified electrons satisfying strict criteria or two electrons satisfying less strict criteria but with an invariant mass between 71 and 111 GeV. A weighted average of the fake rates obtained from the eleven jet samples is then calculated. In addition, the probability r
1(r
2) that a real electron in the sample of loose electrons satisfies the electron identification and leading (subleading) isolation requirements is computed from the MC simulation. Potential di
fferences between data and MC simulation in identification and isolation e
fficiencies are accounted for by applying scale factors to the MC simulation.
A system of equations is used to solve for the unknown true contribution from events with one or more fake electrons. The relation between the number of true paired objects N
ab, with a
,b
∈ {R
,F
}, and the number of measured ones in the diphoton-triggered sample N
xy, with x
, y∈ {T
,L
}, can be written as:
N
T TN
T LN
LTN
LL
=
r
1r
2r
1f
2f
1r
2f
1f
2r
1(1
−r
2) r
1(1
−f
2) f
1(1
−r
2) f
1(1
−f
2) (1
−r
1)r
2(1
−r
1) f
2(1
−f
1)r
2(1
−f
1) f
2(1
−r
1)(1
−r
2) (1
−r
1)(1
−f
2) (1
−f
1)(1
−r
2) (1
−f
1)(1
−f
2)
N
RRN
RFN
FRN
FF
(1)
The subscripts R and F refer to real electrons and fakes, e.g., jets, respectively. The subscript T refers to electrons that are identified and isolated (“tight”) . The subscript L corresponds to electrons that pass the
“loose” requirements described above but fail “tight”.
The background is given as the part of N
T T, the number of pairs where both objects are reconstructed as signal-like, which originates from a pair of objects with at least one fake:
N
Di jet&W+jetT T =
r
1f
2N
RF+f
1r
2N
FR+f
1f
2N
FF(2) The truth variables on the right hand side can be expressed with measurable quantities (N
T T, N
T L, N
LT, N
LL) by inverting the matrix in Equation 1.
The dijet background in the dimuon sample is evaluated from data using the reversed isolation method described in Ref. [32], based on the track isolation variable
Σp
T(
∆R
<0
.3)
/p
T. The contri- bution of the dijet background in the dimuon channel has been found to be negligible. Backgrounds from cosmic rays are also negligible.
The observed invariant mass distributions, m
eeand m
µµ, are compared to the expectation from the Standard Model backgrounds. To make this comparison, the sum of the Drell-Yan, t t ¯ and diboson back- grounds (with the relative contributions fixed according to the respective cross sections) is scaled such that, when added to the data-driven dijet and W
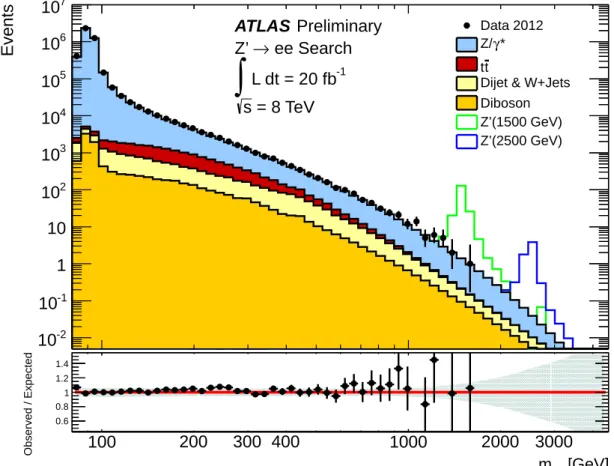
+jet background, the result agrees with the observed Table 1: The expected and observed numbers of events in the dielectron channel. The errors on the expected numbers of events include statistical and systematic uncertainties.
m
ee[GeV] 110 - 200 200 - 400 400 - 800 800 - 1200 1200 - 3000 3000 - 4500 Z/γ
∗119000
±8000 13700
±900 1290
±80 68
±4 9.8
±1.1 0.008
±0.005 tt 7000
±800 2400
±400 160
±60 2
.5
±0
.6 0
.11
±0
.04
<0
.001 Diboson 1830
±210 660
±160 93
±33 4
.8
±0
.8 0
.79
±0
.26 0
.005
±0
.004 Dijet, W
+jet 3900
±800 1260
±310 230
±110 8.6
±2.4 0.9
±0.6 0.004
±0.006 Total 131000
±8000 18000
±1100 1780
±150 84
±5 11.6
±1.3 0.017
±0.009
Data 133131 18570 1827 98 10 0
Events
10
-210
-11 10 10
210
310
410
510
610
7Data 2012 γ* Z/
t t
Dijet & W+Jets Diboson Z’(1500 GeV) Z’(2500 GeV)
Preliminary ATLAS
ee Search
→ Z’
L dt = 20 fb
-1∫ s = 8 TeV
[GeV]
mee
100 200 300 400 1000 2000 3000
Observed / Expected
0.6 0.8 1 1.2 1.4
Figure 1: Dielectron invariant mass (m
ee) distribution with statistical uncertainties after final selection, compared to the stacked sum of all expected backgrounds, with two selected Z
SSM′signals overlaid. The bin width is constant in log m
ee. Bottom inset: The black points show the ratio of observed to expected events with statistical uncertainty, while the shaded band indicates the mass-dependent systematic uncer- tainty on the sum of the backgrounds.
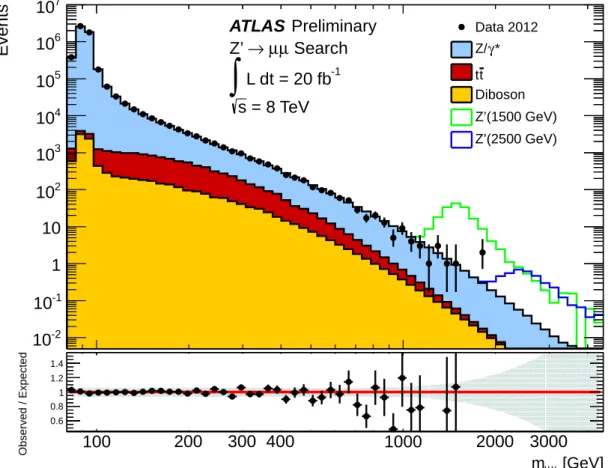
Table 2: The expected and observed number of events in the dimuon channel. The errors on the expected numbers of events include statistical and systematic uncertainties.
m
µµ[GeV] 110 - 200 200 - 400 400 - 800 800 - 1200 1200 - 3000 3000 - 4500 Z/γ
∗111000
±8000 11000
±1000 1000
±100 49
±5 7.3
±1.3 0.033
±0.029 tt 5900
±900 1900
±400 140
±60 2
.7
±0
.7 0
.16
±0
.08
<0
.001 Diboson 1520
±190 520
±140 62
±26 2
.8
±1
.0 0
.38
±0
.28 0
.002
±0
.003 Total 118000
±8000 13300
±1100 1160
±120 55
±5 7
.8
±1
.3 0
.035
±0
.029
Data 118701 13349 1109 48 8 0
number of data events in the 80 - 110 GeV normalization region. The advantage of this approach is that the mass-independent uncertainties cancel in the statistical analysis between the high-mass event yields where the search is performed and the event yields in the normalization region. The predicted and observed event yields are found to agree within 1% in the normalization region.
Figure 1 and Table 1 present the dielectron invariant mass distribution after final selection and the
Events
10
-210
-11 10 10
210
310
410
510
610
7Data 2012 γ* Z/
t t Diboson Z’(1500 GeV) Z’(2500 GeV)
Preliminary ATLAS
Search µ
µ
→ Z’
L dt = 20 fb
-1∫ s = 8 TeV
[GeV]
µ
mµ
100 200 300 400 1000 2000 3000
Observed / Expected
0.6 0.8 1 1.2 1.4
Figure 2: Dimuon invariant mass (m
µµ) distribution with statistical uncertainties after final selection, compared to the stacked sum of all expected backgrounds, with two selected Z
SSM′signals overlaid. The bin width is constant in log m
µµ. Bottom inset: The black points show the ratio of observed to expected events with statistical uncertainty, while the shaded band indicates the mass-dependent systematic uncer- tainty on the sum of the backgrounds.
number of events observed compared to the expected background. Figure 2 and Table 2 reflect this information for the dimuon channel. Good agreement between the data and the background expectation is found.
5 Systematic uncertainties
The treatment of systematic uncertainties in this analysis is simplified by the fact that the backgrounds are normalized to the data in the region of the Z peak. This procedure makes the analysis insensitive to the uncertainty on the measurement of the integrated luminosity as well as other mass-independent systematic uncertainties. Instead, a mass-independent systematic error of 5%, due to the uncertainty on the Z
/γ∗cross section in the normalization region, is assigned to the signal expectation. In addition, all systematic uncertainties estimated to have an impact
≤3% on the expected number of events are neglected in the statistical analysis having a negligible impact on the limit setting.
Mass-dependent systematic uncertainties include theoretical e
ffects due to the PDF, QCD and elec-
troweak corrections, as well as experimental e
ffects, namely lepton e
fficiency and resolution. These
uncertainties are correlated across all bins in the search region. The mass-dependent theoretical uncer-
tainties are applied to the Z/γ
∗background expectation only. We assume that the experimental uncer- tainties are fully correlated between signal and all types of backgrounds. All systematic uncertainties quoted below refer to narrow resonances with dilepton masses of 2 TeV.
The uncertainty on the PDF and on
αSis obtained from the 90% C.L. MSTW2008NNLO PDF set.
An additional uncertainty is assigned to take into account potential di
fferences between modern PDF sets at the same
αS=0.117: MSTW2008NNLO, CT10NNLO, NNPDF2.3 [33], ABM11 [34] and HER- APDF1.5 [35]. Of these, since only the central values for ABM11 are found to fall outside of the MSTW2008NNLO PDF uncertainty at the 90% C.L. the di
fference between predicted event yields ob- tained with the nominal MSTW2008NNLO and ABM11 PDFs is taken as an additional uncertainty.
There are also uncertainties due to variations of the renormalization and factorization scales by factors of two around the nominal scales, which are added in quadrature. The uncertainty on the photon-induced dileptons is mainly due to the uncertainty on the quark masses and the photon PDF. In addition, a sys- tematic uncertainty is attributed to electroweak corrections for both channels.
In the electron channel, the largest experimental systematic uncertainty is due to the estimate of the dijet and W
+jet backgrounds. The method for the data driven estimate decribed above has been altered by assuming r
1 =r
2=1. This leads to a simplification of the matrix in Equation 1 but also to the need of MC corrections for identification and isolation ine
fficiencies of real electrons. Large MC corrections can be avoided in a third method where objects in the background enriched sample fail the requirement on the matching between track and cluster instead of the full identification and isolation requirement. The two additional methods have been used in order to determine the background. In addition, the default and the two additional methods are used to determine the background on the jet-triggered and on the diphoton triggered sample employing a “Tag and Probe” technique. Here a background-enriched sample of probes is derived by selecting, among other requirements to suppress real electron contamination, a jet-like tag and a probe with the same charge. The maximum deviation between the eight background estimates discussed above and the default one is 18% and taken as a systematic uncertainty.
In addition, the di
fferent requirements in order to suppress real electron contamination in the default fake rate calulation have been varied. The largest deviations of about 5% are seen when changing the value of the missing energy requirement. The statistical uncertainty of the fake rates results in an uncer- tainty of at most 5%. A further systematic uncertainty can arise if fake rates are di
fferent for di
fferent background processes, and in addition the relative contribution of these backgrounds is di
fferent in the data samples the fake rates are measured in and in the data sample the fake rates are applied to. It was found that b-jets do have a higher fake rate than light jets, but that the effect is negligible as the number of b-jets is small and rather similar in both samples. Thus, an overall systematic uncertainty of 20% was assigned to the dijet and W
+jet background. At low invariant masses an additional statistical uncertainty is due to the one from the sample the fake rates are applied to, which at high invariant masses is replaced by a systematic uncertainty due to the background extrapolation into this region.
Experimental systematics due to the electron reconstruction and identification e
fficiency as well as due to the energy calibration and resolution are neglected as they alter the expected number of events by less than 3%.
For the muon channel, the combined uncertainty on the trigger and reconstruction e
fficiency is esti-
mated to be 6% at 2 TeV. This uncertainty is dominated by a conservative estimate of the impact from
large energy loss due to muon bremsstrahlung in the calorimeter, which may interfere with reconstruc-
tion in the muon spectrometer if this energy loss is not well contained within the calorimeter. In addition,
the uncertainty on the resolution due to residual misalignments in the muon spectrometer propagates to
a change in the background shape, and in the width of signal line-shape. The potential impact of this
uncertainty on the background estimate at 2 TeV reaches 3% in the tight dimuon channel and 7% in the
loose dimuon channel. Its effect on the signal is negligible. As with the electron channel, the momentum
calibration uncertainty has negligible impact in the muon channel search.
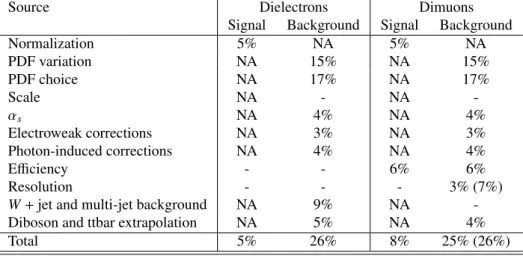
Table 3: Summary of systematic uncertainties on the expected numbers of events at m
ℓℓ =2 TeV. NA indicates that the uncertainty is not applicable, and “-” denotes a negligible entry (i.e.
<3%). Numbers in parentheses on the resolution and total uncertainty lines correspond to the loose dimuon selection.
Source Dielectrons Dimuons
Signal Background Signal Background
Normalization 5% NA 5% NA
PDF variation NA 15% NA 15%
PDF choice NA 17% NA 17%
Scale NA - NA -
αs NA 4% NA 4%
Electroweak corrections NA 3% NA 3%
Photon-induced corrections NA 4% NA 4%
Efficiency - - 6% 6%
Resolution - - - 3% (7%)
W+jet and multi-jet background NA 9% NA -
Diboson and ttbar extrapolation NA 5% NA 4%
Total 5% 26% 8% 25% (26%)
A summary of mass dependent systematic uncertainties relevant to this analysis is shown in Table 3.
6 Signal significance
The significance of a signal is summarized by a p-value, the probability of observing an excess in the search region at least as signal-like as the one observed in data, in the absence of signal. The outcome of the search is ranked against pseudo-experiments using a likelihood ratio, which is scanned as a function of Z
′cross section and M
Z′over the considered mass range up to 3.5 TeV. The data are consistent with the Standard Model background hypothesis, with global p-values of 18% and 98% for the dielectron and dimuon channels, respectively.
7 Limits
Given the absence of any significant signal, an upper limit on the number of signal events is determined at the 95% C.L. using a Bayesian approach [36] with a flat, positive prior on the signal cross section. A likelihood function is defined as the product of the Poisson probabilities over all mass bins in the search region. The Poisson probability in each bin is evaluated for the observed number of data events given the background and signal template expectation. The acceptance times e
fficiency for the signal as a function of mass is propagated into the expectation, and systematic uncertainties are incorporated in the likelihood via nuisance parameters [36].
The upper limit on the number of produced Z
′events is converted into an upper limit on cross
section times branching fraction,
σB. The expected exclusion limits are determined using simulated
pseudo-experiments containing only background processes by evaluating the 95% C.L. upper limits for
each pseudo-experiment for each fixed value of M
Z′. The median of the distribution of limits is chosen
to represent the expected limit. The ensemble of limits is also used to find the 68% and 95% envelope of
the expected limits as a function of M
Z′.
Limits on spin-1
Z
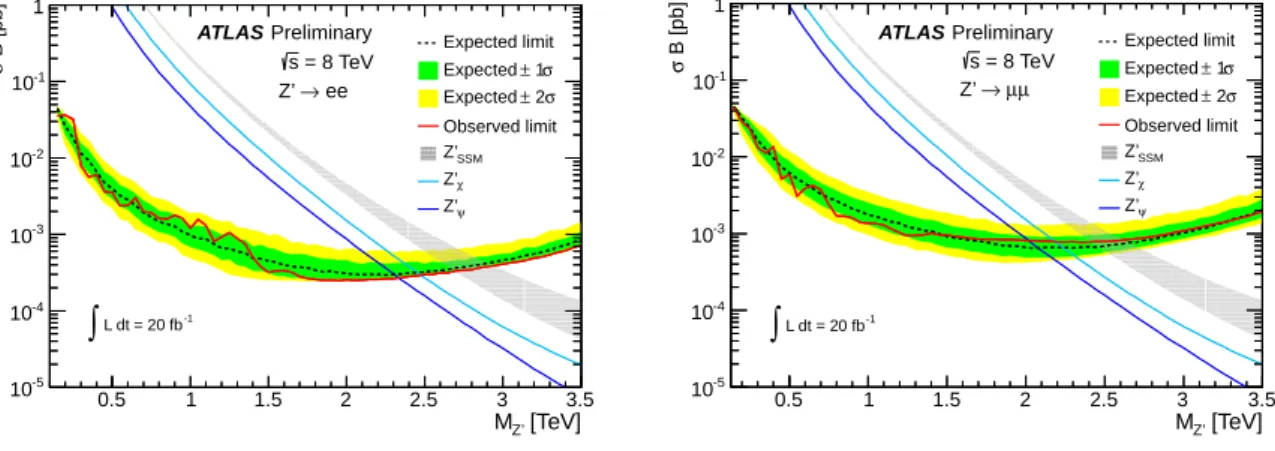
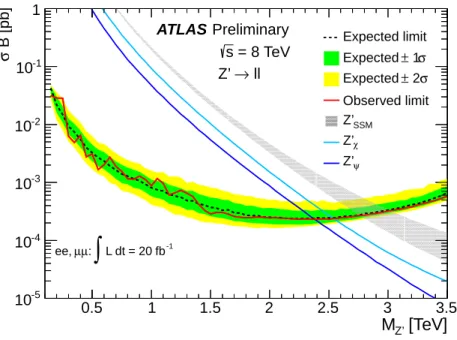
′Figure 3 shows the 95% C.L. observed and expected exclusion limits on
σB for the dielectron and dimuon channels, using the Z
SSM′width for the signal templates. It also shows the theoretical cross section times branching ratio for the Z
′SSMand for the two E
6-motivated Z
′models with the highest and lowest
σB. Figure 4 shows the 95% C.L. exclusion limit on
σB for the combination of the electron
[TeV]
MZ’
0.5 1 1.5 2 2.5 3 3.5
B [pb]σ
10-5
10-4
10-3
10-2
10-1
1
Expected limit σ
± 1 Expected
σ
± 2 Expected Observed limit Z’SSM
Z’χ
Z’ψ
Preliminary ATLAS
→ ee Z’
= 8 TeV s
L dt = 20 fb-1
∫
[TeV]
MZ’
0.5 1 1.5 2 2.5 3 3.5
B [pb]σ
10-5
10-4
10-3
10-2
10-1
1
Expected limit σ
± 1 Expected
σ
± 2 Expected Observed limit Z’SSM
Z’χ
Z’ψ
Preliminary ATLAS
µ µ
→ Z’
= 8 TeV s
L dt = 20 fb-1
∫
Figure 3: Median expected (dashed line) and observed (solid red line) 95% C.L. limits on
σBand expected
σB for Z
SSM′production and the two E
6-motivated Z
′models with lowest and highest
σB for the dielectron (left) and dimuon channel (right). The limits are conservative for the E
6-motivated Z
′models due to their narrower intrinsic width. The inner and outer bands show the range in which the limit is expected to lie in 68% and 95% of pseudo-experiments, respectively. The thickness of the Z
SSM′theory curve represents all theoretical uncertainties and holds for the other theory curves.
and muon channels, assuming an equal branching ratio. The combination is performed by defining the likelihood function in terms of
σB(Z
′ →ℓ+ℓ−) in both channels.
The rise of the
σB limits at high invariant mass is due mainly to the fast fall of the parton luminosity at high momentum transfer which enhances the low-mass tail, causing a distortion in the resonance peak shape. The e
ffect is reduced for narrower resonances like the Randall-Sundrum graviton G
∗. The 95%
C.L. limits on
σB are used to set mass limits for each of the considered models. Mass limits obtained for the Z
SSM′are displayed in Table 4. The combined mass limit for the Z
SSM′is 2.86 TeV (observed) and 2.85 TeV (expected). The combined mass limits on the E
6-motivated models are given in Table 5.
Table 4: e
+e
−,
µ+µ−and combined 95% C.L. mass limits on Z
′SSM.
ZSSM′ →e+e− ZSSM′ →µ+µ− Z′SSM→ℓ+ℓ− Observed mass limit [TeV] 2.79 2.48 2.86 Expected mass limit [TeV] 2.76 2.52 2.85Limits on spin-2 Randall-Sundrum gravitons
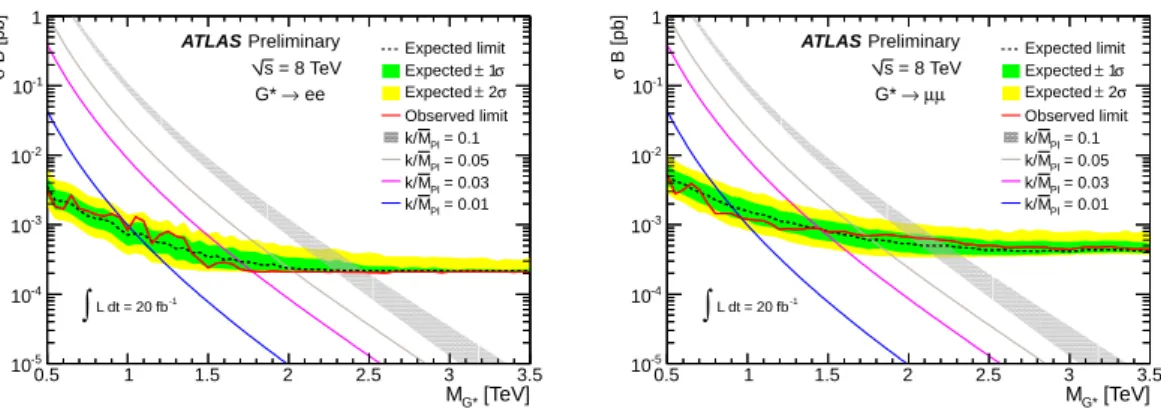
Figure 5 shows the 95% C.L. observed and expected exclusion limits on
σB(G
∗→e
+e
−) and
σB(G
∗→ µ+µ−), obtained with a k/M
Pl =0.1 signal template, together with the theoretical cross section times
branching ratio for couplings (k
/M
Pl) in the range 0.01-0.1. The curves for the di
fferent k
/M
Plcases are
[TeV]
M
Z’0.5 1 1.5 2 2.5 3 3.5
B [pb]σ
10-5
10-4
10-3
10-2
10-1
1
Expected limit σ
± 1 Expected
σ
± 2 Expected Observed limit Z’SSM
Z’χ
Z’ψ
Preliminary ATLAS
→ ll Z’
= 8 TeV s
L dt = 20 fb-1
∫
µ: µ ee,
Figure 4: Median expected (dashed line) and observed (solid red line) 95% C.L. limits on
σB and expected
σB for Z
SSM′production and the two E
6-motivated Z
′models with lowest and highest
σB for the combination of the dielectron and dimuon channels. The limits are conservative for the E
6-motivated Z
′models due to their narrower intrinsic width. The inner and outer bands show the range in which the limit is expected to lie in 68% and 95% of pseudo-experiments, respectively. The thickness of the Z
SSM′theory curve represents all theoretical uncertainties and holds for the other theory curves.
Table 5: Combined mass limits at 95% C.L. on the E
6-motivated Z
′models.
Model Z′ψ ZN′ Zη′ ZI′ ZS′ Zχ′ Observed mass limit [TeV] 2.38 2.39 2.44 2.42 2.47 2.54 Expected mass limit [TeV] 2.37 2.38 2.43 2.40 2.46 2.53
essentially the same, with a proportionality factor of (k/M
Pl)
2. Figure 6 shows the 95% C.L. exclusion limit on
σB for the combination of the electron and muon channels. The lower limits on the graviton mass derived for the G
∗with a coupling of k
/M
Pl=0
.1 are displayed in Table 6.
Table 6: e
+e
−,
µ+µ−and combined 95% C.L. mass limits on graviton (G
∗).
G∗→e+e− G∗→µ+µ− G∗→ℓ+ℓ− Observed mass limit [TeV] 2.40 2.10 2.47 Expected mass limit [TeV] 2.40 2.17 2.47
[TeV]
MG*
0.5 1 1.5 2 2.5 3 3.5
B [pb]σ
10-5
10-4
10-3
10-2
10-1
1
Expected limit σ
± 1 Expected
σ
± 2 Expected Observed limit
= 0.1 MPl
k/
= 0.05 MPl
k/
= 0.03 MPl
k/
= 0.01 MPl
k/
Preliminary ATLAS
→ ee G*
= 8 TeV s
L dt = 20 fb-1
∫
[TeV]
MG*
0.5 1 1.5 2 2.5 3 3.5
B [pb]σ
10-5
10-4
10-3
10-2
10-1
1
Expected limit σ
± 1 Expected
σ
± 2 Expected Observed limit
= 0.1 MPl
k/
= 0.05 MPl
k/
= 0.03 MPl
k/
= 0.01 MPl
k/
Preliminary ATLAS
µ µ
→ G*
= 8 TeV s
L dt = 20 fb-1
∫
Figure 5: Median expected (dashed line) and observed (solid red line) 95% C.L. limits on
σB and expected
σBfor graviton (G
∗) production in the dielectron (left) and dimuon channel (right). Several
σB are shown for couplings (k
/M
Pl) in the range of 0.01-0.1. The inner and outer bands show the range in which the limit is expected to lie in 68% and 95% of pseudo-experiments, respectively. The thickness of the k/M
Pl=0.1 theory curve represents all theoretical uncertainties and holds for the other theory curves.
[TeV]
MG*
0.5 1 1.5 2 2.5 3 3.5
B [pb]σ
10-5
10-4
10-3
10-2
10-1
1
Expected limit σ
± 1 Expected
σ
± 2 Expected Observed limit
= 0.1 MPl
k/
= 0.05 MPl
k/
= 0.03 MPl
k/
= 0.01 MPl
k/
Preliminary ATLAS
→ ll G*
= 8 TeV s
L dt = 20 fb-1
∫
µ: µ ee,
Figure 6: Median expected (dashed line) and observed (solid red line) 95% C.L. limits on
σBand expected
σB for graviton (G
∗) production for the combination of the dielectron and dimuon channels.
Several
σB are shown for couplings (k
/M
Pl) in the range of 0.01-0.1. The inner and outer bands show
the range in which the limit is expected to lie in 68% and 95% of pseudo-experiments, respectively. The
thickness of the k
/M
Pl=0
.1 theory curve represents all theoretical uncertainties and holds for the other
theory curves.
8 Conclusions
In conclusion, the ATLAS detector at the Large Hadron Collider has been used to search for narrow resonances in the dilepton invariant mass spectrum above the Z-boson pole with 20 fb
−1of proton-proton collision data at
√s
=8 TeV. The observed invariant-mass spectrum is consistent with the Standard Model expectation. Limits are set on the cross section times branching ratio
σB for spin-1 and spin-2 bosons. The resulting mass limits are 2.86 TeV for the Z
SSM′, 2.38
−2.54 TeV for various E
6-motivated Z
′bosons, and 2.47 TeV for a Randall-Sundrum graviton G
∗with coupling parameter k
/M
Plequal to 0.1.
For a Z
SSM′with a mass of 2.5 TeV, the expected cross section limit improved by approximately three and
a half when compared to the previous ATLAS result [7].
References
[1] ATLAS Collaboration, The ATLAS Experiment at the Large Hadron Collider, JINST
3(2008) S08003.
[2] P. Langacker, The Physics of Heavy Z
′Gauge Bosons, Rev. Mod. Phys.
81(2009) 1199–1228.
[3] J. Erler, P. Langacker, S. Munir, and E. R. Pena, Improved constraints on Z
′bosons from electroweak precision data, JHEP
0908(2009) 017.
[4] L. Randall and R. Sundrum, A large mass hierarchy from a small extra dimension, Phys. Rev. Lett.
83
(1999) 3370–3373.
[5] D. London and J. L. Rosner, Extra Gauge Bosons in E(6), Phys. Rev.
D34(1986) 1530.
[6] M. Dittmar, A.-S. Nicollerat, and A. Djouadi, Z
′studies at the LHC: An update, Phys. Lett.
B583(2004) 111–120.
[7] ATLAS Collaboration, Search for high mass dilepton resonances in 6.1 fb
−1of pp collisions at
√s
=
8 TeV with the ATLAS detector, Tech. Rep. ATLAS-CONF-2012-129, CERN, Geneva, September, 2012. http://cds.cern.ch/record/1477926.
[8] ATLAS Collaboration, Search for high mass resonances decaying to dilepton final states in pp collisions at
√s
=7 TeV with the ATLAS detector, JHEP
138(2012) 011.
[9] ATLAS Collaboration, Electron performance measurements with the ATLAS detector using the 2010 LHC proton-proton collision data, Eur. Phys. J.
C72(2012) 1909.
[10] T. Sj¨ostrand, S. Mrenna, and P. Z. Skands, A Brief Introduction to PYTHIA 8.1, Comput. Phys. Commun.
178(2008) 852–867.
[11] A. Martin, W. Stirling, R. Thorne, and G. Watt, Parton Distributions for the LHC, Eur. Phys. J.
C63
(2009) 189.
[12] J. Pumplin et al., New generation of parton distributions with uncertainties from global QCD analysis, JHEP
07(2002) 012.
[13] S. Alioli, P. Nason, C. Oleari, and E. Re, A general framework for implementing NLO calculations in shower Monte Carlo programs: the POWHEG BOX, JHEP
1006(2010) 043.
[14] H.-L. Lai, M. Guzzi, J. Huston, Z. Li, P. M. Nadolsky, et al., New parton distributions for collider physics, Phys. Rev.
D82(2010) 074024.
[15] G. Corcella et al., HERWIG 6: an event generator for hadron emission reactions with interfering gluons (including supersymmetric processes), JHEP
0101(2001) 010.
[16] G. Corcella, I. Knowles, G. Marchesini, S. Moretti, K. Odagiri, et al., HERWIG 6.5 release note,
arXiv:hep-ph/0210213.[17] S. Frixione and B. R. Webber, Matching NLO QCD computations and parton shower simulations, JHEP
0206(2002) 029.
[18] P. Golonka and Z. Wa¸s, PHOTOS Monte Carlo: a precision tool for QED corrections in Z and W
decays, Eur. Phys. J.
C45(2006) 97–107.
[19] ATLAS Collaboration, The ATLAS Simulation Infrastructure, Eur. Phys. J.
C70(2010) 823–874.
[20] GEANT4 Collaboration, S. Agostinelli et al., GEANT4: A simulation toolkit, Nucl. Instrum. Meth.
A506
(2003) 250.
[21] K. Melnikov and F. Petriello, Electroweak gauge boson production at hadron colliders through O(
α2s), Phys. Rev.
D74(2006) 114017.
[22] Y. Li and F. Petriello, Combining QCD and electroweak corrections to dilepton production in FEWZ, Phys. Rev.
D86(2012) 094034.
[23] A. D. Martin, R. G. Roberts, W. J. Stirling, and R. S. Thorne, Parton distributions incorporating QED contributions, Eur. Phys. J.
C39(2005) 155–161,
arXiv:hep-ph/0411040.[24] D. Bardin et al., SANC integrator in the progress: QCD and EW contributions, JETP Lett.
96(2012) 285–289,
arXiv:1207.4400 [hep-ph].[25] S. G. Bondarenko and A. A. Sapronov, NLO EW and QCD proton-proton cross section calculations with mcsanc-v1.01,
arXiv:1301.3687 [hep-ph].[26] J. Alwall et al., MadGraph 5: Going Beyond, JHEP
128(2011) 1106.
[27] U. Baur, Weak Boson Emission in Hadron Collider Processes, Phys. Rev.
D75(2007) 013005,
arXiv:hep-ph/0611241.[28] M. Aliev et al., – HATHOR – HAdronic Top and Heavy quarks crOss section calculatoR, Comput. Phys. Commun.
182(2011) 1034–1046.
[29] A. D. Martin, R. G. Roberts, W. J. Stirling, and R. S. Thorne, Uncertainties on alpha S in global PDF analyses and implications for predicted hadronic cross sections, Eur. Phys. J.
C64(2009) 653–680,
arXiv:hep-ph/09053531.[30] M. Cacciari et al., Top-pair production at hadron colliders with next-to-next-to-leading logarithmic soft-gluon resummation, Phys. Lett.
B710(2012) 612–622.
[31] M. Czakon and A. Mitov, Top++: a program for the calculation of the top-pair cross-section at hadron colliders,
arXiv:hep-ph/11125675.[32] ATLAS Collaboration, Search for dilepton resonances in pp collisions at
√s
=7 TeV with the ATLAS detector, Phys. Rev. Lett.
107(2011) 272002.
[33] R. D. Ball, V. Bertone, S. Carrazza, C. S. Deans, L. Del Debbio, S. Forte, A. Guffanti and N. P.
Hartland et al., Parton distributions with LHC data, Nucl. Phys.
B867(2012) 244.
[34] S. Alekhin, J. Blumlein and S. Moch, Parton distribution functions and benchmark cross sections at NNLO, Phys. Rev.
D86(2012) 054009.
[35] F.D. Aaron et al., H1 and ZEUS Collaborations, Combined Measurement and QCD Analysis of the Inclusive ep Scattering Cross Sections at HERA, JHEP
1001(2010) 109.
[36] A. Caldwell, D. Kollar, and K. Kr¨oninger, BAT - The Bayesian Analysis Toolkit,
Comput. Phys. Commun.
180(2009) 2197.
9 Appendix: Additional public material
Events
10
-210
-11 10 10
210
310
410
510
610
7Data 2012 γ* Z/
t t Diboson Z’(1500 GeV) Z’(2500 GeV)
Preliminary ATLAS
(loose) Search µ
µ
→ Z’
L dt = 20 fb
-1∫ s = 8 TeV
[GeV]
µ
mµ
100 200 300 400 1000 2000 3000
Observed / Expected
0.6 0.8 1 1.2 1.4
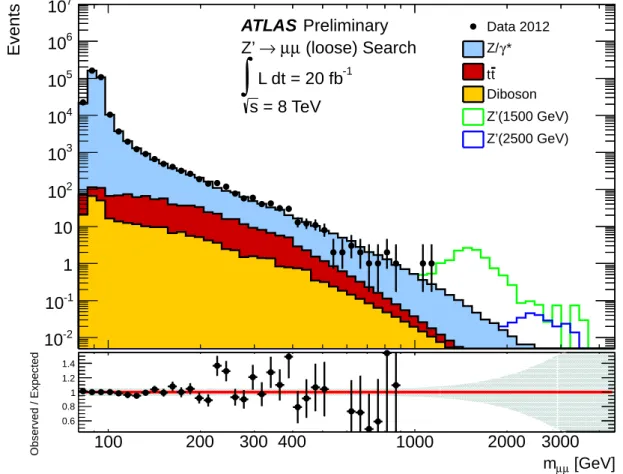
Figure 7: Dimuon invariant mass (m
µµ) distribution after loose dimuon selection requirements with sta- tistical uncertainties after final selection, compared to the stacked sum of all expected backgrounds, with two selected Z
SSM′signals overlaid. The bin width is constant in log m
µµ. Bottom inset: The black points show the ratio of observed to expected events with statistical uncertainty, while the shaded band indicates the mass-dependent systematic uncertainty on the sum of the backgrounds.
Table 7: The expected and observed number of events in the dimuon channel with loose selection. The region 80-110 GeV is used to normalize the total background to the data. The errors quoted include both statistical and systematic uncertainties.
m
µµ[GeV] 110 - 200 200 - 400 400 - 800 800 - 1200 1200 - 3000 3000 - 4500 Z/γ
∗6900
±900 640
±160 62
±20 3.6
±1.2 0.58
±0.25 0.005
±0.005 tt 400
±110 120
±70 8
±4 0
.16
±0
.25 0
.010
±0
.024
<0
.001 Diboson 82
±19 22
±12 3
.0
±2
.6 0
.15
±0
.17 0
.02
±0
.05
<0
.001 Total 7400
±900 780
±180 73
±20 3
.9
±1
.2 0
.62
±0
.26 0
.005
±0
.006
Data 7112 799 58 4 0 0
Events
10
-210
-11 10 10
210
310
410
510
610
7Data 2012 γ* Z/
t t
Dijet & W+Jets Diboson
G* (1000 GeV) x10 G* (2000 GeV) x100
=0.01 MPL
k/
Preliminary ATLAS
ee Search
→ G*
L dt = 20 fb
-1∫ s = 8 TeV
[GeV]
mee
100 200 300 400 1000 2000 3000
Observed / Expected
0.6 0.8 1 1.2 1.4
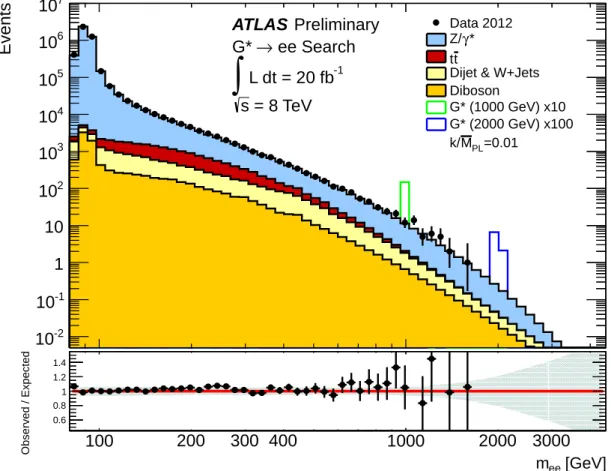
Figure 8: Dielectron invariant mass (m
ee) distribution after dielectron selection with statistical uncer-
tainties after final selection, compared to the stacked sum of all expected backgrounds, with two selected
graviton (G
∗) signals overlaid. The bin width is constant in log m
ee. Bottom inset: The black points show
the ratio of observed to expected events with statistical uncertainty, while the shaded band indicates the
mass-dependent systematic uncertainty on the sum of the backgrounds.
Events
10
-210
-11 10 10
210
310
410
510
610
7Data 2012 γ* Z/
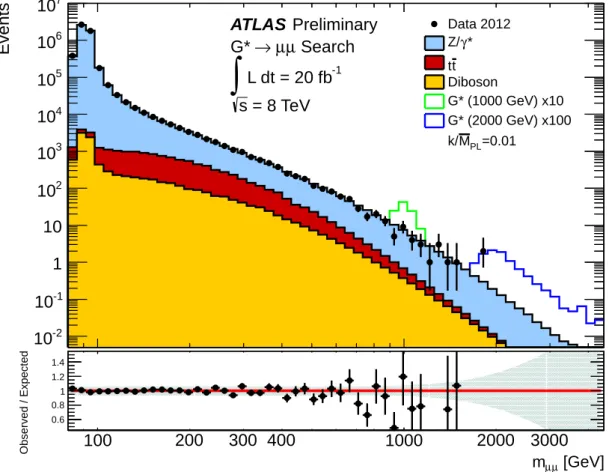
t t Diboson
G* (1000 GeV) x10 G* (2000 GeV) x100
=0.01 MPL
k/
Preliminary ATLAS
Search µ
µ
→ G*
L dt = 20 fb
-1∫ s = 8 TeV
[GeV]
µ
mµ
100 200 300 400 1000 2000 3000
Observed / Expected
0.6 0.8 1 1.2 1.4