A TLAS-CONF-2019-001 26 Febr uary 2019
ATLAS CONF Note
ATLAS-CONF-2019-001
26th February 2019
Search for high-mass dilepton resonances using 139 fb √ − 1 of p p collision data collected at
s = 13 TeV with the ATLAS detector
The ATLAS Collaboration
A search for high-mass dielectron and dimuon resonances in the mass range of 250 GeV to 6 TeV is presented. The data were recorded by the ATLAS experiment in proton–proton collisions at a centre-of-mass energy of
√ s = 13 TeV during Run 2 of the Large Hadron
Collider and correspond to an integrated luminosity of 139 fb
−1. A functional form is fitted to
the dilepton invariant-mass distribution to model the contribution from background processes,
and a generic signal shape is used to determine the significance of observed deviations from
this background estimate. No significant deviation is observed and upper limits are placed
at the 95% confidence level on the fiducial cross-section times branching ratio for various
resonance width hypotheses. The derived limits are shown to be applicable to spin-0, spin-1
and spin-2 signal hypotheses. For a set of benchmark models, the limits are converted into
lower limits on the resonance mass and reach 4.5 TeV for the E
6-motivated Z
ψ0boson. Also
presented are limits on Heavy Vector Triplet model couplings.
1 Introduction
Searches in the dilepton (dielectron and dimuon) final state have a long and illustrious history with the discovery of the J/ψ meson in 1974 [1, 2] and Υ meson in 1977 [3] as well as the Z boson in 1983 [4, 5].
As these were key steps which led to the establishment of the Standard Model (SM) of particle physics, the study of the same final state could help to pave the way to a more complete understanding of the physics processes beyond it.
Various models predict resonances which decay into dileptons and can be categorised according to their spin. A new high-mass spin-0 resonance, H , introduced as part of an extended scalar sector in some models, such as the Minimal Supersymmetric SM (MSSM) [6], would decay preferentially into a pair of muons rather than electrons. The majority of searches for new neutral high-mass resonances have focused on a new spin-1 vector boson, generally referred to as Z
0, that appears in models with extended gauge symmetries. Typical benchmark models include the Sequential Standard Model Z
0SSM
boson [7], which has the same fermion couplings as the SM Z boson, a Z
χ0and a Z
ψ0boson of an E
6-motivated Grand Unification model [8], or a Z
0HVT
boson of the Heavy Vector Triplet model [9]. In the first two models, the Z
0boson is a singlet, associated with a new U(1) gauge group, and generally its couplings to the SM W and Z bosons are assumed to be zero. The Z
0HVT
boson is a neutral member of a new SU(2) gauge group, e.g. part of a triplet and cannot exist without two new charged heavy bosons, W
0±HVT
, with which it is nearly degenerate in mass. New spin-2 resonances, excited states of the graviton, are introduced in the Randall–Sundrum model [10] with a warped extra dimension. In experimental terms the described scenarios would result in a local excess of signal candidates over a smoothly falling dilepton mass spectrum. This search has a clean experimental signature with a fully reconstructable final state and excellent detection efficiency.
This Letter presents a search for a new resonance decaying into two electrons or two muons in 139 fb
−1of data collected in proton–proton ( pp ) collisions at the LHC at a centre-of-mass energy
√ s = 13 TeV.
Previous searches with 36.1 fb
−1of pp collision data at
√ s = 13 TeV conducted by the ATLAS and CMS experiments [11, 12] showed no significant excess and led to lower limits of up to 3.8 TeV for the mass of the Z
ψ0boson. The analysis presented in this Letter, compared with that published in Ref. [11], benefits from:
a factor of four increase in integrated luminosity; several improvements in the reconstruction software, including the use of a new dynamical, topological cell-clustering algorithm for electron reconstruction [13]
and an improved treatment of relative misalignments between the inner tracker and the muon tracking detectors in the muon reconstruction; the use of invariant-mass sidebands of the expected signal in data to constrain the fit parameters of the background distribution, which is described by a smooth functional form instead of relying on simulation; and a generic signal line shape described by a non-relativistic Breit–Wigner function convolved with the detector resolution, which simplifies reinterpretations of the result.
2 ATLAS detector
ATLAS [14, 15] is a multipurpose detector with a forward–backward symmetric cylindrical geometry with respect to the LHC beam axis.1 The innermost layers consist of tracking detectors in the pseudorapidity
1
ATLAS uses a right-handed coordinate system with its origin at the nominal interaction point (IP) in the centre of the detector
and the z -axis along the beam pipe. The x -axis points from the IP to the centre of the LHC ring, and the y -axis points
upwards. Cylindrical coordinates (r, φ) are used in the transverse plane, φ being the azimuthal angle around the z -axis.
range |η| < 2 . 5. This inner detector (ID) is surrounded by a thin superconducting solenoid that provides a 2 T axial magnetic field. It is enclosed by the electromagnetic and hadronic calorimeters, which cover
|η | < 4 . 9. The outermost layers of ATLAS consist of an external muon spectrometer (MS) within
|η | < 2 . 7, incorporating three large toroidal magnetic assemblies with eight coils each. The field integral of the toroids ranges between 2.0 and 6.0 Tm for most of the acceptance. The MS includes a system of precision tracking chambers and fast detectors for triggering. A two-level trigger system [16] reduces the recorded event rate to an average of 1 kHz.
3 Data and simulation
The dataset used in this analysis was collected during LHC Run 2 in stable beam conditions and with all detector systems operating normally. The event quality was checked to remove events with noise bursts or coherent noise in the calorimeters. Events in the dielectron channel were recorded using a dielectron trigger based on the ‘very loose’ or ‘loose’ identification criteria [16] with transverse energy ( E
T) thresholds between 12 and 24 GeV for both electrons, depending on the data-taking period. Events in the dimuon channel are required to pass at least one of two single-muon triggers: the first requires a transverse momentum ( p
T) of at least 50 GeV, while the second has a threshold lowered to 26 GeV but requires the muon candidate to be isolated [16]. The integrated luminosity of the dataset is determined to be 139 ± 2 fb
−1, following a methodology similar to that detailed in Ref. [17].
While the search in this analysis is carried out entirely in a data-driven way, simulated event samples for the signal and background processes are used to determine appropriate functions to fit the data, study background compositions and to evaluate the signal efficiency. The main backgrounds (in decreasing order of importance) are Drell–Yan (DY), top-quark pair ( t¯ t ), single-top-quark and diboson production.
Multi-jet and W +jets processes in the dielectron channel are estimated with a data-driven method [11].
Multi-jet and W +jets processes in the dimuon channel as well as processes with τ -leptons in both channels have a negligible impact and are not considered. The Monte Carlo (MC) event generators for the hard- scatter process, showering and parton distribution functions (PDFs) are listed in Table 1. The ‘afterburner’
generators such as Photos [18] for the final-state photon radiation (FSR) modelling, MadSpin [19] to preserve top-quark spin correlations, and EvtGen [20], used for the modelling of c - and b -hadron decays, are also reported.
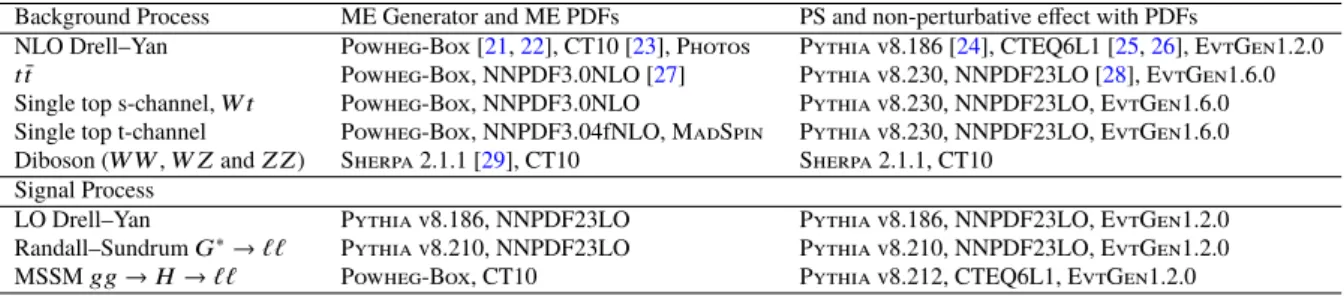
Table 1: The event generators used for simulation of the signal and background processes. The acronyms ME and PS stand for matrix element and parton shower. The top-quark mass is set to 172.5 GeV.
Background Process ME Generator and ME PDFs PS and non-perturbative effect with PDFs
NLO Drell–Yan Powheg-Box [21,22], CT10 [23], Photos Pythia v8.186 [24], CTEQ6L1 [25,26], EvtGen1.2.0 tt¯ Powheg-Box, NNPDF3.0NLO [27] Pythia v8.230, NNPDF23LO [28], EvtGen1.6.0 Single top s-channel,W t Powheg-Box, NNPDF3.0NLO Pythia v8.230, NNPDF23LO, EvtGen1.6.0 Single top t-channel Powheg-Box, NNPDF3.04fNLO, MadSpin Pythia v8.230, NNPDF23LO, EvtGen1.6.0 Diboson (W W,W ZandZ Z) Sherpa 2.1.1 [29], CT10 Sherpa 2.1.1, CT10
Signal Process
LO Drell–Yan Pythia v8.186, NNPDF23LO Pythia v8.186, NNPDF23LO, EvtGen1.2.0 Randall–SundrumG∗→`` Pythia v8.210, NNPDF23LO Pythia v8.210, NNPDF23LO, EvtGen1.2.0 MSSMgg→H→`` Powheg-Box, CT10 Pythia v8.212, CTEQ6L1, EvtGen1.2.0
The pseudorapidity is defined in terms of the polar angle θ as η = − ln tan (θ/ 2 ) . Angular distance is measured in units of
∆R ≡ q
(∆ η)
2+ (∆ φ)
2.
The DY [30] and diboson [31] samples were generated in slices of dilepton mass to increase the sample size in the high-mass region. Next-to-next-to-leading-order (NNLO) corrections in quantum chromodynamic (QCD) theory and next-to-leading-order (NLO) corrections (including photon-induced contributions) in electroweak (EW) theory, are calculated and applied to the DY events as described in Ref. [11]. The top-quark samples [32] are normalised to the cross-sections calculated at NNLO in QCD including resummation of the next-to-next-to-leading logarithmic soft gluon terms as provided by Top++2.0 [33].
Spin-1 signal templates are obtained by a matrix-element reweighting [11] of the leading-order (LO) DY samples generated in slices of dilepton mass. They are used only for cross-section and efficiency calculations. The relative natural width ( Γ
Z0/m
Z0) for the benchmark models considered varies between 0.5% for Z
ψ0and 3% for Z
0SSM
. Interference effects between the resonant signal and the background processes are neglected. Higher-order QCD corrections for all the spin-1 signals are computed with the same methodology as for the DY background [11]. For the HVT model, these corrections are not applied, which ensures consistent treatment with the other signal channels in an eventual combination, similar to that described in Ref. [34]. Electroweak corrections are not applied to the signal samples due to their large model dependence. Spin-0 signal efficiencies are obtained from samples of the MSSM gluon–gluon fusion production of a heavy Higgs boson decaying into dilepton pairs, gg → H → `` , produced in the mass range m
H= 400–1000 GeV and with relative natural width ( Γ
H/m
H) varying between zero and 20%. Spin-2 signal efficiencies are obtained from Randall–Sundrum graviton G
∗→ `` samples produced in the mass range m
G∗= 750–5000 GeV and with coupling strengths, k/m
Pl, of 0.1, 0.2 and 0.3, where k is a scale that defines the warp factor of the extra dimension and m
Plis the reduced Planck mass.
Simulated event samples include the effect of multiple pp interactions in the same or neighbouring bunch crossings. These effects are collectively referred to as pile-up. The simulation of pile-up collisions was performed with Pythia v8 and weighted to reproduce the average number of pile-up interactions per bunch crossing observed in data. The generated events were passed through a full detector simulation [35]
based on Geant 4 [36]. Spin-0 and spin-2 MC signal samples were produced with a fast parameterisation of the calorimeter response [37].
Very large generator-level-only MC samples for NLO DY events are used for the background studies described in Section 6. These samples could not be produced with the full detector simulation due to the large number of events required.
4 Event selection
The selection of dilepton events closely follows that described in Ref. [11]. An event is selected if at least one pp interaction vertex is reconstructed. The primary vertex is chosen to be the vertex with the highest summed p
2T
of tracks with transverse momentum p
T> 0 . 5 GeV which are associated with the vertex.
Electron candidates are reconstructed from ID tracks that are matched to clusters of energy deposited in the electromagnetic calorimeter with energy deposition consistent with that of an electromagnetic shower [38].
Reconstructed electrons must have E
T> 30 GeV, satisfy |η | < 2 . 47 in order to pass through the fine-
granularity region of the EM calorimeter, and be outside the range 1 . 37 < |η| < 1 . 52 corresponding to
the transition region between the barrel and endcap EM calorimeters. The calorimeter granularity in the
excluded transition region is reduced, and the presence of significant additional inactive material degrades
the electron identification capabilities and energy resolution. The ‘medium’ electron working point used
for the final selection has an identification and reconstruction efficiency for prompt electrons above 92%
for E
T> 80 GeV.
Muon candidates are identified by matching ID tracks to tracks reconstructed in the MS [39]. Muon candidates must have p
T> 30 GeV and |η | < 2 . 5. To ensure optimal muon momentum resolution at high p
T, the ‘high p
T’ identification working point is used. It requires at least three hits in each of three layers of precision tracking chambers in the MS, and specific regions of the MS where the alignment is suboptimal are vetoed as a precaution. These requirements reject about 80% (13%) of the muon candidates in (outside) the barrel–endcap overlap region, 1 . 01 < |η | < 1 . 1. The muon ‘high p
T’ working point has an η -averaged efficiency of 69% at 1 TeV which decreases to 64% at 2.5 TeV. Additionally, a ‘good muon’
selection requires that the uncertainty in the charge-to-momentum ratio of muon candidates is less than a p
T-dependent value. This selection is fully efficient below 1 TeV, but introduces an additional inefficiency of 7% at 2.5 TeV.
Electron (muon) candidate tracks must be consistent with the primary vertex both along the beamline, where the longitudinal impact parameter z
0is required to satisfy |z
0sin θ| < 0 . 5 mm, and in the transverse plane, where the transverse impact parameter significance |d
0/σ (d
0) | is required to be less than 5 (3).
To reduce background from misidentified jets as well as from light- and heavy-flavour hadron decays inside jets, lepton candidates are required to be isolated. Electrons must pass the ‘gradient’ isolation working point which targets an E
T-dependent value of the isolation efficiency, uniform in η , using a combination of track and calorimeter isolation requirements [38]. For muons, the summed scalar p
Tof good-quality tracks with p
T> 1 GeV originating from the primary vertex within a cone of variable size
∆R = min ( 10 GeV/ p
T[GeV], 0 . 3 ) around the muon, but excluding the muon-candidate track itself, must be less than 6% of the p
Tof the muon candidate. The efficiency of this selection is above 99% for both electrons and muons with p
T> 60 GeV. Corrections are applied to electron (muon) candidates to match the efficiency, energy (momentum) scale and resolution between simulation and data [39, 40].
The events are required to contain at least two same-flavour leptons. If additional leptons are present in the event, the two same-flavour leptons with the largest E
T( p
T) in the electron (muon) channel are selected to form the dilepton pair. If two different-flavour pairs are found, the dielectron pair is kept, because of the better resolution and higher efficiency for electrons. A selected muon pair is required to be oppositely charged. For an electron pair, the opposite-charge requirement is not applied because of the higher probability of charge misidentification for high- E
Telectrons. The reconstructed mass of the dilepton system after the full analysis selection, m
``, is required to be above 225 GeV to avoid the Z boson peak region, which cannot be described by the same parameterisation as the high-mass part of the dilepton distributions.
5 Reconstructed dilepton mass modelling
The relative dilepton mass resolution is defined as (m
``− m
true``)/m
true``, where m
``trueis the generated dilepton
mass at Born level before FSR. The mass resolution is parameterised as a sum of a Gaussian distribution,
which describes the detector response, and a Crystal Ball function composed of a secondary Gaussian
distribution with a power-law low-mass tail, which accounts for bremsstrahlung effects in the dielectron
channel or for the effect of poorly reconstructed muons. The parameterisation of the relative dilepton
mass resolution as a function of mass is determined by a simultaneous fit of the function described above
to DY MC events. The MC sample is separated in 200 m
true``bins of equal size on a logarithmic scale in
the range of 130 GeV to 6 TeV. This procedure is repeated to evaluate the uncertainty of the fit parameters due to the uncertainty in the lepton energy and momentum scale and resolutions.
6 Signal and background modelling
A resonant signal is searched for by fitting the data dilepton mass distribution. The fit function consists of a smooth functional form for the background, and a generic signal shape. The generic signal shapes are constructed from non-relativistic Breit–Wigner functions of various widths convolved with the detector resolution, obtained as described in the previous section. The dilepton mass line shape for a signal resonance with intrinsic width that is negligible compared with the detector resolution (zero-width signal) is obtained from the mass resolution only.
To allow for a generic resonance search, a fiducial region at particle level is defined following the selection criteria applied to the reconstructed lepton candidates: each electron and muon candidate needs to pass
|η | < 2 . 5 and E
T( p
T) > 30 GeV, and the dilepton mass has to satisfy m
true``> m
X− 2 Γ
X, where m
Xand Γ
Xrepresent the pole mass and width of a hypothetical resonance X , respectively. This selection is added in order to reduce the model dependence from off-shell effects.
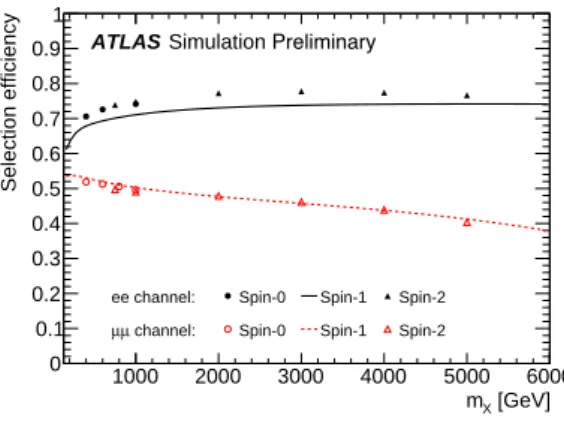
The nominal combined reconstruction and identification efficiency in the fiducial region is extracted from the DY sample and thus assumes the kinematics of a spin-1 boson. For the dielectron (dimuon) channels, it varies from 64% (54%) at 225 GeV to 74% (38%) at 6 TeV for the zero-width signals. For a spin-1 signal with 10% relative width, the efficiency changes by less than 0 . 5% relative to a signal with zero width for both channels over most of the considered invariant-mass range. Only above 5 TeV in the dimuon channel are the variations as large as 2% in absolute efficiency. For the spin-0 and spin-2 samples, width-related variations are below 1%. For the dielectron channel, spin-0 and spin-2 efficiencies are higher than the corresponding spin-1 values by at most 4%. For the dimuon channel, efficiencies for spin-0 and spin-2 signals are at most 1% lower than the corresponding spin-1 values. The systematic uncertainties of the overall efficiency are due to the uncertainties in the trigger, isolation, identification, and reconstruction efficiencies.
The smooth functional form for the background is based on fit performance studies on a MC background template. The associated uncertainties are also estimated through these studies. In order to minimise the statistical uncertainties in this procedure, the background template for DY is produced from large-statistics samples simulated only at generator level and smeared by the experimental dilepton mass resolution, described in the previous section, with mass-dependent acceptance and efficiency corrections applied. A similar procedure is applied to the generator-level dilepton mass distribution in a t t ¯ sample exploiting the larger number of events from the generator-level mass distribution. The distributions from the diboson and single-top simulated samples and, in the electron channel, a template for multi-jet and W +jet processes are also considered. All MC-based contributions are scaled by their respective cross-sections.
In order to select the background functional form, a fit to the dilepton mass background template is performed, under the signal plus background hypothesis, for various functional forms, following the procedure outlined in Ref. [41]. The chosen functional form is the one with the smallest absolute number of fitted signal events (‘spurious signal’), which are determined as as a function of m
``:
f
``(m
``) = a · f
BW,Z(m
``) · 1 − x
cb· x
P3i=0pilog(x)i, (1)
where x = m
``/ √
s and a , b and p
iwith i = 0 , .. 3 are left free in the fit to data and independent for dielectron and dimuon channels. The parameter c is 1 for the dielectron and 1 / 3 for the dimuon channel. The function f
BW,Z(m
``) is a non-relativistic Breit–Wigner function with m
Z= 91 . 1876 GeV and Γ
Z= 2 . 4952 GeV [42]. To further validate this functional form an extra degree of freedom ( i = 4) is added to the fit function before the final data analysis, to check if it improves the likelihood value of the fit by more than 2 σ . To check the fit stability in the high-mass region, signal injection tests are performed at various mass points. No significant bias in the number of extracted signal events is observed.
Uncertainties related to the background modelling are propagated into the determination of the spurious signal. Smooth templates for systematic shape uncertainties are produced using the same procedure as for the nominal templates. The uncertainties considered include variations due to PDFs, normalisation of the t t ¯ background component and systematic variations of the multi-jet and W +jet background contributions in the dielectron channel. For the selected function, the largest spurious signal (accounting for all systematic variations) is required to be less than 30% of the statistical uncertainty in the fitted signal yield (from the background distribution) for the zero-width signal. This criterion is relaxed to 50% for signals of wider width. The systematic uncertainty of the background estimate is mass dependent and corresponds to a functional interpolation between the highest maxima among the spurious-signal-yield distributions for all systematic variations. The spurious-signal yield is calculated independently for the relative signal width assumptions between zero and 10% in steps of 0 . 5%.
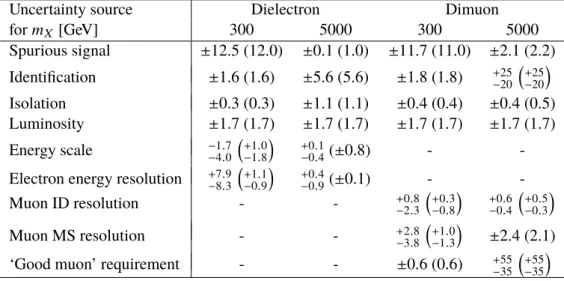
The impact of systematic uncertainties on the signal yield is shown in Table 2. Only systematic uncertain- ties which change the signal yield by more than 0.5% at any point in the mass spectrum are considered.
The largest systematic uncertainty at low mass in both channels originates from the spurious signals. The largest systematic uncertainty in the dielectron channel at high mass originates from the electron identific- ation efficiency. The uncertainty associated with the ‘good muon’ requirement is dominant in the dimuon channel at high mass. This uncertainty is estimated with a conservative approach in a dataset collected in 2015–2016, corresponding to 36 fb
−1, by comparing efficiencies obtained in data and in simulation.
Table 2: The relative impact of ± 1 σ variation of systematic uncertainties on the signal yield in percent for zero (10%) relative width signals at the pole masses of 300 GeV and 5 TeV for dielectron and dimuon channels. A signal is injected at the cross-section limit.
Uncertainty source Dielectron Dimuon
for m
X[GeV] 300 5000 300 5000
Spurious signal ± 12.5 (12.0) ± 0.1 (1.0) ± 11.7 (11.0) ± 2.1 (2.2) Identification ± 1.6 (1.6) ± 5.6 (5.6) ± 1.8 (1.8)
+25−20 +25−20
Isolation ± 0.3 (0.3) ± 1.1 (1.1) ± 0.4 (0.4) ± 0.4 (0.5) Luminosity ± 1.7 (1.7) ± 1.7 (1.7) ± 1.7 (1.7) ± 1.7 (1.7) Energy scale
−−14..70 +1.−1.08
+0.−0.14
( ± 0.8) - -
Electron energy resolution
+7−8..93 +1.−0.19
+0.−0.49
( ± 0.1) - -
Muon ID resolution - -
+0−2..83 +0.−0.38
+0.−0.64
+0.−0.53
Muon MS resolution - -
+2−3..88 +1.−1.03
± 2.4 (2.1)
‘Good muon’ requirement - - ± 0.6 (0.6)
+55−35 +55−35
7 Statistical analysis
The number of signal and background events, as a function of the signal mass and width hypothesis, are estimated from simultaneous maximum-likelihood fits of the signal-plus-background models to the data m
``distribution. Systematic uncertainties are included in the fits via nuisance parameters constrained by penalty terms which are either Gaussian (e.g. energy and momentum scale uncertainties) or log- normal (efficiency and resolution uncertainties). Potential mismodelling of the background estimate is accounted for through an additional nuisance parameter allowing non-zero signal normalisation under the null hypothesis constrained by the measured spurious signal. Dielectron and dimuon channels are considered both as independent channels and in a combined approach, under a lepton-flavour universality assumption [7, 8].
The significance of a signal is summarised by a p -value, the probability of observing an excess at least as signal-like as the one observed in data, in the absence of signal. The local p -value of the background-only hypothesis ( p
0) is determined from a profile-likelihood-ratio-test statistic [43] as detailed in Ref. [44] in the asymptotic approximation. Global significance values are also computed in the asymptotic approximation to account for the trial factors due to scanning the signal mass hypothesis [45]. Upper limits at the 95%
confidence level (CL) are set on the fiducial cross-section times the branching ratio into the corresponding dilepton final state, given the integrated luminosity of the data and the signal efficiency. The limits are evaluated with a modified frequentist method CL
S[46] with the asymptotic approximation to the test- statistic distribution [43]. Cross-checks with sampling distributions generated using pseudo-experiments are used to test the accuracy of this approximation for the high-mass part of the dilepton spectra. The approximation is found to lead to limits that are stronger than those obtained with pseudo-experiments above 3 TeV. This effect reaches 25% (35%) at 5 TeV (6 TeV) for the combined dilepton channel. The corresponding impact on the mass limits is below 100 GeV.
8 Results
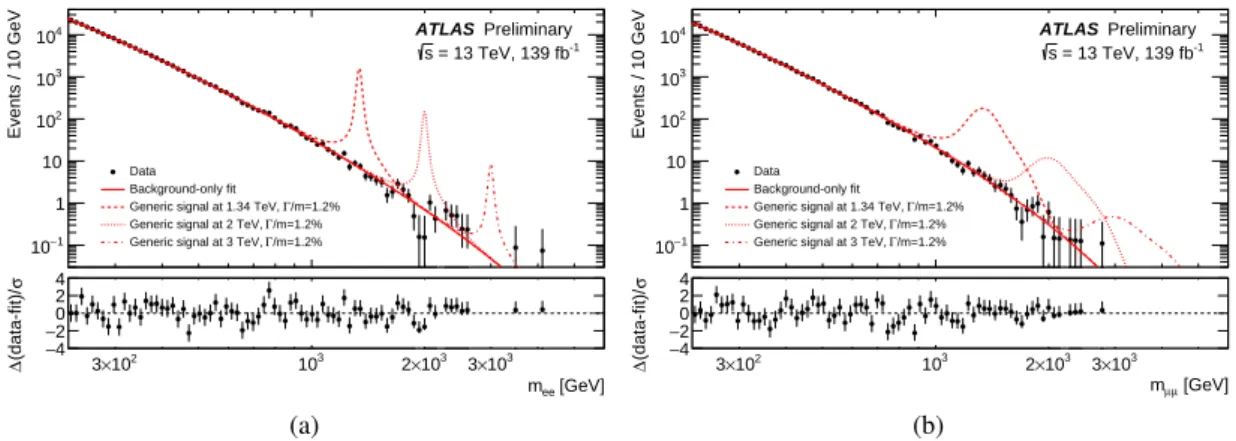
The dilepton invariant-mass distributions for the events that pass the full analysis selection are shown in Figure 1. The event with highest reconstructed mass is a dielectron candidate with m
ee= 4 . 06 TeV, formed of two electrons with E
T= 2 . 01 TeV and E
T= 1 . 92 TeV in the barrel region of the calorimeter.
The event with highest reconstructed mass in the dimuon channel has an invariant mass of m
µµ= 2 . 75 TeV.
Both muon candidates are in the barrel section of the muon spectrometer and their transverse momenta are p
T= 1 . 82 TeV and p
T= 1 . 04 TeV.
The fit to data is performed in bins of 1 GeV and uses the function in Eq. (1). The resulting fit parameters are given in Ref. [47]. In both channels, validation tests using the extension of the functional form described in Section 6 did not yield any significant improvement, so the function in Eq. (1) is used without modification.
The probability that the data is compatible with the background-only hypothesis is shown in Figure 2 as
a function of pole mass for zero-width signals. No significant excess is observed. The largest deviations
from the background-only hypothesis in the dielectron, dimuon and combined dilepton channels are
observed at masses of 774 GeV, 267 GeV and 264 GeV with a local p
0of 2.9 σ , 2.4 σ and 2.3 σ and a
global significance of 0 . 1 σ , 0 . 3 σ , and zero, respectively, for zero-width signals.
103 mee [GeV]
−1
10 1 10 102
103
104
Events / 10 GeV
ATLAS Preliminary = 13 TeV, 139 fb-1
s
Data Background-only fit
/m=1.2%
Γ Generic signal at 1.34 TeV,
/m=1.2%
Γ Generic signal at 2 TeV,
/m=1.2%
Γ Generic signal at 3 TeV,
102
×
3 103 2×10³ 3×10³
[GeV]
mee
−42
−0 2 (data-fit)/∆σ 4
(a)
103 mµµ [GeV]
−1
10 1 10 102
103
104
Events / 10 GeV
ATLAS Preliminary = 13 TeV, 139 fb-1
s
Data Background-only fit
/m=1.2%
Γ Generic signal at 1.34 TeV,
/m=1.2%
Γ Generic signal at 2 TeV,
/m=1.2%
Γ Generic signal at 3 TeV,
102
×
3 103 2×10³ 3×10³
[GeV]
µ
mµ
−42
−0 2 (data-fit)/∆σ 4
(b)
Figure 1: Distribution of the (a) dielectron and (b) dimuon invariant mass for events passing the full selection.
Generic signal shapes (scaled to the cross-section of Z
χ0in the fiducial region) with pole masses of m
X=1.34, 2 and 3 TeV and a relative width of 1 . 2% and background-only fits are superimposed. The data points are plotted at the centre of each bin. The error bars indicate statistical uncertainties only. The differences between the data and the fit results in units of standard deviations of the statistical uncertainty are shown in the bottom panels.
102
×
3 103 2×10³ 3×10³
[GeV]
mX
−5
−4
−3
−2
−1 0 1 2 3 4 ]σ Local significance [ 5
ee channel channel µ µ ll channel
= 13 TeV, 139 fb-1
ATLAS Preliminary s 0-width resonance
Figure 2: Probability that the observed spectrum is compatible with the background-only hypothesis for the dielectron,
dimuon and combined dilepton channels. The local p
0is quantified in standard deviations σ as a function of pole
mass m
X.
1000 2000 3000 4000 5000 6000 [GeV]
mX
−3
10
−2
10
−1
10 1 B [fb]×σfid 10
ATLAS Preliminary = 13 TeV, 139 fb-1
s
→ ll
X
/m = 0%
Γ Observed limit at
/m = 0%
Γ Expected limit at
/m = 3% (obs.) Γ
/m = 3% (exp.) Γ
/m = 10% (obs.) Γ
/m = 10% (exp.)
Γ Z'SSM model
(a)
1000 2000 3000 4000 5000 6000
[GeV]
mX
−3
10
−2
10
−1
10 1 B [fb]×σfid 10
ATLAS Preliminary = 13 TeV, 139 fb-1
s
→ ll
X
/m = 0.5%
Γ Observed limit at
/m = 0.5%
Γ Expected limit at
/m = 1.2% (obs.) Γ
/m = 1.2% (exp.) Γ
/m = 6% (obs.) Γ
/m = 6% (exp.) Γ
model Z'ψ
model Z'χ
(b)
Figure 3: Upper limits at 95% CL on the fiducial cross-section times branching ratio as a function of pole mass for (a) the zero-width, 3%, 10% and (b) 0.5%, 1.2%, 6% relative width signals for the combined dilepton channel.
Observed limits are shown as a solid line and expected limits as a dashed line. Also shown are theoretical cross- sections for Z
ψ0( Γ/m = 0 . 5%), Z
0χ( Γ/m = 1 . 2%) and Z
0SSM
( Γ/m = 3 . 0%) in the fiducial region. The signal theoretical uncertainties are shown as a band on the Z
0SSM
theory line and are derived as in Ref. [11]. They are shown for illustration purposes, but are not included in the limit calculation.
Figure 3 shows the upper limits on the fiducial cross-section times branching ratio to two electrons and two muons for generic resonances of various relative widths as a function of their mass. The observed limits for pole masses ranging from 250 to 750 GeV are obtained with a spacing of 1 GeV. The granularity is reduced above that mass, but remains below the experimental resolution of the ee channel. Since the expected limits have less fluctuations, the chosen spacing is a factor of 10 coarser. The observed limit on the fiducial cross-section times branching ratio ranges from 3.6 (13.1) fb at 250 GeV to about 0.014 (0.018) fb at 6 TeV for the zero (10%) relative width signal in the combined dilepton channel. The impact of systematic uncertainties on this search is small across all mass and width assumptions, resulting in the expected limits on the fiducial cross-section times branching ratio to dileptons being (4–7)% weaker than those without systematic uncertainties. As various signal spin hypotheses (0, 1, 2) have efficiency values which are consistent within 4%, these limits can be used for reinterpretation of models with such new resonances.
Table 3: Observed and expected 95% CL lower limits on m
Z0for three Z
0gauge boson models, quoted to the nearest 100 GeV.
Lower limits on m
Z0[TeV]
Model ee µµ ``
obs exp obs exp obs exp Z
ψ04 . 3 4 . 3 4 . 0 3 . 8 4 . 5 4 . 5 Z
χ04 . 6 4 . 6 4 . 2 4 . 1 4 . 8 4 . 7 Z
0SSM
4 . 9 4 . 9 4 . 5 4 . 4 5 . 1 5 . 0
The generic cross-section limits at Γ/m = 0 . 5%, 1 . 2% and 3 . 0% are compared with the model predictions of Z
ψ0, Z
χ0and Z
0SSM
, respectively, to reinterpret them and obtain mass limits. The cross-section values
for the model predictions are obtained in the fiducial volume, for compatibility with the definition of the generic signal model. The mass limits are obtained by calculating the intersection between the expected and observed limits with the model prediction. Table 3 lists the mass limits for the three tested models in all three channels. These exceed previously reported results [11] by 500–800 GeV.
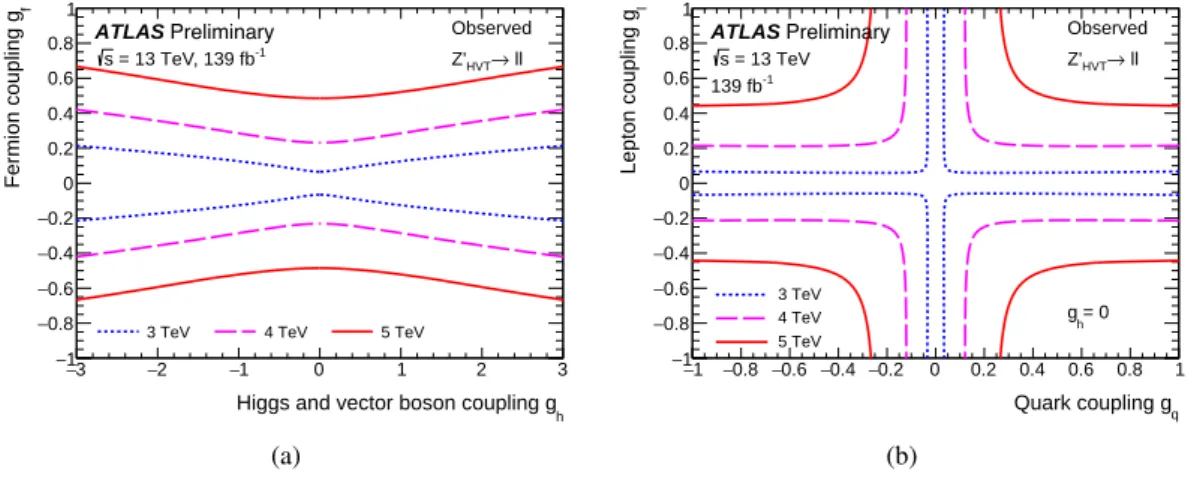
The generic cross-section limits shown in Figure 3 are smoothly interpolated via Delaunay triangula- tion [48] to produce limits in between the tested widths. The results are converted into exclusion contours in the HVT model coupling space presented in Figure 4, where g
`, g
qand g
hcorrespond to the coupling strengths between the triplet field and the lepton, quark and Higgs fields, respectively. In the tested {g
q, g
`} plane the relative width always remains below 10%, and in the {g
h, g
f} plane ( g
f≡ g
`= g
q) it only exceeds 10% in regions ( |g
f| > 0 . 9 and |g
h| > 2 . 5) well outside the limit contours. The observed limits can be compared with the limits obtained for the combination of the `` and `ν channels in Ref. [34]
(provided in brackets): for g
h= 0 and m
Z0HVT
= 3 TeV, 4 TeV and 5 TeV the |g
f| values above 0.07 (0.06), 0.23 (0.15) and 0.49 (0.42) are excluded at 95% CL, respectively. The resulting dilepton-only limits are slightly weaker than those for the `` and `ν channels combined, even with a nearly four times larger dataset, because of the higher W
0HVT
→ `ν cross-section in this model.
−3 −2 −1 0 1 2 3
Higgs and vector boson coupling gh
−1
−0.8
−0.6
−0.4
−0.2 0 0.2 0.4 0.6 0.8 Fermion coupling g f 1
3 TeV 4 TeV 5 TeV
ATLAS Preliminary = 13 TeV
s Z'HVT→ ll
Observed , 139 fb-1
(a)
−1 −0.8 −0.6 −0.4 −0.2 0 0.2 0.4 0.6 0.8 1 Quark coupling gq
−1
−0.8
−0.6
−0.4
−0.2 0 0.2 0.4 0.6 0.8 Lepton coupling gl 1
3 TeV 4 TeV 5 TeV ATLAS Preliminary
= 13 TeV
s Z'HVT→ ll
Observed
h= 0 g 139 fb-1
(b)
Figure 4: Observed 95% exclusion contours in the HVT parameter space (a) {g
h, g
f} with g
f≡ g
`= g
qand (b) {g
q, g
`} with g
hset to zero, for resonance masses of 3, 4, and 5 TeV for the dilepton channel. The area outside the curves is excluded.
9 Conclusions
In conclusion, the ATLAS detector at LHC is used to search for new resonances with mass larger than 250 GeV decaying into a pair of electrons or muons in 139 fb
−1of proton–proton collision data at a centre-of-mass energy
√ s = 13 TeV. A functional form is fitted to the dilepton invariant-mass distribution
in data events to model the contribution from background processes. A generic signal shape is used to
determine the significance of observed deviations from the background estimate. No significant deviation
is observed. Limits are set on the fiducial cross-section times branching ratio to dielectrons and dimuons
for generic resonances with a relative natural width in the range of zero to 10%. These limits are shown
to be applicable to spin-0, spin-1 and spin-2 signal hypotheses. Limits on the Heavy Vector Triplet model
couplings and on the masses of vector resonances are inferred. In particular, the results imply a lower limit
of 4 . 5 ( 5 . 1 ) TeV on m
Z0for the Z
ψ0( Z
0SSM
) boson at 95% confidence level. These are the most stringent limits to date.
References
[1] J. J. Aubert et al., Experimental Observation of a Heavy Particle J , Phys. Rev. Lett. 33 (1974) 1404,
url: http://link.aps.org/doi/10.1103/PhysRevLett.33.1404 . [2] J. E. Augustin et al., Discovery of a Narrow Resonance in e
+e
−Annihilation ,
Phys. Rev. Lett. 33 (1974) 1406,
url: http://link.aps.org/doi/10.1103/PhysRevLett.33.1406 . [3] S. W. Herb et al.,
Observation of a Dimuon Resonance at 9.5 GeV in 400-GeV Proton-Nucleus Collisions , Phys. Rev. Lett. 39 (1977) 252.
[4] G. Arnison et al., Experimental observation of lepton pairs of invariant mass around 95 GeV/c
2at the CERN SPS collider , Phys. Lett. B 126 (1983) 398, issn: 0370-2693,
url: http://www.sciencedirect.com/science/article/pii/0370269383901880 . [5] P. Bagnaia et al., Evidence for Z
0→ e
+e
−at the CERN pp collider , Phys. Lett. B 129 (1983) 130,
issn: 0370-2693,
url: http://www.sciencedirect.com/science/article/pii/037026938390744X . [6] A. Djouadi, The Anatomy of electro-weak symmetry breaking. II. The Higgs bosons in the minimal
supersymmetric model , Phys. Rept. 459 (2008) 1, arXiv: hep-ph/0503173 [hep-ph] .
[7] G. Altarelli, B. Mele and M. Ruiz-Altaba, Searching for new heavy vector bosons in p p ¯ colliders , Z. Phys. C 45 (1989) 109, [Erratum: Z. Phys. C 47 (1990) 676].
[8] D. London and J. L. Rosner, Extra gauge bosons in E(6) , Phys. Rev. D 34 (1986) 1530.
[9] F. del Aguila, J. de Blas and M. Perez-Victoria, Electroweak limits on general new vector bosons , JHEP 09 (2010) 033, arXiv: 1005.3998 [hep-ph] .
[10] L. Randall and R. Sundrum, Large Mass Hierarchy from a Small Extra Dimension , Phys. Rev. Lett. 83 (1999) 3370, arXiv: hep-ph/9905221 [hep-ph] .
[11] ATLAS Collaboration, Search for new high-mass phenomena in the dilepton final state using 36 fb
−1of proton–proton collision data at √
s = 13 TeV with the ATLAS detector , JHEP 10 (2017) 182, arXiv: 1707.02424 [hep-ex] .
[12] CMS Collaboration, Search for high-mass resonances in dilepton final states in proton–proton collisions at √
s = 13 TeV , JHEP 06 (2018) 120, arXiv: 1803.06292 [hep-ex] .
[13] ATLAS Collaboration, Electron and photon reconstruction and performance in ATLAS using a dynamical, topological cell clustering-based approach , ATL-PHYS-PUB-2017-022, 2017, url: https://cds.cern.ch/record/2298955 .
[14] ATLAS Collaboration, The ATLAS Experiment at the CERN Large Hadron Collider ,
JINST 3 (2008) S08003.
[15] ATLAS Collaboration, ATLAS Insertable B-Layer Technical Design Report , ATLAS-TDR-19, 2010, url: https://cds.cern.ch/record/1291633 ,
ATLAS Insertable B-Layer Technical Design Report Addendum , ATLAS-TDR-19-ADD-1, 2012,
URL
: https://cds.cern.ch/record/1451888 .
[16] ATLAS Collaboration, Performance of the ATLAS trigger system in 2015 , Eur. Phys. J. C 77 (2017) 317, arXiv: 1611.09661 [hep-ex] .
[17] ATLAS Collaboration,
Luminosity determination in pp collisions at √
s = 8 TeV using the ATLAS detector at the LHC , Eur. Phys. J. C 76 (2016) 653, arXiv: 1608.03953 [hep-ex] .
[18] P. Golonka and Z. Was,
PHOTOS Monte Carlo: A Precision tool for QED corrections in Z and W decays , Eur. Phys. J. C 45 (2006) 97, arXiv: hep-ph/0506026 [hep-ph] .
[19] P. Artoisenet, R. Frederix, O. Mattelaer and R. Rietkerk,
Automatic spin-entangled decays of heavy resonances in Monte Carlo simulations , JHEP 03 (2013) 015, arXiv: 1212.3460 [hep-ph] .
[20] D. J. Lange, The EvtGen particle decay simulation package , Nucl. Instrum. Meth. A 462 (2001) 152.
[21] S. Alioli, P. Nason, C. Oleari and E. Re, A general framework for implementing NLO calculations in shower Monte Carlo programs: the POWHEG BOX , JHEP 06 (2010) 043,
arXiv: 1002.2581 [hep-ph] . [22] S. Frixione, P. Nason and C. Oleari,
Matching NLO QCD computations with parton shower simulations: the POWHEG method , JHEP 11 (2007) 070, arXiv: 0709.2092 [hep-ph] .
[23] H.-L. Lai et al., New parton distributions for collider physics , Phys. Rev. D 82 (2010) 074024, arXiv: 1007.2241 [hep-ph] .
[24] T. Sjöstrand, S. Mrenna and P. Z. Skands, A brief introduction to PYTHIA 8.1 , Comput. Phys. Commun. 178 (2008) 852, arXiv: 0710.3820 [hep-ph] .
[25] ATLAS Collaboration, ATLAS Pythia 8 tunes to 7 TeV data , ATL-PHYS-PUB-2014-021, 2014, url: https://cds.cern.ch/record/1966419 .
[26] D. Stump et al., Inclusive jet production, parton distributions, and the search for new physics , JHEP 10 (2003) 046, arXiv: hep-ph/0303013 [hep-ph] .
[27] R. D. Ball et al., Parton distributions for the LHC Run II , JHEP 04 (2015) 040, arXiv: 1410.8849 [hep-ph] .
[28] R. D. Ball et al., Parton distributions with LHC data , Nucl. Phys. B 867 (2013) 244, arXiv: 1207.1303 [hep-ph] .
[29] T. Gleisberg et al., Event generation with SHERPA 1.1 , JHEP 02 (2009) 007, arXiv: 0811.4622 [hep-ph] .
[30] ATLAS Collaboration, Monte Carlo Generators for the Production of a W or Z/γ
∗Boson in Association with Jets at ATLAS in Run 2 , ATL-PHYS-PUB-2016-003, 2016,
url: https://cds.cern.ch/record/2120133 .
[31] ATLAS Collaboration, Multi-boson simulation for 13 TeV ATLAS analyses ,
ATL-PHYS-PUB-2016-002, 2016, url: https://cds.cern.ch/record/2119986 .
[32] ATLAS Collaboration, Studies on top-quark Monte Carlo modelling for Top2016 , ATL-PHYS-PUB-2016-020, 2016, url: https://cds.cern.ch/record/2216168 . [33] M. Czakon and A. Mitov,
Top++: A program for the calculation of the top-pair cross-section at hadron colliders , Comput. Phys. Commun. 185 (2014) 2930, arXiv: 1112.5675 [hep-ph] .
[34] ATLAS Collaboration,
Combination of searches for heavy resonances decaying into bosonic and leptonic final states using 36 fb
−1of proton–proton collision data at √
s = 13 TeV with the ATLAS detector , Phys. Rev. D 98 (2018) 052008, arXiv: 1808.02380 [hep-ex] .
[35] ATLAS Collaboration, The ATLAS Simulation Infrastructure , Eur. Phys. J. C 70 (2010) 823, arXiv: 1005.4568 [physics.ins-det] .
[36] S. Agostinelli et al., GEANT4 – a simulation toolkit , Nucl. Instrum. Meth. A 506 (2003) 250.
[37] ATLAS Collaboration,
The simulation principle and performance of the ATLAS fast calorimeter simulation FastCaloSim , ATL-PHYS-PUB-2010-013, 2010, url: https://cds.cern.ch/record/1300517 .
[38] ATLAS Collaboration, Electron reconstruction and identification in the ATLAS experiment using the 2015 and 2016 LHC proton-proton collision data at √
s = 13 TeV , (2019), arXiv: 1902.04655 [physics.ins-det] .
[39] ATLAS Collaboration, Muon reconstruction performance of the ATLAS detector in proton–proton collision data at √
s = 13 TeV , Eur. Phys. J. C 76 (2016) 292, arXiv: 1603.05598 [hep-ex] . [40] ATLAS Collaboration, Electron and photon energy calibration with the ATLAS detector using
2015-2016 LHC proton-proton collision data , (), arXiv: 1812.03848 [hep-ex] .
[41] ATLAS Collaboration, Measurement of Higgs boson production in the diphoton decay channel in pp collisions at center-of-mass energies of 7 and 8 TeV with the ATLAS detector ,
Phys. Rev. D 90 (2014) 112015, arXiv: 1408.7084 [hep-ex] .
[42] M. Tanabashi et al., Review of Particle Physics , Phys. Rev. D 98 (2018) 030001, url: https://link.aps.org/doi/10.1103/PhysRevD.98.030001 . [43] G. Cowan, K. Cranmer, E. Gross and O. Vitells,
Asymptotic formulae for likelihood-based tests of new physics ,
Eur. Phys. J. C 71 (2011) 1554, [Erratum: Eur. Phys. J. C 73 (2013) 2501], arXiv: 1007.1727 [physics.data-an] .
[44] ATLAS Collaboration,
Search for resonances in diphoton events at √
s = 13 TeV with the ATLAS detector , JHEP 09 (2016) 001, arXiv: 1606.03833 [hep-ex] .
[45] E. Gross and O. Vitells, Trial factors for the look elsewhere effect in high energy physics , Eur. Phys. J. C 70 (2010) 525, arXiv: 1005.1891 [physics.data-an] .
[46] A. L. Read, Presentation of search results: The CL
Stechnique , J. Phys. G 28 (2002) 2693.
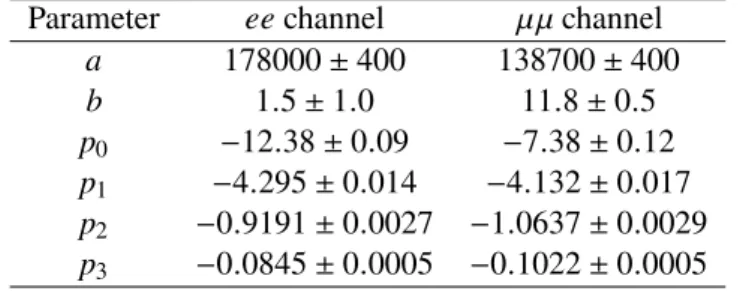
[47] Dielectron channel: a = 178000 ± 400, b = 1 . 5 ± 1 . 0, p
0= − 12 . 38 ± 0 . 09, p
1= − 4 . 295 ± 0 . 014, p
2= − 0 . 9191 ± 0 . 0027, p
3= − 0 . 0845 ± 0 . 0005. Dimuon channel: a = 138700 ± 400,
b = 11 . 8 ± 0 . 5, p
0= − 7 . 38 ± 0 . 12, p
1= − 4 . 132 ± 0 . 017, p
2= − 1 . 0637 ± 0 . 0029,
p
3= − 0 . 1022 ± 0 . 0005.
[48] B. Delaunay, Sur la sphere vide ,
Izvestia Akademii Nauk SSSR: Otdelenie Matematicheskikh i Estestvennykh Nauk 7 (1934) 793.
Appendix
Table 4: The largest positive and negative deviations (excess and deficit), in terms of local p
0quantified in standard deviations σ , from the background-only hypothesis for dielectron, dimuon, and combined channels. The relative width Γ
X/m
Xscan is performed in units of 0 . 5%.
Channel Excess Deficit
p
0[ σ ] m
X[GeV] Γ
X/m
X[%] p
0[ σ ] m
X[GeV] Γ
X/m
X[%]
ee 3 . 0 773 2 . 5 − 3 . 2 1957 4 . 0
µµ 2 . 5 268 2 . 5 − 2 . 8 349 8 . 5
`` 2 . 3 264 0 − 2 . 9 1958 3 . 0
Table 5: Parameters of the fit to data using the function of Eq. (1).
Parameter ee channel µµ channel
a 178000 ± 400 138700 ± 400
b 1 . 5 ± 1 . 0 11 . 8 ± 0 . 5
p
0− 12 . 38 ± 0 . 09 − 7 . 38 ± 0 . 12
p
1− 4 . 295 ± 0 . 014 − 4 . 132 ± 0 . 017
p
2− 0 . 9191 ± 0 . 0027 − 1 . 0637 ± 0 . 0029
p
3− 0 . 0845 ± 0 . 0005 − 0 . 1022 ± 0 . 0005
Table 6: Systematic uncertainties on spurious signal, signal efficiency and mass resolution parameters. The systematic uncertainties are probed for masses from 250 GeV to 6 TeV resulting in ranges of values given in the table. For the efficiency and mass resolution uncertainties, the largest uncertainty from varying the width within the considered range (0-10%) is shown.
Uncertainty source per channel dielectron dimuon
Spurious signal for zero-width [events] 46 – 0.001 44 – 0.03 Spurious signal for 10% relative width [events] 146 – 0.006 122 – 0.04
Identification [% of ] 1 – 6 1 – 31
Isolation [% of ] 0.3 – 1.1 0.5
Good muon requirement [% of ] - 1 – 52
Luminosity [%] 1.7 1.7
Energy scale [% of µ
G] 0 . 4 – 0 . 7 -
Energy scale [% of µ
CB]
+0−0.6.5– 1.2 -
Electron energy resolution [% of σ
G]
+17−14–
+68−38- Electron energy resolution [% of σ
CB] 8 –
+17−27- Muon ID (MS) resolution [% of σ
G] -
+1−3– 1
+4−5
– 6
Muon ID (MS) resolution [% of σ
CB] -
+0−4–
+3−12 –
+8−9Data γ* Z/
Top quarks Diboson Multi-jet & W+jets
(2 TeV) Z'χ
(3 TeV) Z'χ
(4 TeV) Z'χ
(5 TeV) Z'χ
ATLAS Preliminary = 13 TeV, 139 fb-1
s
Dielectron search selection
−3
10
−2
10
−1
10 1 10 102
103
104
105
106
107
Events
102
×
2 103 2×10³
[GeV]
mee
0.6 0.8 1 1.2 1.4
Data/Bkg
(a)
Data γ* Z/
Top quarks Diboson
(2 TeV) Z'χ
(3 TeV) Z'χ
(4 TeV) Z'χ
(5 TeV) Z'χ
ATLAS Preliminary = 13 TeV, 139 fb-1
s
Dimuon search selection
−3
10
−2
10
−1
10 1 10 102
103
104
105
106
107
Events
102
×
2 103 2×10³
[GeV]
µ
mµ
0.6 0.8 1 1.2 1.4
Data/Bkg
(b)
Figure 5: Distributions of (a) dielectron and (b) dimuon reconstructed invariant mass after selection, for data and the
SM background estimates as well as their ratio (for illustration only). The data points are shown together with their
statistical uncertainty. Selected Z
χ0signals with a pole mass of 2, 3, 4 and 5 TeV are overlaid. In the lower panel,
the shaded band corresponds to the MC statistical uncertainty, dashed lines correspond to ± 30% and red arrows
indicate data points that are outside the displayed range.
102
×
3 103 2×10³ 3×10³
[GeV]
mX
−2
10
−1
10 1 10 102
B [fb]×fidσ
ATLAS Preliminary s = 13 TeV, 139 fb-1
→ ee X
/m = 0%
Γ Observed limit at
/m = 0%
Γ Expected limit at
/m = 3% (obs.) Γ
/m = 3% (exp.)
Γ Γ/m = 10% (obs.)
/m = 10% (exp.)
Γ Z'SSM model
(a)
102
×
3 103 2×10³ 3×10³
[GeV]
mX
−2
10
−1
10 1 10 102
B [fb]×fidσ
ATLAS Preliminary s = 13 TeV, 139 fb-1
→ ee X
/m = 0.5%
Γ Observed limit at
/m = 0.5%
Γ Expected limit at
/m = 1.2% (obs.) Γ
/m = 1.2% (exp.)
Γ Γ/m = 6% (obs.)
/m = 6% (exp.)
Γ Z'ψ model
model Z'χ
(b)
102
×
3 103 2×10³ 3×10³
[GeV]
mX
−2
10
−1
10 1 10 102
B [fb]×fidσ
ATLAS Preliminary s = 13 TeV, 139 fb-1 µ
µ
→ X
/m = 0%
Γ Observed limit at
/m = 0%
Γ Expected limit at
/m = 3% (obs.) Γ
/m = 3% (exp.) Γ
/m = 10% (obs.) Γ
/m = 10% (exp.)
Γ Z'SSM model
(c)
102
×
3 103 2×10³ 3×10³
[GeV]
mX
−2
10
−1
10 1 10 102
B [fb]×fidσ
ATLAS Preliminary s = 13 TeV, 139 fb-1 µ
µ
→ X
/m = 0.5%
Γ Observed limit at
/m = 0.5%
Γ Expected limit at
/m = 1.2% (obs.) Γ
/m = 1.2% (exp.) Γ
/m = 6% (obs.) Γ
/m = 6% (exp.) Γ
model Z'ψ
model Z'χ
(d)
102
×
3 103 2×10³ 3×10³
[GeV]
mX
−2
10
−1
10 1 10 102
B [fb]×fidσ
ATLAS Preliminary s = 13 TeV, 139 fb-1
→ ll X
/m = 0%
Γ Observed limit at
/m = 0%
Γ Expected limit at
/m = 3% (obs.) Γ
/m = 3% (exp.) Γ
/m = 10% (obs.) Γ
/m = 10% (exp.)
Γ Z'SSM model
(e)
102
×
3 103 2×10³ 3×10³
[GeV]
mX
−2
10
−1
10 1 10 102
B [fb]×fidσ
ATLAS Preliminary s = 13 TeV, 139 fb-1
→ ll X
/m = 0.5%
Γ Observed limit at
/m = 0.5%
Γ Expected limit at
/m = 1.2% (obs.) Γ
/m = 1.2% (exp.) Γ
/m = 6% (obs.) Γ
/m = 6% (exp.) Γ
model Z'ψ
model Z'χ
(f)
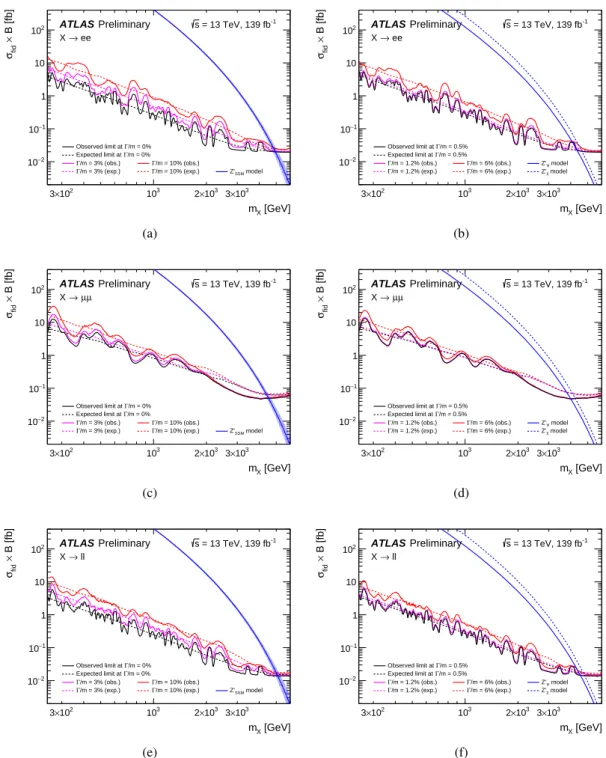
Figure 6: Upper limits at 95% CL on the fiducial cross section times branching ratio to (a) dielectrons and (c)
dimuons and (e) combined channels for the zero-width, 3% and 10% relative width signals as a function of pole
resonance mass. Upper limits at 95% CL on the fiducial cross section times branching ratio as a function of pole
mass for the signals with 0.5%, 1.2% and 6% relative width for the (b) dielectron and (d) dimuon and (f) combined
channels. Observed limits are shown as a solid line and expected limits as a dashed line. A slight deficit observed
in the dimuon cross-section limit is caused by the large dimuon mass resolution such that a downward fluctuation
in the data above 2.0 TeV, leads to better than expected limits at much higher masses. Also shown are theoretical
cross-sections for Z
SS M0, Z
ψ0and Z
χ0in the fiducial region.
1000 2000 3000 4000 5000 6000 [GeV]
mX
−3
10
−2
10
−1
10 1 B [fb]×σfid 10
ATLAS Preliminary = 13 TeV, 139 fb-1
s
→ ee X
/m = 0.5%
Γ Observed limit at
/m = 0.5%
Γ Expected limit at
/m = 1.2% (obs.) Γ
/m = 1.2% (exp.)
Γ Γ/m = 6% (obs.)
/m = 6% (exp.)
Γ Z'ψ model
model Z'χ
(a)
1000 2000 3000 4000 5000 6000
[GeV]
mX
−3
10
−2
10
−1
10 1 B [fb]×σfid 10
ATLAS Preliminary = 13 TeV, 139 fb-1
s µ µ
→ X
/m = 0.5%
Γ Observed limit at
/m = 0.5%
Γ Expected limit at
/m = 1.2% (obs.) Γ
/m = 1.2% (exp.)
Γ Γ/m = 6% (obs.)
/m = 6% (exp.)
Γ Z'ψ model
model Z'χ
(b)
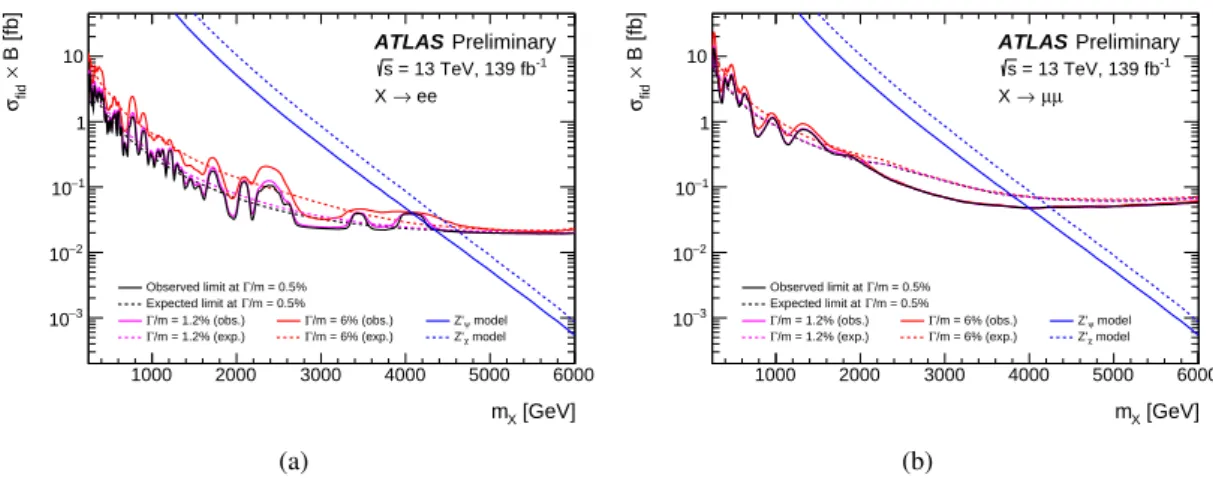
Figure 7: Upper limits at 95% CL on the fiducial cross section times branching ratio as a function of pole mass for the signals with 0.5%, 1.2% and 6% relative width for the (a) dielectron and (b) dimuon channels. Observed limits are shown as a solid line and expected limits as a dashed line. A slight deficit observed in the dimuon cross-section limit is caused by the large dimuon mass resolution such that a downward fluctuation in the data above 2.0 TeV, leads to better than expected limits at much higher masses. Also shown are theoretical cross-sections for Z
ψ0and Z
χ0in the fiducial region.
1000 2000 3000 4000 5000 6000
[GeV]
mX
−3
10
−2
10
−1
10 1 B [fb]×σfid 10
ATLAS Preliminary = 13 TeV, 139 fb-1
s
→ ee X
/m = 0%
Γ Observed limit at
/m = 0%
Γ Expected limit at
/m = 3% (obs.) Γ
/m = 3% (exp.) Γ
/m = 10% (obs.) Γ
/m = 10% (exp.)
Γ Z'SSM model
(a)
1000 2000 3000 4000 5000 6000
[GeV]
mX
−3
10
−2
10
−1
10 1 B [fb]×σfid 10
ATLAS Preliminary = 13 TeV, 139 fb-1
s µ µ
→ X
/m = 0%
Γ Observed limit at
/m = 0%
Γ Expected limit at
/m = 3% (obs.) Γ
/m = 3% (exp.) Γ
/m = 10% (obs.) Γ
/m = 10% (exp.)
Γ Z'SSM model
(b)
Figure 8: Upper limits at 95% CL on the fiducial cross section times branching ratio to (a) dielectrons and (b) dimuons for the zero-width, 3% and 10% relative width signals as a function of pole resonance mass. Observed limits are shown as a solid line and expected limits as a dashed line. A slight deficit observed in the dimuon cross-section limit is caused by the large dimuon mass resolution such that a downward fluctuation in the data above 2.0 TeV, leads to better than expected limits at much higher masses. Also shown is theoretical cross-section for Z
0SSM
in the fiducial region. The signal theoretical uncertainties are shown as a band on the Z
0SSM
theory line for
illustration purposes, but are not included in the limit calculation.
1000 2000 3000 4000 5000 6000 [GeV]
mX
0 0.1 0.2 0.3 0.4 0.5 0.6 0.7 0.8 0.9 1
Selection efficiency
ATLAS Simulation Preliminary
ee channel: Spin-0 Spin-1 Spin-2 channel:
µ
µ Spin-0 Spin-1 Spin-2