ATLAS-CONF-2014-031 03June2014
ATLAS NOTE
ATLAS-CONF-2014-031
May 31, 2014
Search for scalar diphoton resonances in the mass range 65–600 GeV with the ATLAS detector in pp collision data at √
s = 8 TeV
The ATLAS Collaboration
Abstract
A search for scalar particles decaying via narrow resonances into two photons in the mass range 65–600 GeV is performed using 20 fb
−1of pp collision data collected with the ATLAS detector at
√s
=8 TeV at the Large Hadron Collider. The Higgs boson of mass 125.9 GeV is treated as a background. No significant evidence for an additional signal is observed.
The result is presented as a model-independent limit at the 95% confidence level on the production cross-section times branching fraction into two photons, in a fiducial volume where the reconstruction efficiency is approximately independent of the event topology. The upper limits set extend over a considerably wider mass range than previous searches.
c
Copyright 2014 CERN for the benefit of the ATLAS Collaboration.
Reproduction of this article or parts of it is allowed as specified in the CC-BY-3.0 license.
In July 2012, the ATLAS and CMS collaborations reported the discovery a Higgs boson (H) [1, 2], whose measured couplings and properties are compatible with the Standard Model predictions [3–6].
However, several extensions to the Standard Model, in particular models featuring an extended Higgs sector [7–13], predict new scalar resonances below or above the H mass which may have a narrow width if their branching fraction to two photons is non-negligible.
This note presents a search for a scalar particle X decaying into a pair of photons. The resonance is considered narrow when its intrinsic width is smaller than 1 GeV
+0.01
·m
X, where m
Xis the mass of the resonance, which is slightly larger than the experimental resolution of the diphoton invariant mass in the ATLAS detector. Model-dependent interference effects between the resonance and the continuum diphoton background are not considered.
The analysis extends the method developed for the measurement of the H couplings in the H
→γγchannel [3] to search for diphoton resonances in the wider mass range 65
<m
X <600 GeV. The search is performed by fitting analytical descriptions of the signal and background distributions to the measured diphoton invariant mass spectrum m
γγ. The background yield in the signal region is estimated by in- terpolation between the m
γγsidebands. As no significant excess of events is observed in the data, the result is presented as a limit on the production cross-section times the branching fraction BR(X
→γγ),restricted to a fiducial volume where the reconstruction efficiency is independent of the event topology and the production mode.
The ATLAS detector [14] at the LHC [15] covers the pseudorapidity
1range
|η| <4.9 and the full azimuthal angle
φ. It consists of an inner tracking detector covering the pseudorapidity range |η| <2.5 surrounded by a thin superconducting solenoid, electromagnetic and hadronic calorimeters, and an external muon spectrometer incorporating large superconducting toroidal magnets.
The search is carried out using the
√s
=8 TeV pp collision dataset collected in 2012, with stable beam conditions and all ATLAS subsystems operational, corresponding to an integrated luminosity of
L =20.3
±0.6 fb
−1[16]. The data were recorded using a diphoton trigger that required two elec- tromagnetic clusters with transverse energies E
Tabove 20 GeV, both fulfilling identification criteria based on shower shapes in the electromagnetic calorimeter. The e
fficiency of the diphoton trigger is (98.7
±0.5)% [17] for events passing the final event selection.
The event selection requires at least one reconstructed primary vertex with two or more tracks with transverse momenta p
T >0.4 GeV, and at least two photon candidates with E
T>22 GeV in the fiducial volume
|η|<2.37, excluding the barrel/endcap transition region of the calorimeter 1.37
<|η|<1.56.
Photon reconstruction is seeded by clusters in the electromagnetic calorimeter. Clusters without matching tracks are classified as unconverted photons. Clusters with matched tracks are considered as electron candidates, but are classified as converted photons if they are associated with two tracks consistent with a
γ→e
+e
−conversion process, or a single track leaving no hit in the innermost layer of the inner tracking detector.
Photon candidates are required to fulfill identification criteria based on shower shapes in the electro- magnetic calorimeter, and on energy leakage into the hadronic calorimeter [18]. Identification efficien- cies, averaged over
η, range from 70% to above 99% for theE
Trange under consideration. To further reduce the background from jets, the calorimeter isolation transverse energy E
Tisois required to be smaller than 6 GeV, where E
isoTis defined as the sum of transverse momenta of the positive-energy topological
1ATLAS uses a right-handed coordinate system with its origin at the nominal interaction point (IP) in the center of the detector, and thez-axis along the beam line. Thex-axis points from the IP to the center of the LHC ring, and they-axis points upwards. Cylindrical coordinates (r, φ) are used in the transverse plane,φbeing the azimuthal angle around the beam line.
Observables labeled transverse are projected into thex-yplane. The pseudorapidity is defined in terms of the polar angleθas η=– ln[tan(θ/2)].
clusters [19] within a cone of size
∆R
= p∆φ2+ ∆η2=
0.4 around the photon candidate. The core of the photon shower is excluded, and E
Tisois corrected for the leakage of the photon shower inside the isolation cone. The contributions from the underlying event and pile-up are subtracted using the technique pro- posed in Ref. [20] and implemented as described in Ref. [21]. In addition, the track isolation momentum, defined as the scalar sum of the p
Tof the primary vertex tracks with p
T >1 GeV in a cone
∆R
=0.2 around the photon candidate, excluding the conversion tracks, is required to be smaller than 2.6 GeV.
The m
γγinvariant mass is evaluated using the leading photon (γ
1) and subleading photon (γ
2) ener- gies measured in the calorimeter, the azimuthal angle
∆φand the pseudorapidity
∆ηseparations between the photons determined from their positions in the calorimeter, and the position of the reconstructed diphoton vertex [3].
After the selection, the data sample consists of a continuum background with dominantly
γγ,γ-jetand jet- jet events and the non-resonant Drell-Yan production of electron pairs where both electrons are misidentified as photons. On top of the continuum, two peaking backgrounds arise from the Z boson component of the Drell-Yan background and from the H decays to diphoton.
To increase the sensitivity, the search is split into two analyses: a categorized low-mass analysis covering the range 65
<m
X <110 GeV, and an inclusive high-mass analysis covering 110
<m
X <600 GeV. To provide sidebands on both sides of the tested mass point m
X, the m
γγranges are wider than the m
Xranges probed and partially overlap at the transition between the two analyses.
In the low-mass analysis, the most challenging background is the Drell-Yan production, dominated by the Z boson resonance where both electrons are misidentified as photons (denoted fake photons), mostly classified as converted photons. The loss of signal sensitivity is mitigated by separating the events into three categories, according to the number of converted photon candidates in each event: two unconverted (UU), one unconverted and one converted (CU) or two converted (CC) photons. Table 1 shows the fractions of signal and Drell-Yan events expected in each category. The category with the best signal to background ratio is UU.
Table 1: Number of diphoton events in data, N
data, number of expected Drell-Yan events, N
DY, and fractions of expected signal, f
X(m
X=90 GeV), and Drell-Yan, f
DY, in each conversion category for the low-mass analysis.
γ
conversion
UU CU CC
category
N
data272184 253804 63224
N
DY1080
±260 3400
±600 2700
±250
f
DY15.0% 47.3% 37.7%
f
X48.7% 42.5% 8.8%
In each category, the Z resonance shape is described by a double-sided Crystal Ball function
2. The shape parameters are determined by a fit to a dielectron data sample, where both electrons are required to fulfill shower shape identification criteria and the same E
Tcuts as the photons. Since most of the electrons misidentified as fake photons underwent large bremsstrahlung, the invariant mass distribution of the Z boson background reconstructed as a fake photon pair is wider and shifted by up to 2 GeV with respect to the Z boson mass reconstructed from an electron pair. The ee invariant mass distributions of
2A double-sided Crystal Ball function is composed of a Gaussian distribution at the core, connected with two power-law distributions describing the lower and upper tails [22].
the Drell-Yan background extracted from data are transformed by applying a shift and a smearing factor to the electron E
Tand
φ, to match the kinematics of the electrons misidentified as photons. Two sets oftransformations are derived for
γ1and
γ2depending on their conversion status, using a sample of Z
→ee events simulated with
powheg[23, 24] interfaced with
pythia8 [25] for showering and hadronization.
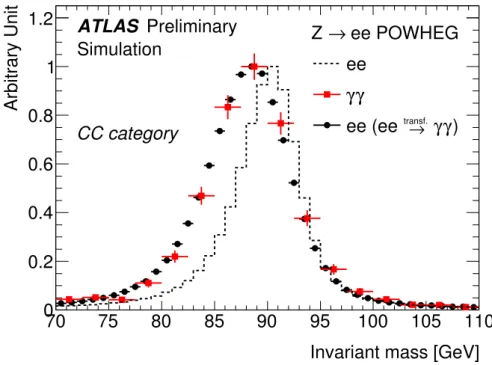
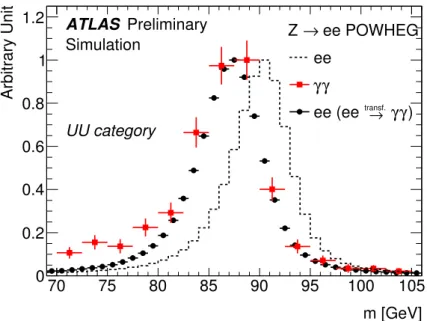
Figure 1 illustrates the e
ffect of the transformations on the invariant mass shape in the simulated Z
→ee sample.
Invariant mass [GeV]
70 75 80 85 90 95 100 105 110
Arbitrary Unit
0 0.2 0.4 0.6 0.8 1
1.2 Z → ee POWHEG
ee γ γ
) γ
→
γ
transf.
ee (ee CC category
ATLAS Preliminary Simulation
Figure 1: Invariant mass distributions for fully simulated Z
→ee events, reconstructed as ee (dotted- lines) and
γγ(squares). The ee histogram (circles) shows the invariant mass distribution of the events after transforming the electrons to match the kinematics of the electrons misidentified as converted pho- tons.
The Drell-Yan normalization is computed in each category from the e
→ γfake rates, defined as the ratio of eγ to ee pairs in Z
→ee data, measured separately for
γ1and
γ2and each conversion status.
The dominant uncertainties on the Z peak position, shape and normalization arise from the kinematic transformations applied to the electrons, from the e
→ γfake rates determination, and from a photon correction factor that parametrises isolation correlations between the two fake photons.
The determination of the analytical form of the continuum background and the corresponding un- certainties follow the method detailed in Ref. [1]. The sum of a Landau and an exponential function is used over the full m
γγrange for each category. The bias on the signal yield induced by the analytical shape function is required to be lower than 20% of the statistical uncertainty on the fitted signal yield for a background-only spectrum. This bias is computed from a simulated sample of
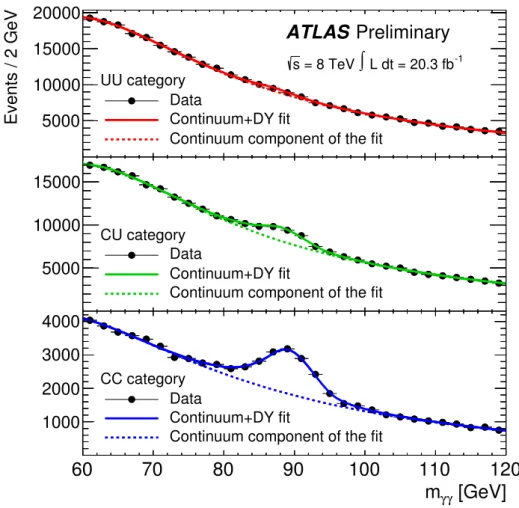
γγ,γ-jet and jet-jetevents and is accounted for by a mass-dependent systematic uncertainty. Figure 2 shows the results of background-only fits to the data in the low-mass analysis, for the three conversion categories.
In the high-mass analysis, relative cuts E
Tγ1/mγγ>0.4 and E
γT2/mγγ>0.3 are added on top of the selection cuts to reduce the continuum backgrounds and increase the sensitivity. In total, 108654 events with 100
<m
γγ<800 GeV are selected.
To determine the continuum background shape over such a large mass range, an exponential of a
60 70 80 90 100 110 120
Events / 2 GeV 5000
10000 15000 20000
UU category Data
Continuum+DY fit
Continuum component of the fit
60 70 80 90 100 110 120
5000 10000 15000
CU category Data
Continuum+DY fit
Continuum component of the fit
[GeV]
γ
m
γ60 70 80 90 100 110 120
1000 2000 3000 4000
CC category Data
Continuum+DY fit
Continuum component of the fit
ATLAS Preliminary
L dt = 20.3 fb-1
∫
= 8 TeV s
Figure 2: Background-only fits to the data (black dots) as functions of the diphoton invariant mass m
γγfor the three conversion categories in the low-mass range. The solid lines show the sum of the Drell-Yan and the continuum background components, while the dashed lines show the continuum background component only.
second-order polynomial is fitted within a sliding m
γγwindow defined as the interval of total width 80
·(m
X−110 GeV)/110
+20 GeV centered on the tested mass point m
X. In order to minimize the statistical uncertainty on the expected background, the width is chosen to be the largest value which fulfills the signal yield bias criterion defined above for the low-mass analysis.
The H background shape is modelled by a double-sided Crystal Ball function, and normalized with the most up-to-date Standard Model cross-section calculations and corrections [26] for a mass m
H =125.9 GeV [3, 27, 28]. The number of expected H events is estimated from fully simulated sam- ples of the five main production modes: gluon fusion (ggF), vector boson fusion (VBF), Higgs-strahlung (W H, ZH) and associated production with a top quark pair (t¯ tH). The ggF and VBF samples are simu- lated with the
powheg[23, 24] generator interfaced with
pythia8 [25] for showering and hadronization.
The W H, ZH and t¯ tH samples are simulated with
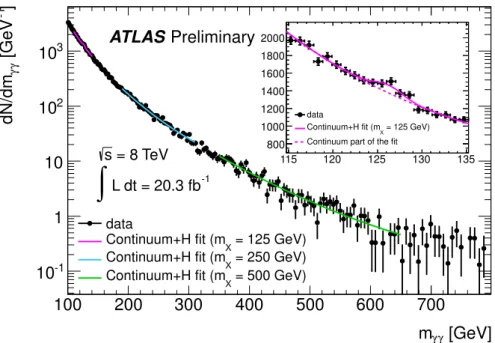
pythia8. Details about the simulated samples can befound in Ref. [3] and references therein. Figure 3 shows the results of several background-only fits to the data in the high-mass analysis.
The expected invariant mass distribution of the narrow resonance signal X is also modelled with a
double-sided Crystal Ball function in the full mass range 70
≤m
X ≤600 GeV. The parameters of the
function are extracted from fully simulated ggF(X) samples, where X is a scalar boson generated with
[GeV]
γ
mγ
100 200 300 400 500 600 700
]-1 [GeVγγdN/dm
10-1
1 10 102
103
data
= 125 GeV) Continuum+H fit (mX
= 250 GeV) Continuum+H fit (mX
= 500 GeV) Continuum+H fit (mX
= 8 TeV s
L dt = 20.3 fb-1
∫
ATLAS Preliminary
115 120 125 130 135
800 1000 1200 1400 1600 1800 2000
data
= 125 GeV) Continuum+H fit (mX
Continuum part of the fit
Figure 3: Background-only fits to the data (black dots) as functions of the diphoton invariant mass m
γγfor the inclusive high mass analysis. The solid line shows the sum of the Higgs boson and the continuum background components, while the dashed line shows the continuum background component only.
a constant width of 4 MeV. The evolution of the double-sided Crystal Ball parameters as a function of m
Xare parameterized with polynomial functions, obtained from a simultaneous fit to all the generated mass points m
X, and determined separately for the inclusive high-mass analysis and for the three low- mass analysis categories, to account for the dependence of the mass resolution on m
X. The signal shape parameters extracted from the ggF(X) simulated sample are compared to other production modes W X, ZX, t¯ tX and VBF(X). The maximum bias induced on the signal yield by the choice of the signal shape, 1% over all the mass points, is accounted for as a systematic uncertainty.
The fiducial cross-section
σfid·BR(H
→γγ) includes an efficiency correction factorC
Xthrough
σfid·BR(H
→γγ)=N
dataC
X· Lwith C
X =N
MCrecoN
fidMC,where N
datais the number of fitted signal events in data, N
recoMCthe number of simulated signal events passing all the selection cuts and N
MCfidthe number of simulated signal events generated within the fiducial volume, defined from geometrical and kinematical constraints at the generated particle level. The fiducial volume is optimized to reduce the model dependence of C
Xusing fully simulated samples of the five X production modes to cover a large variety of topologies. The selection cuts applied to the photon variables at generated particle level are similar to the those applied to data: both photons are required to be within
|η| <
2.37 and with E
T >22 GeV. For m
γγgreater than 110 GeV, the relative cuts E
γT1/mγγ>0.4 and E
Tγ2/mγγ>0.3 are imposed. The particle isolation, defined as the scalar sum of p
Tof all the stable particles (except neutrinos) found within a
∆R
=0.4 cone around the photon direction, is required to be less than 12 GeV. The C
Xfactor is parameterized from the ggF(X) sample as a function of m
X, and ranges from 0.56 to 0.71. The residual dependence of C
Xon the event topology is accounted for by a mass-dependent systematic uncertainty.
The statistical analysis of the data uses unbinned maximum likelihood fits. In the low-mass analysis,
[GeV]
mX
100 200 300 400 500 600
BR [fb]⋅fidσ95% CL limit on
10-1
1 10 102
103
ATLASPreliminary
= 8 TeV
s
∫
L dt = 20.3 fb-1Observed Expected
1 σ
± 2 σ
±
60 80 100 120 140 160
50 100
Figure 4: Observed and expected 95% CL limit on the fiducial cross-section times branching fraction BR(X
→γγ) as a function ofm
Xin the range 65
<m
X <600 GeV. The discontinuity in the limit at m
X=
110 GeV (vertical dashed line) is due to the transition between the low-mass and high-mass analyses.
The dark and light shaded bands show the
±1σand
±2σuncertainties on the expected limit. The inset shows a zoom of the limit in the 65
<m
X <170 GeV range.
a simultaneous fit to the three conversion categories is performed. Over the full mass range 65–600 GeV, only two excesses with a 2σ local significance above the background are observed, for m
X=201 GeV andm
X=530 GeV, consistent with the absence of a signal. Consequently, a 95% limit onσfid·BR(H
→γγ)is computed using the procedure of Ref. [3].
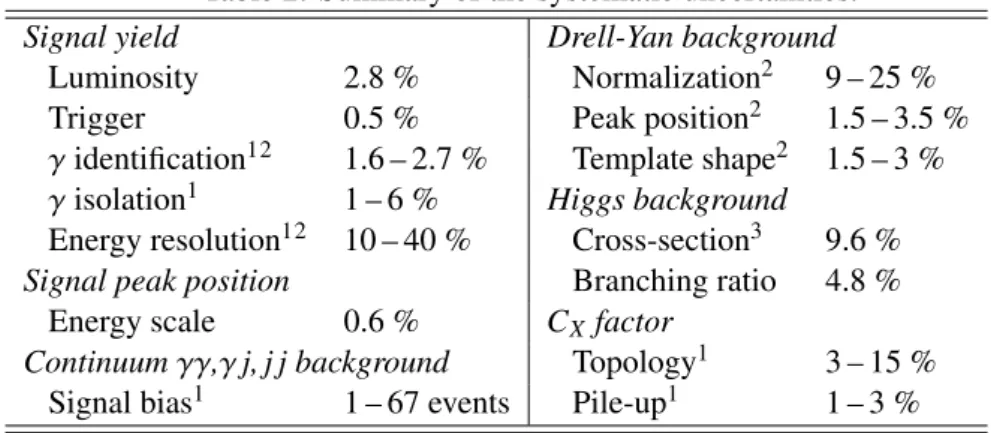
The systematic uncertainties listed in Table 2 are accounted for by nuisance parameters and pseudo- measurement terms in the likelihood function. In the low-mass analysis, the dominant uncertainties are the Drell-Yan normalization and the mass-dependent systematic uncertainty on C
X. In the high-mass analysis, the largest uncertainty arises from the energy resolution, except around 126 GeV where the contribution of the theoretical uncertainty on the production rate of the Standard Model Higgs boson is significant.
The observed and the expected limits, shown in Figure 4, are in good agreement, consistent with the
absence of a signal. The limits on
σfid·BR(H
→γγ) for an additional scalar resonance range from 90 fbat the low end of the search interval, to 1 fb for m
X=600 GeV. These results extend over a considerably
wider mass range than the previous searches by the ATLAS and CMS collaborations [1, 2] and are the
first such limits independent of the event topology.
Table 2: Summary of the systematic uncertainties.
Signal yield Drell-Yan background
Luminosity 2.8 % Normalization
29 – 25 %
Trigger 0.5 % Peak position
21.5 – 3.5 %
γ
identification
121.6 – 2.7 % Template shape
21.5 – 3 %
γisolation
11 – 6 % Higgs background
Energy resolution
1210 – 40 % Cross-section
39.6 % Signal peak position Branching ratio 4.8 %
Energy scale 0.6 % C
Xfactor
Continuum
γγ,γj, j j background Topology
13 – 15 % Signal bias
11 – 67 events Pile-up
11 – 3 %
1mass-dependent.
2category-dependent.
3factorisation scale+p.d.f uncertainties
References
[1] ATLAS Collaboration, Phys. Lett.
B716(2012) 1–29, arXiv:1207.7214 [hep-ex].
[2] CMS Collaboration, Phys. Lett.
B716(2012) 30–61, arXiv:1207.7235 [hep-ex].
[3] ATLAS Collaboration, Phys. Lett.
B726(2013) 88–119, arXiv:1307.1427 [hep-ex].
[4] CMS Collaboration, JHEP
2013(2013) 1–127, arXiv:1303.4571 [hep-ex].
[5] ATLAS Collaboration, Phys. Lett.
B726(2013) 120–144, arXiv:1307.1432 [hep-ex].
[6] CMS Collaboration, Phys. Rev. Lett.
110(2013) 081, arXiv:1212.6639 [hep-ex].
[7] A. Hill and J. van der Bij, Phys.Rev.
D36(1987) 3463–3473.
[8] M. Veltman and F. Yndurain, Nucl.Phys.
B325(1989) 1.
[9] T. Binoth and J. van der Bij, Z.Phys.
C75(1997) 17–25, arXiv:hep-ph/9608245 [hep-ph].
[10] R. Schabinger and J. D. Wells, Phys.Rev.
D72(2005) 093007, arXiv:hep-ph/0509209 [hep-ph].
[11] B. Patt and F. Wilczek, arXiv:hep-ph/0605188 [hep-ph].
[12] G. M. Pruna and T. Robens, Phys.Rev.
D88(2013) 115012, arXiv:1303.1150 [hep-ph].
[13] T. Lee, Phys. Rev.
D8(1973) 1226–1239.
[14] ATLAS Collaboration, JINST
3(2008) S08003.
[15] L. Evans and P. Bryant, Journal of Instrumentation
3no. 08, (2008) S08001.
http://stacks.iop.org/1748-0221/3/i=08/a=S08001.
[16] ATLAS Collaboration, Eur. Phys. J.
C73(2013) 2518, arXiv:1302.4393 [hep-ex].
[17] ATLAS Collaboration, ATLAS-CONF-2012-048. http://cds.cern.ch/record/1450089.
[18] ATLAS Collaboration, ATL-PHYS-PUB-2011-007.
https://cdsweb.cern.ch/record/1345329.
[19] ATLAS Collaboration, Phys. Rev.
D83(2011) 052005, arXiv:1012.4389 [hep-ex].
[20] M. Cacciari, G. P. Salam, and S. Sapeta, JHEP
1004(2010) 065, arXiv:0912.4926 [hep-ph].
[21] ATLAS Collaboration, Phys. Rev.
D85(2012) 012003, arXiv:1107.0581 [hep-ex].
[22] M. J. Oreglia,, A study of reactions
ψ0 →γγψ. PhD thesis, Univ. Stanford, 1980. SLAC-R-0236,Appendix D.
[23] S. Alioli, P. Nason, C. Oleari, and E. Re, JHEP
0904(2009) 002, arXiv:0812.0578 [hep-ph].
[24] P. Nason and C. Oleari, JHEP
1002(2010) 037, arXiv:0911.5299 [hep-ph].
[25] T. Sjostrand, S. Mrenna, and P. Z. Skands, JHEP
0605(2006) 026, arXiv:hep-ph/0603175 [hep-ph].
[26] LHC Higgs Cross Section Working Group, S. Heinemeyer (Ed.), et al., CERN-2013-004 (2013), arXiv:1307.1347 [hep-ph].
[27] Particle Data Group, J. Beringer, et al., Phys. Rev.
D86(2012) 010001. And 2013 partial update for the 2014 edition.
[28] CMS Collaboration Collaboration, S. Chatrchyan et al., Phys.Rev.
D89(2014) 092007,
arXiv:1312.5353 [hep-ex].
A Additional Figures
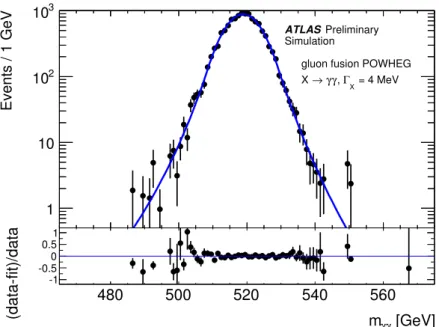
A.1 Signal Modeling
480 500 520 540 560
Events / 1 GeV
1 10 102
103
ATLASPreliminary Simulation
gluon fusion POWHEG = 4 MeV ΓX
γ, γ X →
[GeV]
γ
mγ
480 500 520 540 560
(data-fit)/data
-1 -0.5 0 0.5 1
Figure 5: Invariant mass distribution m
γγof the fully simulated gluon fusion sample with a mass m
X =520 GeV and a natural width of 4 MeV, fitted with a double-sided Crystal Ball function. The bottom part of the plot shows the normalised residuals.
[GeV]
γ
mγ
520 540 560 580 600 620 640 660 680
Arbitrary units
1 10 102
103
αLow CB. σ
power law
-nLow
~(-m)
αHigh CB. σ
power law
-nHigh
~m
mX
∆ σCB
Gaussian distribution ATLAS Preliminary γ γ X →
Figure 6: Description of the double-sided Crystal Ball function parameters:
∆m
X =m
X−µCB, where
µCBis the peak of the Gaussian distribution,
σCBrepresents the width of the Gaussian part of the function,
αLow(α
High) is the point where the Gaussian becomes a power law on the low (high) mass side, n
Low(n
High) is the exponent of this power law.
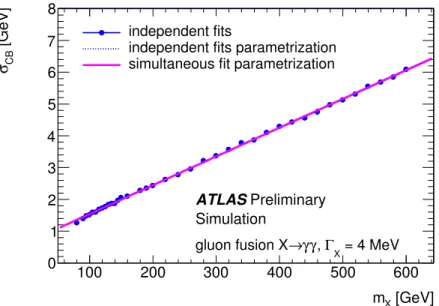
[GeV]
mX
100 200 300 400 500 600
[GeV]CBσ
0 1 2 3 4 5 6 7 8
ATLASPreliminary Simulation
= 4 MeV ΓX
, γ γ gluon fusion X→ independent fits
independent fits parametrization simultaneous fit parametrization
Figure 7:
σCBparametrization obtained from a simultaneous fit to all the generated mass points m
Xfrom fully simulated ggF(X) samples (line), as a function of m
Xin the high-mass analysis. For comparison, the points correspond to independent mass fits to each ggF(X) sample and the dotted line to a linear fit of those points.
100 200 300 400 500 600
XC
0.56 0.58 0.6 0.62 0.64 0.66 0.68 0.7 0.72 0.74
ggX VBF WX ZX ttX ggX VBF WX ZX ttX
ATLAS Preliminary Simulation
[GeV]
mX
100 200 300 400 500 600
ratio XC 0.9
1 1.1 1.2
Figure 8: Efficiency correction factors C
Xcomputed from fully simulated samples of the five main
Higgs-like production modes as a function of m
X(top). Ratio of the C
Xfactors to the ggF(X) C
Xfactor
(bottom). The discontinuity in the limit at m
X =110 GeV is due to the transition between the low- and
high-mass analyses.
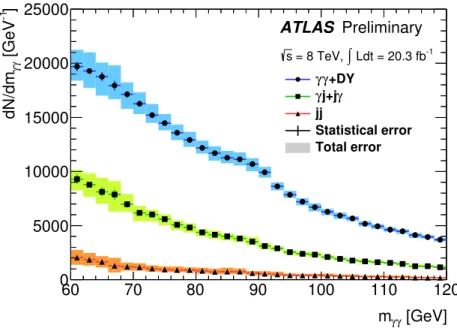
A.2 Continuum Background Decomposition
[GeV]
γ
mγ
60 70 80 90 100 110 120
]-1 [GeVγγdN/dm
0 5000 10000 15000 20000 25000
γ+DY γ
j+jγ γ jj
Statistical error Total error
ATLAS Preliminary
Ldt = 20.3 fb-1
∫
= 8 TeV, s
Figure 9: Diphoton spectrum decomposition in the
γγ(including the DY component),
γ-jet and jet-jetcomponents as a function of the diphoton invariant mass m
γγin the 60-120 GeV range. The total fraction of
γγ,γ-jet and jet-jet events is 69.1%, 26.1% and 4.8% respectively, with aγγpurity increasing from 65 to 75% with the invariant mass.
[GeV]
γ
mγ
100 200 300 400 500 600 700 800 ]-1 [GeVγγdN/dm
10-3
10-2
10-1
1 10 102
103 γγ+DY
γ γj+j jj
Statistical error Total error
ATLAS Preliminary s = 8 TeV, ∫ Ldt = 20.3 fb-1
Figure 10: Diphoton spectrum decomposition in the
γγ(including the DY component),
γ-jet and jet-jetcomponents as a function of the diphoton invariant mass m
γγin the 100–800 GeV range. The total
fraction of
γγ,γ-jet and jet-jet events is 83.7%, 15.1% and 1.2% respectively, with aγγpurity increasing
from 80 to 96% with the invariant mass.
A.3 Drell-Yan Background
m [GeV]
70 75 80 85 90 95 100 105
Arbitrary Unit
0 0.2 0.4 0.6 0.8 1
1.2 Z → ee POWHEG
ee γ γ
γ)
→ γ
transf.
ee (ee UU category
ATLAS Preliminary Simulation
Figure 11: Invariant mass distributions for fully simulated Z
→ee events, reconstructed as ee (dotted- lines) and
γγ(squares). The ee histogram (circles) shows the invariant mass distribution of the events after transforming the electrons to match the kinematics of the electrons misidentified as unconverted photons.
A.4 p
0Plots
[GeV]
mX
60 70 80 90 100 200 300 400 500 600
0Local p
10-2
10-1
1 10
ATLAS Preliminary
= 8 TeV
s ∫ Ldt = 20.3 fb-1
Observed
= 10 fb) σfid
Expected (
1σ
2σ
Figure 12: Observed and expected (for
σfid =10 fb) p-values for the background-only hypothesis p
0,
for both the low-mass and high-mass analyses in log scale, without taking the look-elsewhere e
ffect into
account. The dotted-dashed lines indicate the corresponding significance. The discontinuity in the limit
at m
X =110 GeV is due to the transition between the low- and high-mass analyses. The two minima at
201 GeV and 530 GeV correspond to observed p
0values of 2.0% and 1.3% respectively.
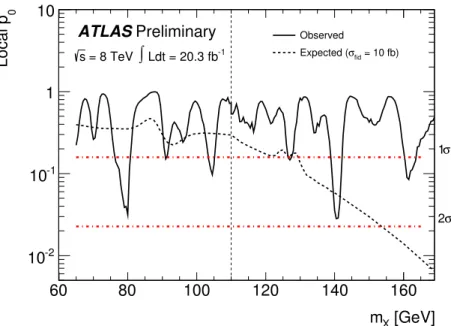
[GeV]
mX
60 80 100 120 140 160
0Local p
10-2
10-1
1 10
ATLASPreliminary
= 8 TeV
s
∫
Ldt = 20.3 fb-1Observed
= 10 fb) σfid
Expected (
1σ
2σ
Figure 13: Observed and expected (for
σfid =10 fb) p-values for the background-only hypothesis p
0, for both the low-mass and high-mass analyses in the 65–170 GeV mass range, without taking the look- elsewhere e
ffect into account. The dotted-dashed lines indicate the corresponding significance. The discontinuity in the limit at m
X =110 GeV is due to the transition between the low- and high-mass analyses.
A.5 Additional Limit Plots
[GeV]
mX
60 80 100 120 140 160
BR [fb]⋅fidσ95% CL limit on
0 20 40 60 80 100 120 140 160 180
ATLASPreliminary
= 8 TeV
s
∫
L = 20.3 fb-1 Observed Expected1 σ
± 2 σ
±