ATLAS-CONF-2012-144 12November2012
ATLAS NOTE
ATLAS-CONF-2012-144
November 7, 2012
Search for supersymmetry in events with at least one photon, one lepton, and large missing transverse momentum in proton–proton collision at a
center-of-mass energy of 7 TeV with the ATLAS detector
The ATLAS Collaboration
Abstract
A search for supersymmetry in events with at least one photon, one electron or muon, and large missing transverse momentum has been performed using up to 4.8 fb
−1of proton–
proton collision data at
√s =7 TeV recorded in 2011 with the ATLAS detector. No excess of events was observed above the Standard Model prediction and model-independent exclusion limits for new physics are set. In the context of a generalized model of gauge- mediated supersymmetry breaking with a wino-like next-to-lightest supersymmetric partner, gluino masses below 619 GeV are excluded at 95 % CL for any wino mass, and wino masses below 221 GeV are excluded for any gluino mass.
c Copyright 2012 CERN for the benefit of the ATLAS Collaboration.
Reproduction of this article or parts of it is allowed as specified in the CC-BY-3.0 license.
1 Introduction
Supersymmetry (SUSY) [1, 2, 3, 4, 5, 6, 7, 8, 9] introduces a symmetry between fermions and bosons, resulting in a SUSY partner (sparticle) for each Standard Model (SM) particle with identical quantum numbers except a difference of half a unit of spin. As no sparticle has yet been observed, SUSY must be a broken symmetry if realised in nature. Assuming R-parity conservation [10, 11, 12, 13, 14], sparticles would be produced in pairs. These would then decay through cascades involving both other sparticles as well as SM particles until the lightest SUSY particle (LSP), which is stable, is produced.
In gauge-mediated SUSY breaking (GMSB) models [15, 16, 17, 18, 19, 20], the LSP is the gravitino ( ˜ G). GMSB experimental signatures are largely determined by the nature of the next-to-lightest super- symmetric partner (NLSP). In this study the results were interpreted in the context of General Gauge Mediation (GGM) [21, 22, 23] using models where a nearly-degenerate triplet of partners of the SU(2) gauge boson, known collectively as the wino and denoted by ˜ χ
01(neutralino) and ˜ χ
±1(chargino), serves as the NLSP. The ˜ χ
01and ˜ χ
±1masses are so similar as to prohibit a wino state to serve as a decay product of another wino state. These states decay via ˜ χ
01 →G(Z, γ) and ˜ ˜ χ
±1 →GW ˜
±, leading to a substantial production rate of final states containing both a photon and a lepton accompanied by significant missing transverse momentum due to the presence of two undetected gravitinos and, in most such events, one or more neutrinos. The neutralino branching fraction to photon approaches sin
2θ
Wat high wino mass but is enhanced at lower wino mass with, for example, a value of 45 % at m( ˜ χ
01)
=200 GeV.
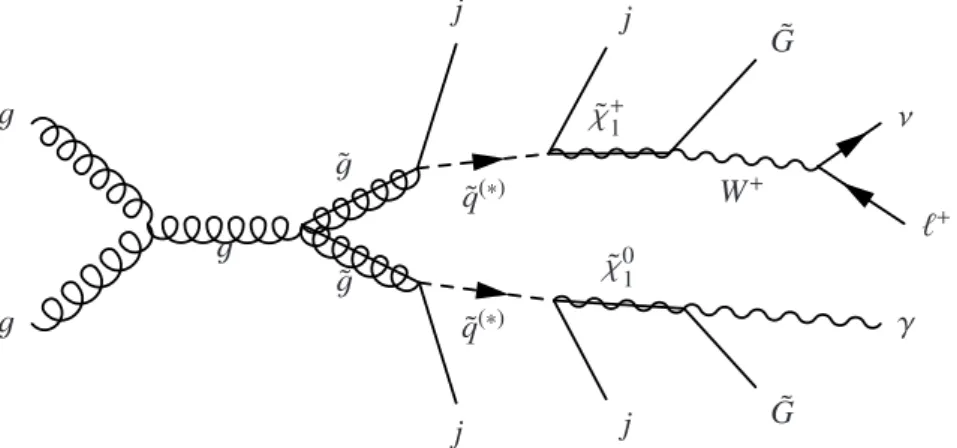
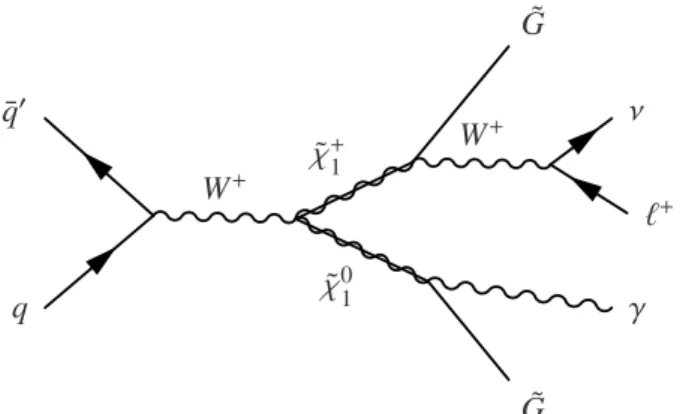
We performed a search for events that contain at least one photon, at least one electron or muon (including those decaying from taus), and large missing transverse momentum. The electron and muon channels were analysed separately and combined to derive model-dependent limits. The results were interpreted in a GGM framework with a wino-like NLSP. The mass of the wino and gluino (˜ g) were treated as free parameters, with all other sparticle masses decoupled. In such a scenario, depending upon the masses of the gluino and wino states, SUSY particle production is dominated either by ˜ g-pair production (see Fig. 1) or by the production of ˜ χ
+1χ ˜
−1or ˜ χ
±1χ ˜
01pairs (see Fig. 2). In the former case, the gluinos decay via cascades into the wino-like charged and neutral NLSPs, accompanied by other SM particles such as gluons, quarks, leptons and gauge bosons. A prior study by the CMS collaboration [24]
within the context of this model set a 95 % CL lower limit on m(˜ g) of 440 GeV for any value of the wino mass.
Potential SM backgrounds are expected to be dominated by the production of a W boson or t¯ t pair in association with a photon (Wγ, t tγ), and ¯ t t ¯ production for which both top quarks decay semileptonically and one lepton, an electron, is misidentified as a photon (referred to as fully-leptonic t t). Background ¯
g
˜ g
˜ g
˜ q
(∗)q ˜
(∗)˜ χ
01˜ χ
+1W
+g g
γ ℓ
+ν
j j G ˜
j j G ˜
Figure 1: Example of gluino production and subsequent decay to a final state with a photon, lepton, and
missing transverse momentum.
W
+˜ χ
01˜
χ
+1W
+q
¯ q
′γ ℓ
+ν
G ˜ G ˜
Figure 2: Example of direct s-channel wino-like chargino-neutralino production and subsequent decay to a final state with a photon, lepton, and missing transverse momentum.
contributions from these sources were estimated via Monte Carlo simulation (MC). Background events can also arise from SM processes involving jets, such as W
+jets, semi-leptonic t t, ¯ γ
+jets, and Z (
→µµ)
+jets, for which one of the jets is misidentified as a photon or a lepton candidate. Data-driven methods were employed to model such backgrounds. Other, less important backgrounds, like other Z
+X, single-top, and other diboson (WW,WZ, and ZZ) events were modeled by MC.
2 ATLAS Detector
The ATLAS detector [25] is a multi-purpose apparatus with a forward-backward symmetric cylindrical geometry and nearly 4π solid angle coverage. Closest to the beamline are tracking devices comprising layers of silicon-based pixel and strip detectors covering
|η
|< 2.5
1and straw-tube detectors covering
|
η
|< 2.0, located inside a thin superconducting solenoid that provides a 2 T magnetic field. The straw- tube detectors also provide discrimination between electrons and charged hadrons based on transition radiation. Outside the solenoid, fine-granularity lead/liquid-argon electromagnetic (EM) calorimeters measure the energy and position of electrons and photons in the region
|η
|< 3.2. A presampler, cov- ering
|η
|< 1.8, is used to correct for energy lost by particles before entering the EM calorimeter. An iron/scintillating-tile hadronic calorimeter covers the region
|η
|< 1.7, while copper and liquid-argon technology is used for hadronic calorimeters in the end-cap region 1.5 <
|η
|< 3.2. In the forward region 3.2 <
|η
|< 4.9 liquid-argon calorimeters with copper and tungsten absorbers measure the electro- magnetic and hadronic energy. A muon spectrometer (MS) consisting of three superconducting toroidal magnet systems each comprising eight toroidal coils, tracking chambers, and detectors for triggering surrounds the calorimeter system.
The ATLAS detector uses three levels of triggering [26]. Level 1 is implemented in custom hardware and has to perform decisions quickly. Layer 2 is implemented in software using simple algorithms.
Finally, the high-level trigger (HLT) uses simplified versions of the standard reconstruction algorithms to make the final selections.
1ATLAS uses a right-handed coordinate system with its origin at the nominal interaction point (IP) in the centre of the detector and thez-axis along the beam pipe. Thex-axis points from the IP to the centre of the LHC ring, and they-axis points upward. Cylindrical coordinates (r, φ) are used in the transverse plane,φbeing the azimuthal angle around the beam pipe. The pseudorapidity is defined in terms of the polar angleθasη=−ln tan(θ/2).
3 Monte Carlo Simulated Samples
Simulated samples of signal events, used for optimizing selection cuts and for estimating selection ef- ficiency, were generated in the context of a GGM model with a wino-like neutralino NLSP. The model was simplified in the sense that only the key features of the GGM scenario were modeled without con- sidering, for example, the details of the mass spectrum or the potential origin of the model. These key features are determined by the mass of the wino, set by the model parameter M
2, and, for strong produc- tion, by the mass of the gluino, set by M
3. These two parameters were allowed to take a range of values that covered the expected sensitive range of this search. (See Ref. [21] for the model parameter defini- tions in more detail.) More specifically, MC samples were generated with M
3set to 600 GeV, 700 GeV, 800 GeV, 900 GeV, 1000 GeV and 1500 GeV, and with M
2varied from 100 GeV to M
3 −20 GeV for M
3 ≤800 GeV and 100 GeV to 400 GeV for M
3> 800 GeV. The model parameters that control the other gaugino masses, M
1and µ, and the squark and slepton masses were set to 2.5 TeV. The lifetime of the NLSP was set to ensure prompt decays (cτ
NLS P< 0.1 mm). The full mass spectrum and the gluino branching fractions and decay width were calculated from this set of parameters using SUSPECT 2.41 [27], SDECAY 1.3B1 [28], and HDECAY 3.41 [29]. Simulated events were generated with HER- WIG++ [30]. Cross sections for signal processes involving the production of gluino pairs were calculated to next-to-leading order (NLO) in the strong coupling constant, adding the resummation of soft gluon emission at next-to-leading-logarithmic accuracy (NLO+NLL) [31, 32, 33, 34, 35]. Cross sections for signal processes involving the production of wino pairs were calculated to NLO using PROSPINO2 [31].
In both cases, the nominal cross section and the uncertainty were taken from an envelope of cross sec- tion predictions using different PDF sets and factorisation and renormalisation scales, as described in Ref. [36]. The calculated cross section for a point with m(˜ g)
=1500 GeV and m( ˜ χ
01)
=200 GeV, which is dominated by electroweak-strength production, is 0.94
±0.04 pb, and for a point with m(˜ g)
=600 GeV and m( ˜ χ
01)
=500 GeV, dominated by strong production, it is 0.68
±0.13 pb.
Expected SM backgrounds were simulated as follows. The ALPGEN [37] MC generator with the
CTEQ6L1 PDF [38] was used to simulate Wγ events, with a requirement that the momentum of the
photon in the plane transverse to the beam direction ( p
T) satisfy p
T> 40 GeV. ALPGEN matrix elements
were generated with up to five partons, and MLM matching [37] was used to interface the matrix elements
to HERWIG for parton showering and fragmentation. The Wγ cross section was normalized to the value
measured in Ref. [39]. GGM signal contamination would be negligible in the selection used to measure
the cross section. The WHIZARD [40] MC generator with the CTEQ6L1 PDF was used to simulate t tγ ¯
events, requiring that at least one photon has p
T> 8 GeV, and excluding events for which both top quarks
decay hadronically. HERWIG was used for parton showering and fragmentation, with additional photon
radiation added via PHOTOS [41]. To account for higher-order processes, the cross section measured
from WHIZARD was multiplied by a k-factor of 2.55
±0.50 [42]. The MC@NLO [43, 44] generator,
including full NLO QCD corrections, was used to simulate t t ¯ production. The CTEQ6.6m PDF [45] was
used. The t¯ t cross section was estimated at next-to-next-to-leading-order (NNLO) using Hathor 1.2 [46],
making use of the MSTW2008 90 % NNLOPDF sets [47]. To avoid double-counting with the t tγ ¯ sample,
events with a photon with p
T> 8 GeV and invariant masses between massless matrix-element partons
greater than 5 GeV were removed from the t t ¯ samples. Zγ events were generated with SHERPA [48],
requiring that at least one photon has p
T> 40 GeV. The electron and muon events were generated
with the CTEQ6.6M PDF while the tau events used CT10 [49]. The normalization is as calculated by
SHERPA. W
+jets and Z
+jets events were generated with ALPGEN, with matrix elements including up
to five partons, and interfaced to HERWIG for the simulation of showering and fragmentation, and used
the CTEQ6L1 PDF. The Z
+jets sample was normalized to the inclusive Z boson cross section calculated
at NNLO in QCD via the FEWZ [50] program. W
+jets events with a photon with p
T> 40 GeV were
removed to avoid overlap with the Wγ sample. Similarly, Z
+jets events with p
T> 40 GeV and the same
∆R(e, γ) selection as used to generate the
Zγ MC sample (which differed for e/µ and τ) were removed to avoid double-counting. Two separate single-top production processes were simulated. Wt events were generated using MC@NLO, including full NLO QCD corrections, and interfaced to HERWIG for the simulation of showering and fragmentation. The CTEQ6.6m PDF was used. Single-top events produced via t-channel processes were generated with the AcerMC [51] MC generator, with parton showering and fragmentation performed by PYTHIA, and with the final-state W boson decaying leptonically. The LO**, LHAPDF 20651 modified LO PDFs [52] were used. The reference cross sections were taken from Ref. [53] and Ref. [54], respectively. The background from single-top events produced via the s-channel was found to be negligible. Diboson (WW, WZ, and ZZ) events were generated with SHERPA using the CT10 PDF, with cross sections provided by MCFM [55]. A γγ sample was also generated by SHERPA, with the LO cross section enhanced by a k-factor of 1.2. Samples making use of PYTHIA [56] and HERWIG [57, 58] use a set of parameters tuned by ATLAS for its 2011 Monte Carlo generation [59].
For signal and background samples making use of HERWIG, JIMMY [60] was used to simulate activity due to the underlying event.
All signal and background samples were passed through a GEANT4-based simulation of the ATLAS detector [61, 62] and were reconstructed with the same algorithms used for the data. The variation of the number of pp interactions per bunch crossing (pile-up) as a function of the instantaneous luminosity was taken into account by overlaying simulated minimum bias events according to the observed distribution of the number of pile-up interactions in data, with an average of
∼10 interactions.
4 Object Definitions
The reconstruction of converted and unconverted photons is described in Ref. [63]. Converted photons have tracks from a conversion vertex matching a cluster of cells in the calorimeter, while unconverted ones do not. For comparison, electrons have a track matched to the cluster. An object that originates from one cluster of cells in the calorimeter can be considered as both a photon and an electron.
Photon candidates were required to be within
|η
|< 2.37, and to be outside the transition region 1.37 <
|η
|< 1.52 between the barrel and end-cap calorimeters. The standard signal photons were required to pass the ‘TightAR’ criteria, which makes use of the characteristics of the longitudinal and transverse shower development in the EM calorimeter to separate photons from jets. Fine granularity in η in the first layer of the calorimeter was used to reject π
0mesons. Furthermore, as part of the TightAR criteria, in the case that a calorimeter cluster was identified as both a photon and an electron, a classification algorithm based on the electron track and the conversion track and vertex qualities, if any, was applied, and the object was potentially classified as a photon only if the photon interpretation was preferred. Additionally, even if the algorithm favored the photon interpretation, if the object interpreted as an electron fulfilled all the signal electron criteria, then the electron interpretation was chosen.
An isolation requirement was imposed on the signal photons. Photon candidates were removed if more than 5 GeV of transverse energy was observed in a cone of
∆R≡ p(∆η)
2+(∆φ)
2< 0.2 surround- ing the photon’s deposition in the calorimeter, after correcting for contributions from pile-up and the E
Tleakage from the photon itself,
The reconstruction of electrons is described in Ref. [64]. Electron candidates were required to be within
|η
|< 2.47, again excluding the transition region 1.37 <
|η
|< 1.52. Signal electrons were required to pass the ‘medium++’ selection criteria, which is based on the characteristics of the EM shower de- velopment, the quality of the associated reconstructed track, and the closeness of the match between the track and the calorimeter deposition. Electron candidates were removed if more than 10% of the elec- tron’s p
Twas contained in tracks in a cone of
∆R< 0.2 after removing the track ascribed to the electron itself.
The reconstruction of muons is described in [65]. A reconstructed track was identified as having
arisen from the passage of a muon if it met statistical requirements for its combination with a track from the MS, or for its consistency with the location of several MS hits. Muon candidates were required to be within
|η
|< 2.4, and the signal muons were required to have the sum of track p
Tcontained in a cone of size
∆R< 0.2 be less then 1.8 GeV, after removing the track of the muon itself.
Jets were reconstructed using the anti-k
Tjet algorithm [66] with four-momentum recombination and distance parameter R
=0.4. They were required to have p
T> 20 GeV [67]. The analysis made no explicit jet requirement.
The measurement of the two-dimensional transverse momentum vector
pmissT(and its magnitude E
Tmiss) was based on energy deposits in calorimeter cells inside three-dimensional clusters with
|η
|<
4.5. The cluster energy was calibrated to correct for the different response to electromagnetically- and hadronically-induced showers, energy loss in dead material, and out-of-cluster energy. The contribution from identified muons was accounted for by subtracting the small energy deposit of the muon in the calorimeter and adding the muon object p
T[68].
5 Event Selection and Background Modeling
This analysis used 4.8 fb
−1of data in the electron channel and 4.7 fb
−1in the muon channel. Electron- channel candidate events were selected by a trigger requiring at least two loose electron or photon candi- dates, each with a transverse energy E
T> 20 GeV. In earlier running periods, muon-channel candidate events were selected by a trigger requiring at least one muon with p
T> 18 GeV. In later periods, in order to maintain a tractable trigger rate with the increased instantaneous luminosity, a jet requirement in the first level of the trigger with E
T> 10 GeV was added to the muon requirement. (The photon fires the jet part of the trigger with nearly full efficiency.) To ensure that the candidate events resulted from a beam collision, they were required to have at least one primary vertex candidate with five or more associated tracks, and several event cleaning criteria were applied to veto events that were likely from beam halo or cosmic ray muons or from detector noise [67].
A simple truth-level optimization was performed to find the photon p
T, E
missT, and m
Trequire- ments that maximized the expected signal significance,
√2[(s
+b) ln(1
+s/b)
−s], where s and b are the expected signal and background abundances. The signal point used for the optimization was with m(˜ g)
=600 GeV and m( ˜ χ
01)
=200 GeV, where the low mass of the wino was chosen to improve the sensitivity in the expected reach for electroweak production.
Electron-channel candidate events were required to have at least one isolated photon with p
T>
100 GeV, at least one isolated electron with p
T> 25 GeV, no identified muons with p
T> 25 GeV, and
|
m
eγ −m
Z|> 15 GeV, where m
Z =91.2 GeV is the Z -boson mass. Muon-channel candidate events were required to have at least one isolated photon with p
T> 85 GeV, at least one isolated muon with p
T> 25 GeV, and no identified electrons with p
T> 25 GeV. The somewhat-relaxed value of the muon- channel photon p
Tcut reflects the lower background in the muon channel. Both electron- and muon- channel candidate events were further required to have a minimum angular separation
∆R(ℓ, γ)> 0.7 between the leading lepton and photon candidates.
The γ
+ℓ
+E
missTevents were further separated into mutually-exclusive signal and control samples through requirements on E
missTand the transverse mass (m
T), defined as
m
T = r2p
ℓTE
Tmiss1
−cos
∆φℓ,pmiss T
(1)
where ℓ refers to either the electron or muon. W boson events exhibit an edge at m
T =m
W, so requiring
large m
Tsuppresses the dominant W
+X background. The selection requirements, E
Tmiss> 100 GeV and
m
T> 100 GeV, define the signal region (SR). The presence of energetic gravitinos and neutrinos tends
to produce substantial E
Tmissin GGM events, and GGM events are not subject to the m
Tedge but tend to
instead have higher values of m
T. A W-boson-rich control region (WCR) was defined via intermediate requirements on both E
Tmissand m
T. A high-E
Tmisscontrol region (HMET) required a value of E
missTof at least 80 GeV – nearly as large as that of the signal region – but that the value of m
Tbe intermediate (so as to be orthogonal to the SR). Similarly, a high-m
Tcontrol region (HMT) was defined by requiring large m
Tbut intermediate E
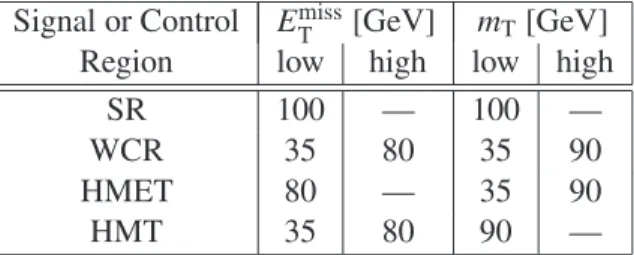
Tmiss. The requirements for the signal and control regions are summarized in Table 1.
Signal or Control E
Tmiss[GeV] m
T[GeV]
Region low high low high
SR 100 — 100 —
WCR 35 80 35 90
HMET 80 — 35 90
HMT 35 80 90 —
Table 1: Requirements applied to E
missTand m
Tto define the signal region (SR) and various control regions (WCR, HMET, HMT) discussed in the text.
Including the lepton-plus-photon branching fraction, the SR acceptance for a point with m(˜ g)
=1500 GeV and m( ˜ χ
01)
=200 GeV is (2.6
±0.1)
×10
−3in the electron channel and (2.9
±0.1)
×10
−3in the muon channel. The errors given are due to MC sample statistics; further uncertainties are discussed in Section 6. The greater acceptance in the muon channel is as a result of the lower photon p
Trequirement in that channel. The acceptance for a point with m(˜ g)
=600 GeV and m( ˜ χ
01)
=500 GeV is (6.5
±0.3)
×10
−3in the electron channel and (4.0
±0.2)
×10
−3in the muon channel. In this case, because of the larger wino mass, the photon p
Tspectrum is harder, so there is little penalty in the electron channel from requiring p
T> 100 GeV, while the electron channel benefits from a higher identification and trigger acceptance.
Dominant backgrounds arise from Wγ, t¯ tγ, and fully-leptonic t¯ t production; in the latter case the sig- nature arises through the misidentification of an electron as a photon. These backgrounds were estimated via MC. The rate of electron-to-photon misidentification was found to be well-modeled by a comparison of the rate of reconstructing Z
→eγ in both data and MC. Smaller backgrounds arising from single-top, Z boson, and diboson production were also modeled via MC. The systematic uncertainties associated with the precision of the modeling of these backgrounds are discussed in Section 6.
The rate of jets being misidentified as photons is not modeled sufficiently accurately in the MC.
Therefore, the backgrounds from jets misidentified as photons, which arise from W
+jets and semi- leptonic t t ¯ events, were estimated with the data driven method referred to as the “ABCD method.” In that method, regions A, B, C, and D were defined to contain those events for which the leading photon was tight (tightAR) and isolated, tight and non-isolated, anti-tight and isolated, and anti-tight and non- isolated, respectively. Anti-tight photons are defined as photons that pass the tight photon criteria in the second layer of the EM calorimeter but fail some criteria in the first layer. To the extent that all of the events in regions B, C, and D arose from events for which the leading photon candidate is a mis- reconstructed jet, the number of events in sample A arising from jets mis-reconstructed as photons would be given by
N
Aj→γ=N
BN
CN
D(2)
where N
Xrepresents the number of events in region X. This expression assumes no correlation between the jet misidentification rate of isolated and non-isolated photons, so that N
A/N
C =N
B/N
D. In the analysis corrections for control-region contributions from other processes and from correlations between isolated and non-isolated photons were accounted for using MC, implemented according to Ref. [39].
The number of data events, however, was too small to apply the ABCD method directly in the SR.
Instead, the method was applied to the various control samples both individually and inclusively. In the electron channel, the photon p
Tcut was further reduced to 50 GeV to increase the event yield. The W
+jets and semi-leptonic t t ¯ MC was scaled to match the predicted yield in the control regions, and the same scale was applied to the MC in the SR to arrive at the estimate there.
The background from γ
+jets events was estimated via the so-called matrix method, in which one solves the system of equations
N
loose =N
loosetrue +N
loosemisid(3)
N
tight =ε
trueN
loosetrue +ε
misidN
misidloose(4) where N
tight(N
loose) is the number of candidate events accumulated under the requirement that the lep- ton candidate satisfy tight (loose) identification criteria and ε
true(ε
misid) represents the fraction of true (misidentified) leptons that pass the tight selection, given that they also pass the loose selection. An estimate of ε
truewas obtained from Z
→ee or Z
→µµ events. The value of ε
misidwas estimated using a sample of events requiring a loose lepton and with E
Tmiss .20 GeV and m
T .20 GeV, but otherwise satisfying the signal region selection criteria. The actual E
Tmissand m
Tcut values were varied to check for stability, and real lepton leakage was subtracted using MC.
The efficiency of the diphoton trigger required of electron-channel events was estimated using a boot- strap method [26]. The muon trigger efficiency and uncertainty was used as parametrized for Ref. [69].
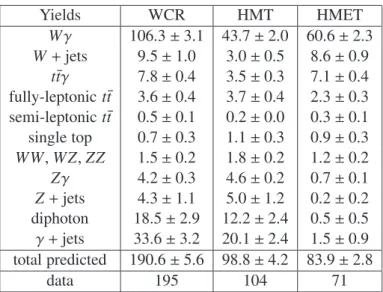
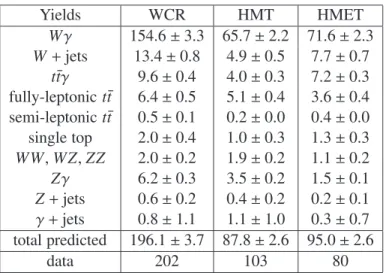
Tables 2 and 3 show the background predictions in the various control regions for the electron and muon channels, respectively. Uncertainties are due to MC or data statistics only; systematic uncertainties will be discussed in the next section. Also shown are the observed numbers of events for each region.
They are found to agree with the expectation.
Yields WCR HMT HMET
Wγ 106.3
±3.1 43.7
±2.0 60.6
±2.3 W
+jets 9.5
±1.0 3.0
±0.5 8.6
±0.9
t tγ ¯ 7.8
±0.4 3.5
±0.3 7.1
±0.4 fully-leptonic t t ¯ 3.6
±0.4 3.7
±0.4 2.3
±0.3 semi-leptonic t¯ t 0.5
±0.1 0.2
±0.0 0.3
±0.1 single top 0.7
±0.3 1.1
±0.3 0.9
±0.3 WW, WZ, ZZ 1.5
±0.2 1.8
±0.2 1.2
±0.2 Zγ 4.2
±0.3 4.6
±0.2 0.7
±0.1 Z
+jets 4.3
±1.1 5.0
±1.2 0.2
±0.2 diphoton 18.5
±2.9 12.2
±2.4 0.5
±0.5
γ
+jets 33.6
±3.2 20.1
±2.4 1.5
±0.9
total predicted 190.6
±5.6 98.8
±4.2 83.9
±2.8
data 195 104 71
Table 2: Numbers of expected background and observed data events for the electron channel in the different control regions. Only statistical uncertainties are given.
Figures 3 and 4 show, separately for the electron and muon channels, the E
Tmissand m
Tdistributions
for the various control regions. The expected backgrounds are represented as stacked histograms. Also
shown are the signal distributions for a signal with (m(˜ g)
=600 GeV; m( ˜ χ
01)
=500 GeV) and (m(˜ g)
=1500 GeV; m( ˜ χ
01)
=200 GeV) after satisfying all selection criteria. In all cases, the background is found
to agree with the data in both shape and normalisation.
[GeV]
mT
50 100 150 200 250 300 350
Data / MC
0 0.5 1 1.5 2 2.5 3
[GeV]
mT
50 100 150 200 250 300 350
Events / 20 GeV
1
10 ATLASPreliminary
data γ t t
t t γ W other GGM (1500, 200) GGM (600, 500) systematics Ldt = 4.8 fb-1
∫
= 7 TeV s e channel
[GeV]
mT
50 100 150 200 250 300 350
Data / MC
0 0.5 1 1.5 2 2.5 3
[GeV]
mT
50 100 150 200 250 300 350
Events / 20 GeV
1 10
ATLASPreliminary data
γ t t t t γ W other GGM (1500, 200) GGM (600, 500) systematics Ldt = 4.7 fb-1
∫
= 7 TeV s channel µ
[GeV]
miss
ET
50 100 150 200 250 300 350 400
Data / MC
0 0.5 1 1.5 2 2.5 3
[GeV]
miss
ET
50 100 150 200 250 300 350 400
Events / 20 GeV
1 10
ATLASPreliminary data
γ t t
t t γ W other GGM (1500, 200) GGM (600, 500) systematics Ldt = 4.8 fb-1
∫
= 7 TeV s e channel
[GeV]
miss
ET
50 100 150 200 250 300 350 400
Data / MC
0 0.5 1 1.5 2 2.5 3
[GeV]
miss
ET
50 100 150 200 250 300 350 400
Events / 20 GeV
1 10
ATLASPreliminary data
γ t t t t γ W other GGM (1500, 200) GGM (600, 500) systematics Ldt = 4.7 fb-1
∫
= 7 TeV s channel µ
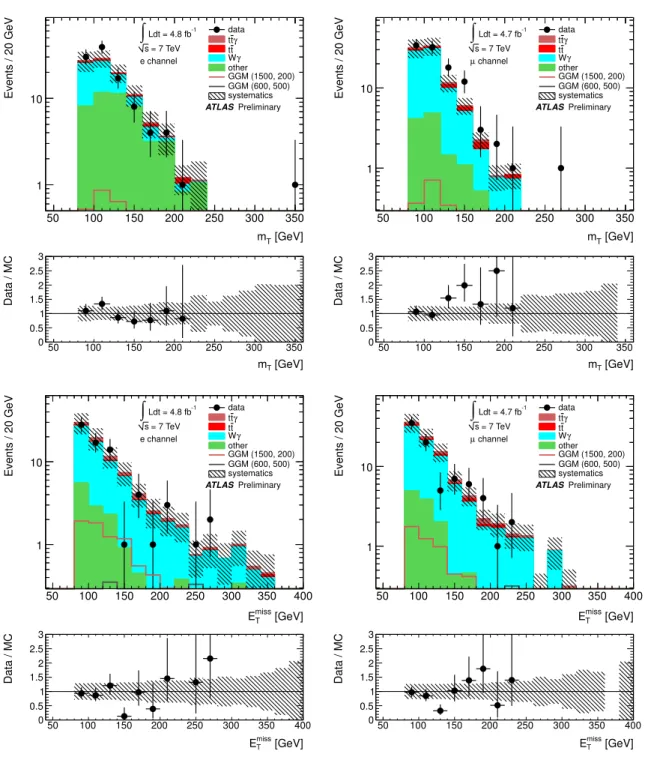
Figure 3: The m
Tdistributions of the HMT samples (top) and the E
Tmissdistributions of the HMET samples (bottom) for the electron (left) and muon (right) channels. The composition of the background estimates and the signal are shown, with the hashing approximating the systematic uncertainties of the background modeling. The error bars represent the Poisson statistical uncertainties of the data. Also shown are the signal distributions for (m(˜ g)
=600 GeV; m( ˜ χ
01)
=500 GeV) and (m(˜ g)
=1500 GeV;
m( ˜ χ
01)
=200 GeV).
[GeV]
mT
20 30 40 50 60 70 80 90 100
Data / MC
0 0.5 1 1.5 2 2.5 3
[GeV]
mT
20 30 40 50 60 70 80 90 100
Events / 5 GeV
0 5 10 15 20 25 30 35
ATLASPreliminary data
γ t t
t t γ W other GGM (1500, 200) GGM (600, 500) systematics
Ldt = 4.8 fb-1
∫
= 7 TeV s e channel
[GeV]
mT
20 30 40 50 60 70 80 90 100
Data / MC
0 0.5 1 1.5 2 2.5 3
[GeV]
mT
20 30 40 50 60 70 80 90 100
Events / 5 GeV
0 5 10 15 20 25 30 35
ATLASPreliminary data
γ t t t t γ W other GGM (1500, 200) GGM (600, 500) systematics
Ldt = 4.7 fb-1
∫
= 7 TeV s channel µ
[GeV]
miss
ET
30 40 50 60 70 80 90
Data / MC
0 0.5 1 1.5 2 2.5 3
[GeV]
miss
ET
30 40 50 60 70 80 90
Events / 5 GeV
0 10 20 30 40 50 60
ATLASPreliminary data
γ t t
t t γ W other GGM (1500, 200) GGM (600, 500) systematics Ldt = 4.8 fb-1
∫
= 7 TeV s e channel
[GeV]
miss
ET
30 40 50 60 70 80 90
Data / MC
0 0.5 1 1.5 2 2.5 3
[GeV]
miss
ET
30 40 50 60 70 80 90
Events / 5 GeV
0 10 20 30 40 50
ATLASPreliminary data
γ t t t t γ W other GGM (1500, 200) GGM (600, 500) systematics Ldt = 4.7 fb-1
∫
= 7 TeV s channel µ
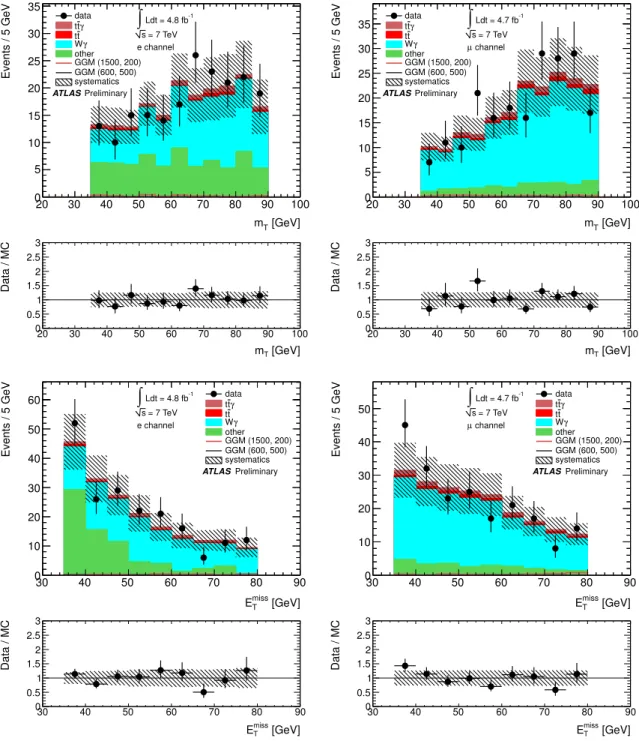
Figure 4: The m
T(top) and E
missT(bottom) distributions of the WCR samples for the electron (left)
and muon (right) channel. The composition of the background estimates and the signal are shown, with
the hashing approximating the systematic uncertainties of the background modeling. The error bars
represent the Poisson statistical uncertainties of the data. Also shown are the signal distributions for
(m(˜ g)
=600 GeV; m( ˜ χ
01)
=500 GeV) and (m(˜ g)
=1500 GeV; m( ˜ χ
01)
=200 GeV).
Yields WCR HMT HMET Wγ 154.6
±3.3 65.7
±2.2 71.6
±2.3 W
+jets 13.4
±0.8 4.9
±0.5 7.7
±0.7
t tγ ¯ 9.6
±0.4 4.0
±0.3 7.2
±0.3 fully-leptonic t t ¯ 6.4
±0.5 5.1
±0.4 3.6
±0.4 semi-leptonic t¯ t 0.5
±0.1 0.2
±0.0 0.4
±0.0 single top 2.0
±0.4 1.0
±0.3 1.3
±0.3 WW, WZ, ZZ 2.0
±0.2 1.9
±0.2 1.1
±0.2 Zγ 6.2
±0.3 3.5
±0.2 1.5
±0.1 Z
+jets 0.6
±0.2 0.4
±0.2 0.2
±0.1
γ
+jets 0.8
±1.1 1.1
±1.0 0.3
±0.7
total predicted 196.1
±3.7 87.8
±2.6 95.0
±2.6
data 202 103 80
Table 3: Numbers of expected background and observed data events for the muon channel in the different control regions. Only statistical uncertainties are given.
6 Systematic Uncertainties
Systematic uncertainties arose in the estimation of the delivered luminosity (3.9 % [70, 71]), in the mod- eling of backgrounds, the estimation of the signal acceptance as a function of gluino and wino mass, and in the calculation of the signal cross sections.
For the modeling of backgrounds, an important systematic uncertainty stemmed from the background fiducial cross section estimates, with that of Wγ being the dominant one. The Wγ cross section was nor- malized to the measured value for p
T> 60 GeV and any number of jets [39], and the 9.5 % uncertainty in the measured cross section was applied as an uncertainty to the background model. Another 15 % uncertainty was added to account for differences in the MC normalization factor calculated for different values of jet multiplicity and photon p
T. A further uncertainty of 21% was added to cover differences in the Wγ yield in the SR predicted by the SHERPA and ALPGEN MC generators. These sources of system- atic effects led to an uncertainty of 1.7 (2.4) events in the electron-channel (muon-channel) background prediction.
Also significant was the uncertainty on the fiducial t tγ ¯ cross section. The rate of t tγ ¯ production was scaled by a factor of 2.55
±0.50 to account for NLO QCD corrections [42, 72], where the uncertainty is from a comparison of the k-factors calculated at renormalization scales of m
tand m
t¯t. The resulting 20 % uncertainty was doubled to 40 % to take into account possible additional uncertainties arising from the stringent SR selection. This uncertainty corresponds to an uncertainty of 0.9 events in both the electron- and muon-channel background predictions.
The fully-leptonic t t ¯ fiducial cross section uncertainty was found to be 0.2 (0.3) events in the electron- channel (muon-channel) background prediction, and the W
+jets uncertainty was 0.3 events. TheW
+jets uncertainty includes uncertainties related to the ABCD method, though the theory uncertainties domi- nate. Smaller uncertainties arose from the uncertainty in the fiducial cross sections of other contributing background channels, mainly Z, diboson, single top, and semi-leptonic t t. ¯
Another important uncertainty in the MC background modeling was due to the E
missTand m
Tselection
of the SR. Reconstructed values for E
Tmissand m
Tare affected by uncertainties in the calorimeter energy
scale and in the muon momentum scale. The E
missTand m
Tuncertainties were treated together and
assumed to be fully correlated. The clusters in the calorimeter had their energy scale shifted up and
down by their uncertainties in order to evaluate the systematic effects in the SR. As an example, this
produced an uncertainty of
+28.0 % −21.2 % (+13.2 %
−9.8 %) in the electron (muon) channel for the Wγ sample. Furthermore, the p
Tof the muon used in the E
missTcalculation was smeared and the E
missTand m
Twere recalculated. The uncertainty was negligible in the electron channel, but for the Wγ sample, an uncertainty of 2.7 % was found in the muon channel. The E
missTand m
Tuncertainties for the t tγ ¯ and fully-leptonic t¯ t samples were found to be of similar size. The resulting uncertainty in the total background prediction arising from the E
Tmissand m
Trequirements was found to be 2.4 (2.0) events in the electron-channel (muon-channel) in the SR.
An uncertainty of 4.0 % was assigned to the photon reconstruction efficiency by comparing the effi- ciency predicted by a data-driven method [63] and the standard method, which shifts the photon shower variables of the MC samples to have the same mean as the corresponding variables of photons in data. An uncertainty of 1.8 % arose from possible mismodeling of the rate of reconstructing a converted photon as unconverted and vice versa, and an uncertainty of 1.0 % was added due to the uncertainty on the effi- ciency of the photon isolation requirement [73]. Varying the photon energy scale by its uncertainty [64]
yielded an uncertainty of 1.3 % to 4.0 % on the different backgrounds, and varying the energy resolution yielded an uncertainty of 1.0 %. Together, the photon efficiencies resulted in uncertainty of 0.6 (0.8) events in the electron-channel (muon-channel) background modeling.
An uncertainty of 0.2 events was assigned to the electron-channel background modeling to account for possible mismodeling of the electron-reconstruction efficiency [64], and 0.3 events due to the trig- ger. Similarly, an uncertainty of 0.3 events was assigned to the muon channel background modeling to account for for possible mismodeling of the muon-reconstruction [65, 74] and trigger efficiencies.
A relative uncertainty of 4.4 % was ascribed to the imprecise knowledge of the mean number of pile-up interactions per event, leading to a further uncertainty of 0.6 (0.7) events in the electron-channel (muon-channel) background prediction. In the electron channel, a γ
+jets uncertainty of 0.3 events was also added, dominated by the limited statistics used in the SR to which the matrix method was applied. Including all the systematics effects mentioned above with the luminosity uncertainty and MC statistical uncertainties of 1.2 (0.9) events results in a total systematic uncertainty of 3.4 (3.6) events in the background modeling of the electron-channel (muon-channel). Table 4 summarizes the systematic uncertainties per background source.
Several of the systematic uncertainties in the background modeling also apply to the signal efficiency and acceptance, with the dominant sources summarized in Table 5 for two characteristic points in the signal parameter space. The m(˜ g)
=1500 GeV, m( ˜ χ
01)
=200 GeV point is dominated by electroweak production while the m(˜ g)
=600 GeV, m( ˜ χ
01)
=500 GeV point is dominated by strong production. The uncertainty on the signal acceptance due to the correlated E
Tmissand m
Tuncertainties varies between (20
−40) % for small wino masses to (1
−2) % for larger wino masses. For low wino masses the E
missTand m
Trequirements fall in the center of the distributions, hence the large uncertainties, while the cuts are in the tails of distributions for large wino masses. The photon systematics are the same as in the background modeling, except that the uncertainty in the photon energy scale produced variation from
< 0.1 % for large wino masses to as much as 3.0 % for lower wino masses. The effect of the imprecise knowledge of the mean number of pile-up interactions per event was studied and found to be negligible.
The theoretical uncertainty on the estimation of the production cross section of the signal was esti-
mated as outlined in Ref. [36]. The magnitude of this uncertainty varies from as little as 4 % for low
wino mass and high gluino masses, for which the cross section is dominated by electroweak production,
to as much as 26 % for points for which both the gluino and wino masses are large, for which strong
production dominates.
Yields electron channel muon channel Wγ 6.1
+2.5−2.38.6
+2.9−2.8W
+jets 0.5
±0.4 0.3
+0.4−0.3t¯ tγ 2.2
±1.0 2.3
±1.0
fully-leptonic t t ¯ 1.5
±0.4 2.3
+0.6−0.8semi-leptonic t t ¯ 0.02
+0.06−0.020.03
+0.17−0.01single top 0.2
+0.1−0.20.4
±0.2 WW, WZ, ZZ 0.9
±0.2 0.7
±0.3
Zγ 0.2
±0.1 0.3
±0.1
Z
+jets 0.8
±0.7 0.1
±0.1 diphoton 0.5
+0.7−0.5
–
γ
+jets 0.1
±0.3 –
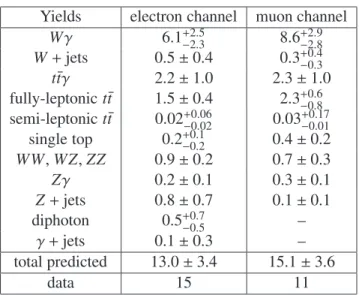
total predicted 13.0
±3.4 15.1
±3.6
data 15 11
Table 4: Numbers of expected background and observed data events in the SR. The uncertainties include statistical and systematic effects.
Electron Channel Muon Channel
Systematic
1500, 200 600, 500 1500, 200 600, 500
trigger 2.0 % 2.0 %
lepton identification 1.9 % 0.4 %
photon identification 4.6 % 4.6 %
photon p
Trequirement 1.2 % 0.2 % 1.4 % 0.1 %
E
missT, m
T +6.1 % -7.5 %2.2 %
+5.4 % -5.5 % +0.0 % -0.8 %Total
+8.2 % -9.3 %5.8 %
+7.4 % -7.5 % +7.5 % -7.6 %Theory 3.9 % 19.4 % 3.9 % 19.4 %
Table 5: A summary of the systematic uncertainties on the signal efficiency times acceptance for two
characteristic points in the parameter space. The m(˜ g)
=1500 GeV, m( ˜ χ
01)
=200 GeV point is a rep-
resentative point for electroweak production while the m(˜ g)
=600 GeV, m( ˜ χ
01)
=500 GeV point is
representative for strong production. Also included is the theoretical uncertainty of the two points.
7 Results
Table 4 shows the yields in the signal region including systematic uncertainties, and Fig. 5 shows the E
Tmissand m
Tdistributions in the signal regions. No excess is seen.
Limits were extracted using the CL
sprescription [75] with a profile log-likelihood ratio test. Un- certainties on the background and signal expectations were treated as Gaussian-distributed nuisance parameters in the maximum likelihood fit. The electron and muon channels were treated as indepen- dent channels and were combined statistically for the model-dependent limit setting. Uncertainties of the same type, for example, on the photon reconstruction, were considered to be correlated between the two channels. Furthermore, uncertainties of the same type were considered to be correlated for all the different MC samples, whether background or signal.
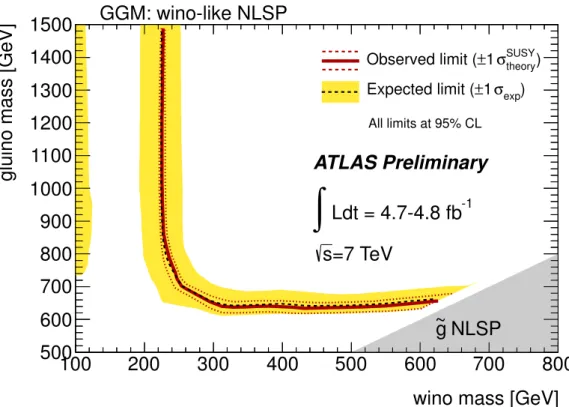
Treating the electron and muon channels separately, it was found that visible cross sections, defined as the production cross section times efficiency times acceptance, above 2.7 fb (1.8 fb) in the electron (muon) channel can be excluded at 95 % CL. These two channels were also combined to set limits in the GGM scenario with a wino-like NLSP. Figure 6 shows the results in the plane of gluino mass versus wino mass. Three contours are shown for the observed limits, corresponding to the nominal SUSY production cross section as well as those derived by reducing and increasing the cross section by one standard deviation of the combined theoretical uncertainty (the combined uncertainty due to the PDFs and renormalisation and factorisation scales). It was found that gluinos masses below 619 GeV were excluded at 95 % CL for any wino mass less than the excluded gluino mass. Wino masses less than 221 GeV were excluded at 95 % CL for any value of the gluino mass.
8 Conclusions
A search for SUSY in events with at least one photon, at least one electron or muon, and substantial E
Tmissis presented. The search for the electron (muon) signature was performed using 4.8 fb
−1(4.7 fb
−1) of 7 TeV pp collision data recorded with the ATLAS detector at the LHC. No excess of events was observed above the Standard Model prediction and model-independent exclusion limits for new physics were set. In addition, in the context of a generalized model of gauge-mediated supersymmetry breaking featuring production of gluino pairs and a wino-like next-to-lightest supersymmetric partner, gluinos masses below 619 GeV were excluded for any wino mass less than the excluded gluino mass. For the same model, the lack of observation of direct gaugino production excludes wino masses of less than 221 GeV for any value of the gluino mass.
9 Acknowledgements
We thank CERN for the very successful operation of the LHC, as well as the support staff from our institutions without whom ATLAS could not be operated efficiently.
We acknowledge the support of ANPCyT, Argentina; YerPhI, Armenia; ARC, Australia; BMWF and FWF, Austria; ANAS, Azerbaijan; SSTC, Belarus; CNPq and FAPESP, Brazil; NSERC, NRC and CFI, Canada; CERN; CONICYT, Chile; CAS, MOST and NSFC, China; COLCIENCIAS, Colombia;
MSMT CR, MPO CR and VSC CR, Czech Republic; DNRF, DNSRC and Lundbeck Foundation, Den- mark; EPLANET and ERC, European Union; IN2P3-CNRS, CEA-DSM/IRFU, France; GNSF, Georgia;
BMBF, DFG, HGF, MPG and AvH Foundation, Germany; GSRT, Greece; ISF, MINERVA, GIF, DIP
and Benoziyo Center, Israel; INFN, Italy; MEXT and JSPS, Japan; CNRST, Morocco; FOM and NWO,
Netherlands; RCN, Norway; MNiSW, Poland; GRICES and FCT, Portugal; MERYS (MECTS), Roma-
nia; MES of Russia and ROSATOM, Russian Federation; JINR; MSTD, Serbia; MSSR, Slovakia; ARRS
[GeV]
mT 100 150 200 250 300 350 400 450 500
Data / MC
0 0.5 1 1.5 2 2.5 3
[GeV]
mT
100 150 200 250 300 350 400 450 500
Events / 20 GeV
0 1 2 3 4 5 6 7
ATLASPreliminary data
γ t t
t t γ W other GGM (1500, 200) GGM (600, 500) systematics Ldt = 4.8 fb-1
∫
= 7 TeV s e channel
[GeV]
mT 100 150 200 250 300 350 400 450 500
Data / MC
0 0.5 1 1.5 2 2.5 3
[GeV]
mT
100 150 200 250 300 350 400 450 500
Events / 20 GeV
0 2 4 6 8 10
ATLASPreliminary data
γ t t t t γ W other GGM (1500, 200) GGM (600, 500) systematics Ldt = 4.7 fb-1
∫
= 7 TeV s channel µ
[GeV]
miss
ET
100 150 200 250 300 350 400 450 500
Data / MC
0 0.5 1 1.5 2 2.5 3
[GeV]
miss
ET
100 150 200 250 300 350 400 450 500
Events / 20 GeV
0 1 2 3 4 5 6 7 8
ATLASPreliminary data
γ t t
t t γ W other GGM (1500, 200) GGM (600, 500) systematics Ldt = 4.8 fb-1
∫
= 7 TeV s e channel
[GeV]
miss
ET
100 150 200 250 300 350 400 450 500
Data / MC
0 0.5 1 1.5 2 2.5 3
[GeV]
miss
ET
100 150 200 250 300 350 400 450 500
Events / 20 GeV
0 2 4 6 8 10
ATLASPreliminary data
γ t t t t γ W other GGM (1500, 200) GGM (600, 500) systematics Ldt = 4.7 fb-1
∫
= 7 TeV s channel µ
Figure 5: The m
T(top) and E
missT(bottom) distributions of the signal region for the electron (left) and
muon (right) channel. The composition of the background estimates and the signal are shown, with
the hashing approximating the systematic uncertainties of the background modeling. The error bars
represent the Poisson statistical uncertainties of the data. Also shown are the signal distributions for
(m(˜ g)
=600 GeV; m( ˜ χ
01)
=500 GeV) and (m(˜ g)
=1500 GeV; m( ˜ χ
01)
=200 GeV).
wino mass [GeV]
100 200 300 400 500 600 700 800
gluino mass [GeV]
500 600 700 800 900 1000 1100 1200 1300 1400 1500
theory) σSUSY
±1 Observed limit (
exp) σ
±1 Expected limit (
ATLAS Preliminary Ldt = 4.7-4.8 fb
-1∫
=7 TeV s
GGM: wino-like NLSP
NLSP
~ g
All limits at 95% CL