A TLAS-CONF-2017-082 14 December 2017
ATLAS CONF Note
ATLAS-CONF-2017-082
13th December 2017
Search for W 0 → t b in the hadronic final state with the ATLAS detector in √
s = 13 TeV p p collisions
The ATLAS Collaboration
A search for a W
0boson in the W
0→ t b ¯ → q q ¯
0b b ¯ final state is presented using 36 . 1 fb
−1of 13 TeV proton–proton collision data collected by the ATLAS detector at the Large Hadron Collider in 2015 and 2016. The search is interpreted in terms of both left- and right-handed chiral W
0bosons within the mass range of 1–5 TeV. Identification of the hadronically decaying top-quark is done using jet substructure tagging techniques based on the shower deconstruction algorithm. No significant deviation from the Standard Model prediction is observed and the results are expressed as upper limits on the W
0→ t b ¯ production cross section times branching ratio at the 95% confidence level as a function of the W
0-boson mass.
© 2017 CERN for the benefit of the ATLAS Collaboration.
Reproduction of this article or parts of it is allowed as specified in the CC-BY-4.0 license.
1 Introduction
Several theories beyond the Standard Model (SM) involve enhanced symmetries that predict new gauge bosons, usually called W
0or Z
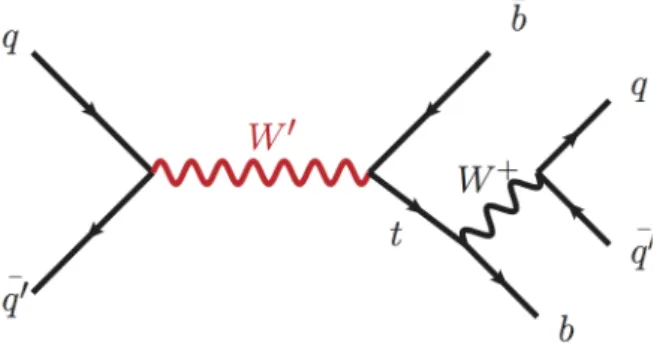
0bosons. The W
0boson is a new charged vector current that can be massive enough to decay into a top quark and a b - quark (as in Figure 1). Many models such as Kaluza–Klein [1], Technicolor [2], Sequential Standard Model [3], or Little Higgs Model [4] predict new vector charged current interactions, some with preferential couplings to quarks or third generation particles [5]. Due to the large mass of the top quark, its interactions decouple from the rest of the phenomenololgy in many theories beyond the SM. A model-independent effective Lagrangian is used to capture the relevant phenomenology of the W
0→ t b ¯ signal [6, 7].
Figure 1: W
0→ t b ¯ Feynman diagram in the hadronic decay channel of the top quark.
Searches for a W
0boson decaying to t b ¯ ,1 classified by the decay products of the W boson originating from the top quark as either leptonic or hadronic, have been performed at the Tevatron [8, 9] and the Large Hadron Collider (LHC) with leptons in the final state [10–13] and in the fully hadronic final state [14].
The specific search for a W
0boson decaying to t b ¯ allows for a right-handed W
0boson.2 Limits on a model-dependent Sequential Standard Model W
L0boson decaying to a lepton and a neutrino have been set previously [15, 16]. The branching fraction for such a W
R0boson decaying to t b ¯ is 10% more than for a W
L0boson decay to t b ¯ . Previous searches in the all-hadronic final state excluded right-handed W
0bosons with masses up to 2 TeV at the 95% confidence level (CL) [14]. A recent search by the CMS collaboration in the lepton+jets final state excluded them up to 3.6 TeV [10].
This analysis searches for a W
0boson decaying to t b ¯ with a mass in the range of 1–5 TeV, in the invariant mass spectrum of the top and b quarks ( m
t b) reconstructed in the fully hadronic channel. This includes the right-handed W
0boson that is not kinematically allowed to decay to a lepton and neutrino ( m
νR> m
W0) and a left-handed W
0boson that can decay to quarks or leptons. The coupling of the W
0boson to quarks is assumed to be the same as the SM W boson. The large resonance mass results in a top quark and a b quark that have high transverse momentum ( p
T).3 The decay products of the top quark become more
1
For simplicity, the notation “ t b ¯ ” is used to describe both the W
0+→ t b ¯ and W
0−→ tb ¯ processes.
2
The leptonic decay mode is not available for the right-handed W
0boson since the right-handed neutrino mass is assumed to be much higher than that of the W
0boson.
3
ATLAS uses a right-handed coordinate system with its origin at the nominal interaction point (IP) in the centre of the detector and the z -axis along the beam pipe. The x -axis points from the IP to the centre of the LHC ring, and the y -axis points upwards. Cylindrical coordinates (r, φ) are used in the transverse plane, φ being the azimuthal angle around the z -axis. The pseudorapidity is defined in terms of the polar angle θ as η = − ln tan ( θ / 2 ) . An angular separation between two objects is defined as ∆R ≡ p
(∆η)
2+ (∆φ)
2, where ∆η and ∆φ are the separations in η and φ . Momentum in the transverse plane is
denoted by p
T.
collimated as the top-quark p
Tincreases, and their showers partially overlap [17]. This high- p
Ttopology is referred to as boosted . The boosted top-quark decay is reconstructed as one single jet. The shower deconstruction (SD) algorithm [18, 19] is employed to select, or tag, jets from boosted top-quark decays.
A signal would be reconstructed as a localised excess in the m
t bdistribution rising above the smoothly falling background originating mostly from jets created by the strong interaction described by quantum chromodynamics (QCD).
2 The ATLAS detector
The ATLAS detector [20] at the LHC covers almost the entire solid angle around the collision point.
Charged particles in the pseudorapidity range | η | < 2.5 are reconstructed with the inner detector (ID), which consists of several layers of semiconductor detectors (pixel and strip) and a straw-tube transition- radiation tracker, the latter extending to | η | < 2.0. The high-granularity silicon pixel detector provides four measurements per track; the closest layer to the interaction point is known as the insertable B-layer (IBL) [21]. The IBL was added in 2014 and provides high resolution hits at small radius to improve the tracking performance. The ID is immersed in a 2 T magnetic field provided by a superconducting solenoid.
The solenoid is surrounded by electromagnetic and hadronic calorimeters, and a muon spectrometer incorporating three large superconducting toroid magnet systems. The calorimeter system covers the pseudorapidity range | η | < 4.9. Electromagnetic calorimetry is provided by barrel and endcap high- granularity lead/liquid-argon (LAr) electromagnetic calorimeters, within the region | η | < 3.2. There is an additional thin LAr presampler covering | η | < 1.8 to correct for energy loss in material upstream of the calorimeters. For | η | < 2.5, the LAr calorimeters are divided into three layers in depth. Hadronic calorimetry is provided by a steel/scintillator-tile calorimeter, segmented into three barrel structures within
| η | < 1.7, and two copper/LAr hadronic endcap calorimeters, which cover the region 1.5 < | η | < 3.2. The forward solid angle up to | η | = 4.9 is covered by copper/LAr and tungsten/LAr calorimeter modules, which are optimised for energy measurements of electrons/photons and for hadrons, respectively. The muon spectrometer (MS) comprises separate trigger and high-precision tracking chambers that measure the deflection of muons in a magnetic field generated by superconducting air-core toroids. The ATLAS detector selects events using a tiered trigger system. The first level is implemented in custom electronics and reduces the event rate from the LHC crossing frequency of 40 MHz to a design value of 100 kHz. The second level is implemented in software running on a general-purpose processor farm which processes the events and reduces the rate of recorded events to 1 kHz [22].
3 Data and simulation samples
This analysis uses proton–proton ( pp ) collision data at a centre-of-mass energy (
√ s ) of 13 TeV collected with the ATLAS detector in 2015 and 2016 that satisfy a number of criteria that ensure that the ATLAS detector was in good operating condition. The amount of data used by this analysis corresponds to an integrated luminosity of 36 . 1 fb
−1. The average number of pp interactions per LHC bunch crossing was 23.7 collisions.
The signal is generated at leading-order (LO) in QCD using a chiral W
0-boson model assuming the same
couplings to the right and left handed fermions as the SM W boson, using MadGraph5_aMC@NLO
v2.2.3 [23]. The W
L0boson couples to all left-handed fermions, the W
R0couples exclusively to the quarks
as the right-handed neutrino is assumed to be more massive than the W
R0. MadGraph is used to simulate the top-quark and W -boson decays, taking spin correlations into account. Pythia v8.186 [24] is used for the modelling of the parton shower and fragmentation. The NNPDF23LO [25] parton distributions function (PDF) and the A14 tune [26] are used for the event generation. All simulated samples are rescaled to next-to-leading order (NLO) calculations using NLO/LO K -factors ranging from 1.3 to 1.4, depending on the mass and handedness of the W
0boson, calculated with Ztop [7]. Signal samples with gauge boson masses between 1 and 3 TeV are generated in 250 GeV steps, and between 3 and 5 TeV in 500 GeV steps and have a natural width of 2.5% relative to the mass of the W
0boson.
The dominant SM background process is from multi-jet production. In order to reduce the dependence on the modelling of the simulation a data-driven method is implemented as described in Section 5. Corrections and uncertainties on that method as discussed make use of QCD di-jet simulation produced by LO Pythia v8.186, LO Herwig++ v2.7.1 [27], LO Sherpa v2.1.1 [28] and Powheg+Pythia and Powheg+Herwig generated with the NLO Powheg-Box v2 [29, 30] generator with Pythia8 and Herwig+Jimmy [31]
for the parton shower simulation, respectively. Vector bosons ( W/Z ) produced in association with jets are included in the data-driven approach as these processes are expected to contribute less than 1% of the multi-jet background. This W /Z +jets prediction is checked using events simulated with the Sherpa v2.2.1 [28] generator and the CT10 proton PDF [32].
Top-quark pair production is an important background with an inclusive cross-section of σ
t¯t= 832
+46−51pb for a top-quark mass of 172 . 5 GeV as obtained from next-to-next-to-leading order and next-to-next-to- leading logarithmic accuracy (NNLO+NNLL) QCD calculations with Top++2.0 [33–39]. Simulated top-quark pair processes are produced using the NLO Powheg-Box v2 generator with the CT10 PDFs.
The parton shower and the underlying event are added using Pythia v6.42 [40] with the Perugia 2012 tune [41]. To increase the number of simulated events at high mass, samples are produced binned in t¯ t mass. Interference and background contributions from the SM s -channel single top process is found to be negligible and is not considered further in this analysis.
All simulated event samples include the effect of multiple pp interactions in the same and neighbouring bunch crossings (pile-up) by overlaying simulated minimum-bias events on each simulated signal or background event so that the pile-up distribution in MC matches that observed in data events. For all MadGraph and Powheg samples, the EvtGen v1.2.0 program [42] is used for the bottom and charm hadron decays. The simulated samples are processed using the Geant4-based ATLAS detector simulation using the same reconstruction procedure as for data [43, 44].
4 Event reconstruction and shower deconstruction
4.1 Event reconstruction
This analysis relies on the reconstruction and identification of jets initiated by the top and b daughters of the
W
0boson. Jets are built from topologically-related energy depositions in the calorimeters with the anti- k
talgorithm [45]. Two radius parameters are used for jet reconstruction: a small radius (small- R ) of 0.4 and
a large radius (large- R ) of 1.0. The momenta of both, large- R and small- R jets are corrected for energy
losses in passive material and for the non-compensating response of the calorimeter [46]. Small- R jets are
also corrected for the average additional energy due to pile-up interactions [47]. Energy depositions from
pileup are removed from large- R jets using the trimming algorithm [48]: the constituents of the large- R
jet are reclustered using the k
tjet algorithm [49, 50] with R = 0.2. Constituent jets contributing less
than 5% of the large- R jet p
Tare removed. The remaining energy depositions are used to calculate the trimmed-jet kinematics and substructure properties. In order to improve on the limited angular resolution of the calorimeter, the mass of a large- R jet is computed using a combination of calorimeter and tracking information [51].
Small- R jets are used to identify jets compatible with originating from a b quark created either directly from the W
0boson or from the top-quark decay. Only small- R jets with p
T> 25 GeV and | η | < 2.5 (in order to be within the coverage of the ID) are considered in this analysis. Additional p
Trequirements are applied to enhance the sensitivity of the search (see Section 5). To reduce the number of small- R jets originating from pile-up interactions, a likelihood discriminant, based on track and vertex information, is used to determine whether the primary vertex4 is the origin of the charged-particle tracks associated with a jet candidate and rejects jets originating from pile-up interactions [52]. This is done only for small- R jets with p
T< 60 GeV and |η| < 2.4. Small- R jets which originate from b quarks are identified using a multivariate b -tagging algorithm [53, 54]. Several observables based on the long life time of b hadrons are used as algorithm inputs to discriminate between b -jets, c -jets and other jets. The b -tagging working point corresponding to an efficiency of 77% to identify b -jets with p
T> 20 GeV, as determined from a sample of simulated t t ¯ events, is found to be optimal for the statistical significance of this search. This provides rejection factors against light-flavour/gluon jets and c -jets of 134 and 6, respectively [54, 55]. Jets identified this way are referred to as b -tagged jets. Since the b -tagging factors are measured in a different p
Tregion, an uncertainty extrapolating the measurement to the high p
Tregion of interest is assigned.
Events with reconstructed electrons [56, 57] or muons [58] are vetoed in order to ensure statistical independence of this analysis with analyses using the leptonic decay of the W boson from the top quark [11]. Electrons and muons with transverse momenta above 25 GeV and selected with criteria similar to those used in Reference [59] are considered for this veto.
4.2 Boosted top-quark identification using shower deconstruction
The SD algorithm can be used for identifying jets compatible with the hadronic decay of a W/Z boson, Higgs boson, or a top quark as well as for discriminating between quark- and gluon-initiated jets. In this analysis, the SD algorithm-based tagger (SD tagger) is used to identify jets originating from the top quark.
The SD tagger calculates likelihoods that a given large- R jet originates from a hadronic top-quark decay or from a high-momentum light quark or gluon. The constituents of the trimmed large- R jet are used to build exclusive subjets [60], and the four-momenta of these subjets are fed as inputs to the SD algorithm.
These subjets are used as substitutes for individual quarks and gluons originating from the hard scatter.
A likelihood weight is calculated for each possible shower history that can lead to the observed subjet configuration. This step is analogous to running a parton shower MC generator in reverse, where emission and decay probabilities at each vertex, colour connections, and kinematic requirements are considered.
For each shower history, a weight is assigned which is proportional to the probability that the assumed initial particle generates the final configuration, taking into account the SM amplitude for the underlying hard process and the Sudakov form factors for the parton shower. The variable called χ
SDis defined as the ratio of the sum of the signal-hypothesis weights to the sum of the background-hypothesis weights.
For a set {p
ki} of N observed subjet four-momenta, where i ∈ [ 1 , N ] , the value of χ
SDis given by:
4
Collision vertices are formed from tracks with p
T> 400 MeV. If an event contains more than one vertex candidate, the one with the highest Í
p
2T
of its associated tracks is selected as the primary vertex.
χ
SD({p
ki}) = Í
perm
P({p
ki}| top-quark jet ) Í
perm
P({p
ki}| gluon/light-quark jet ) ,
where P({p
ki}| top-quark jet ) is built using the weights for the hypothesis that a signal process leads to the observed subjet configuration {p
ki} and P({p
ki}| gluon/light-quark jet ) is built using the weights for the hypothesis that a background process leads to the observed subjet configuration. The sum is over all the shower histories in which signal processes lead to the subjet configuration. The large- R jet is tagged as a top-quark jet if χ
SDis larger than a given value, which is adjusted to achieve the desired tagging efficiency.
There is an internal mechanism in the SD algorithm to suppress pile-up contributions to the jets, through the application of the weights in the likelihood ratio, which contain the probability that a subset of the subjets did not originate from the hard interaction but from pile-up [61].
The SD algorithm selects events that are kinematically compatible with a hadronic top-quark decay. The following requirements are made to optimise the algorithm to achieve a balance between good top-quark jet signal selection efficiency and rejection of gluon/light-quark jet backgrounds: the large- R jet has at least three subjets; two or more subjets must have a combined invariant mass in a window around the W boson mass of 80.3 ± 20.0 GeV; and at least one more subjet can be added to obtain a total mass in a window around the top-quark mass of 172 ± 40 GeV.
The shower deconstruction top tagger was optimised for this analysis so that it is more efficient for top- quark jet signal selection and gluon/light-quark jet background rejection for p
T> 800 GeV compared to the version of the SD tagger first studied by the ATLAS Collaboration [62]. This is done by building subjets obtained by using an exclusive k
talgorithm [60]. First, the k
talgorithm with R = 1.0 is run over the large- R jet constituents and then the k
treclustering is stopped if the splitting scale [63] is larger than 15 GeV. Once the k
treclustering is stopped the reclustered protojets are used as subjets. The 15 GeV requirement is chosen based on the expected discrimination between signal and background events. The optimal number of subjets was found to be less than or equal to six. This reduces the computation time needed for the calculation of χ
SD, which grows exponentially with the subjet multiplicity, without loosing background rejection power.
The signal efficiency working point of the SD tagger is set by applying a selection on the logarithm of χ
SD. The 50% and 80% signal efficiency working points (WP) are used in this analysis (see Section 5). The background rejection for the 50% (80%) signal efficiency WP is 80 (25) for a jet p
Tof 0.45 TeV and 30 (10) for a p
Tof 1.3 TeV. The log χ
SDvariable is studied using samples enriched in hadronically decaying top quarks by selecting t¯ t events where one top quark decays hadronically and the other to lepton+jets for p
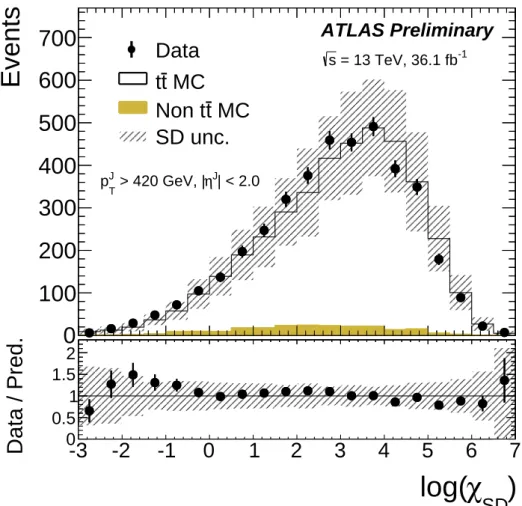
T> 420 GeV. Events are selected in both the electron and the muon decay channels, using criteria similar to those used in Reference [62] and the b quarks from the top-quark decay are used to select top-quark enriched samples. The data are found to be consistent with simulation in the log χ
SDdistribution within the SD tagger uncertainty, described in Section 6, as shown in Figure 2.
5 Event selection and background estimation
An initial selection of events is made at the trigger level requiring at least one small- R jet [22] with p
Tlarger than 380 GeV. To ensure that the analysis is performed in the fully efficient regime of the trigger,
the p
Tof the large- R and small- R jets, used to identify the top- and b -quark daughters from the W
0-boson
Events
0 100 200 300 400 500 600
700 ATLAS Preliminary
= 13 TeV, 36.1 fb
-1Data s
MC t t
MC t Non t SD unc.
| < 2.0 η
J> 420 GeV, |
J
p
TSD ) χ log(
-3 -2 -1 0 1 2 3 4 5 6 7
Data / Pred. 0
0.5 1 1.5
2
Figure 2: Comparison of the log χ
SDdistribution between data (black dots), t t ¯ MC (black line) and background MC (solid yellow) for samples selected to enrich the contribution of hadronically decaying top quarks using selection criteria similar to Reference [62]. The hatched gray band shows the effect of the SD uncertainty described in Section 6.
decay, is required to be larger than 420 GeV. Candidate events must have at least one primary vertex with at least two tracks associated to it.
The top-quark jet candidate is selected from the large- R jets satisfying the requirements defined in Section 4. The large- R jet with the largest value of m
j+ 0 . 15 × m
J, where m
jis the mass of the leading p
Tsmall- R jet with minimum p
T> 25 GeV within ∆R < 1.0 of the large- R jet and m
Jis the mass of the large- R jet, is selected as the top-quark jet candidate. This combination enhances the fraction of events where the selected large- R jet is associated to the top quark, since m
jis less affected by final-state radiation effects which are important at high p
T[64]. The highest p
Tsmall- R jet with p
T> 420 GeV and ∆R larger than 2.0 with respect to the top-quark jet candidate is chosen as the b -quark jet candidate in the event.
The top- and b -tagging criteria are applied to the selected top- and b -quark jet candidates after rejecting
events with the b -quark jet candidate | η | > 1.2, as shown in Figure 3. This improves the signal sensitivity
at high m
t bsince the high p
Tb -quark jets from the W
0boson tend to be more central (smaller | η |) than the
jets from the multi-jet background. The summary of the top- and b -quark jet candidate selection is shown
in Table 1.
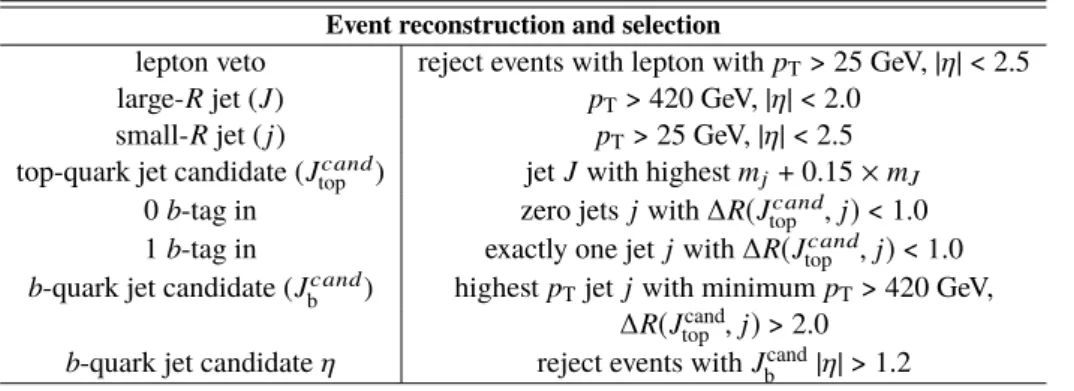
Table 1: Summary of top-quark and b -quark jet candidate selections before categorisation of events into signal and control regions. The selections are defined in Sections 4 and 5. The events satisfying these criteria are grouped into the categories and regions described in Figure 3.
Event reconstruction and selection
lepton veto reject events with lepton with p
T> 25 GeV, | η | < 2.5 large- R jet ( J ) p
T> 420 GeV, | η | < 2.0
small- R jet ( j ) p
T> 25 GeV, | η | < 2.5 top-quark jet candidate ( J
topcand) jet J with highest m
j+ 0.15 × m
J0 b -tag in zero jets j with ∆R(J
candtop
, j) < 1.0 1 b -tag in exactly one jet j with ∆ R(J
topcand, j) < 1.0 b -quark jet candidate ( J
candb
) highest p
Tjet j with minimum p
T> 420 GeV,
∆R(J
candtop
, j ) > 2.0 b -quark jet candidate η reject events with J
candb
| η | > 1.2
Events are divided into two categories: the “1 b -tag in” category and the “0 b -tag in” category. For the “1 b -tag in” category, exactly one b -tagged small- R jet with p
T> 25 GeV with ∆R < 1.0 from the top-quark jet candidate is requested, while for the “0 b -tag in” category, it is required that there be zero b -tagged small- R jets with p
T> 25 GeV within the large- R jet.
The binning of the m
t bdistribution is chosen to balance the sensitivity coming from the different signal and background distribution shapes with the diminishing statistical sensitivity of the data at high m
t b. Requirements are imposed on the number of expected background events per bin and the bin width is adapted to a resolution function that represents the width of the reconstructed mass peak for each studied W
0-boson signal sample. For each m
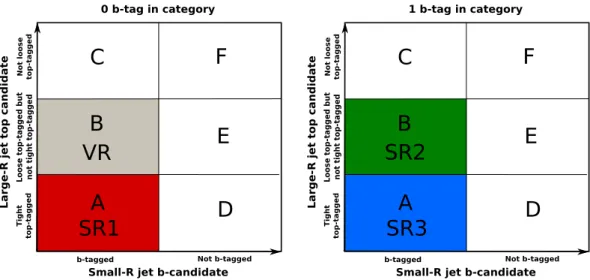
t bbin and in each of the “ b -tag in” categories, the data sample is divided into six regions by using top-tagging and b -tagging criteria, which are described in Figure 3.
The “not loose top-tagged” regions consist of events where the selected top-quark jet candidate fails the loose top-tagged (80% WP) identification criteria, the “loose-but-not-tight top-tagged” regions consist of events where the selected top-quark jet candidate passes the loose top-tagged identification criteria but fails the tight top-tagged criteria (50% WP) and the “tight top-tagged” regions consist of events where the selected top-quark jet candidate passes the tight top-tagged criteria. The signal regions are constructed from events in which the selected small- R jet b -quark jet candidate is b -tagged: signal region SR1 consists of events classified as “tight top-tagged, 0 b -tag in”, signal region SR2 consists of events classified as
“loose-but-not-tight top tagged, 1 b -tag in” and signal region SR3 consists of events classified as “tight top tagged, 1 b -tag in”. A validation region (VR) is defined to test the performance of the data-driven method of estimating the multi-jet + W/Z +jets background. This region consists of events where the b -quark jet candidate is b -tagged, and classified as “loose-but-not-tight top tagged, 0 b -tag in”.
The W
0-boson signal event selection efficiency, for masses below 2.5 TeV, is higher in SR2 and SR3
compared to SR1, due to the requirement of zero b -tagged jets within ∆R < 1.0 of the large- R jet (0 b -tag
in category) in SR1, making the topology less signal-like in SR1. For masses above 2.5 TeV, the signal
efficiency is higher in SR1 than SR2 and SR3 for the same reason: the b -tagging efficiency, decreasing
with p
T, affects SR2 and SR3 more due to the requirement of the additional b -tagged jet. Thus, the addition
of the “0 b -tag in” category improves the signal sensitivity at high W
0-boson masses. The W
0-boson signal
event selection efficiency is about 4% for W
0-boson masses below 2 TeV, decreasing to about 3% for higher
mass points. The differences in the W
R0- and W
L0-boson signal event selection efficiency depend on the
signal region and are on average 10% more for the W
R0-boson signal samples. The difference in efficiency between the W
R0- and W
L0-boson signal samples is due to the different angular separation between the W boson and the b quark from the top-quark decay with respect to the top-quark boost direction for the two different handedness models of the W
0boson, leading to a difference in the overall top-tagging efficiency.
The 2 TeV W
R0-boson signal sample has a selection efficiency of 2.8% in SR1, 3.6% in SR2 and 3.9% in SR3, while the 2 TeV W
L0-boson signal sample has a selection efficiency of 2.3% in SR1, 3.5% in SR2 and 3.4% in SR3.
The dominant background from multi-jet production is estimated directly from data using a six-region
“2D sideband” method that predicts both the shape and normalisation of the m
t bdistribution. These regions are shown in Figure 3.
B E
A D
Tight top-taggedLoose top-tagged but not tight top-tagged
Not b-tagged b-tagged
Large-R jet top candidate
Small-R jet b-candidate
Not loose top-tagged
C F
SR1 VR
0 b-tag in category
B E
A D
Tight top-taggedLoose top-tagged but not tight top-tagged
Not b-tagged b-tagged
Large-R jet top candidate
Small-R jet b-candidate
Not loose top-tagged
C F
SR3 SR2
1 b-tag in category
Figure 3: Illustration of the 2D sideband method showing the two-dimensional plane of the large- R jet substructure variables vs the small- R jet b -tagging information used to estimate the background yield in regions A (B), from the observed yield in the three control regions C,F,D (C,F,E) for the (left) “0 b -tag in” and (right) “1 b -tag in” categories.
The amount of multi-jet + W/Z +jets background in the signal regions and in VR is estimated bin-by-bin in the m
t bdistribution using the observed number of events in the control regions after subtracting the contribution from t¯ t events:
N
bkgA
= R
corrA
·
(NCdata−Ntt¯ C )·(Ndata
D −Ntt¯ D)
NFdata−NFtt¯
and N
bkgB
= R
corrB
·
(NCdata−Ntt¯ C)·(Ndata
E −Ntt¯ E) NFdata−NFtt¯
,
where “bkg” stands for multi-jet background and a small fraction of W/Z +jets, N
bkgA
and N
bkgB
are the number of multi-jet + W/Z +jet background events in regions A and B estimated using this method; N
kdataand N
kt¯t, k= C,D,E,F are the number of observed events and expected t¯ t events in each region, respectively.
The correlation between the top- and b -tagging variables ( R
corr) has been evaluated using five simulated QCD di-jet samples as:
R
corrA
=
NAdi-jet MC·NFdi-jet MCNCdi-jet MC·NDdi-jet MC
and R
corrB
=
NBdi-jet MC·NFdi-jet MCNCdi-jet MC·NEdi-jet MC
,
where N
di-jet MCis the number of events predicted by the QCD di-jet simulation in a given region. The prediction by Pythia is used to correct for this correlation, while the differences in the predictions of the correlation by other QCD di-jet simulations (see Section 3) is used to determine the systematic uncertainty on this 2D sideband method. Experimental systematic uncertainties (see Section 6) are found to have a negligible impact on R
corr. The value of R
corris found to depend on the signal regions and varies between 0.6 at low m
t band 1.3 at high m
t b.
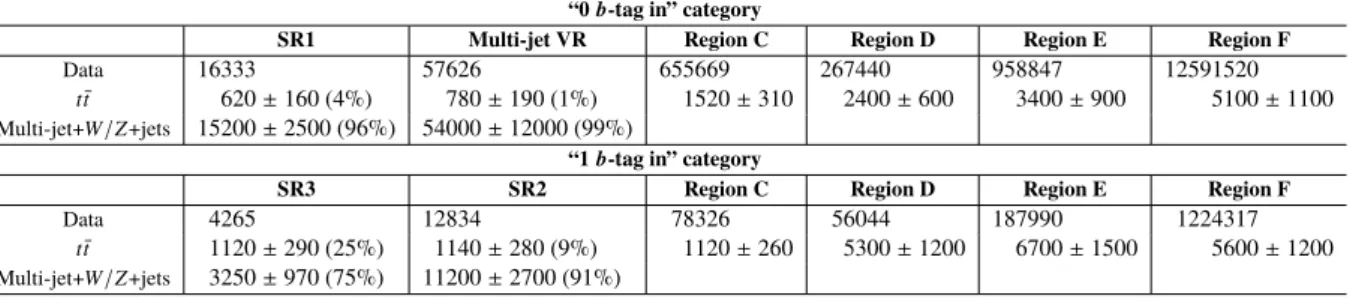
The event yields in the different regions considered are shown in Table 2. The multi-jet background makes up more than 90% of the total background in the SR1, SR2 and VR regions and 75% of the total background in SR3. The contribution of t¯ t events is 4%, 9% and 25% of the total background in SR1, SR2 and SR3. The data are well described by the background model.
Table 2: Event yields in the different regions including the signal regions, SR1, SR2 and SR3. Also shown are the total systematic uncertainties on the estimate of the multi-jet + W /Z +jets and t t ¯ backgrounds in the different regions. The numbers in brackets are the percentage fractions of the total background. For regions C, D, E and F, the amount of multi-jet + W /Z +jets is equal to the amount of data after subtracting the t t ¯ contribution.
“0b-tag in” category
SR1 Multi-jet VR Region C Region D Region E Region F
Data 16333 57626 655669 267440 958847 12591520
t¯t 620±160 (4%) 780±190 (1%) 1520±310 2400±600 3400±900 5100±1100 Multi-jet+W/Z+jets 15200±2500 (96%) 54000±12000 (99%)
“1b-tag in” category
SR3 SR2 Region C Region D Region E Region F
Data 4265 12834 78326 56044 187990 1224317
t¯t 1120±290 (25%) 1140±280 (9%) 1120±260 5300±1200 6700±1500 5600±1200 Multi-jet+W/Z+jets 3250±970 (75%) 11200±2700 (91%)
6 Systematic uncertainties
The sources of systematic uncertainties can be broadly divided into three groups: those of experimental nature, those related to the modelling in simulation, and those related to the data-driven multi-jet back- ground estimation.
The simulated samples are affected by uncertainties related to the description of the detector response.
The dominant detector-related systematic effects are due to the uncertainties on the jet energy scale (JES)
and resolution (JER) [65], on the b -tagging efficiency and mistag rate [54] and on the top tagging. The
uncertainties on the small- R JES, derived as a function of the p
Tand η of the jet, have mainly contributions
related to in situ calibration, the dependence on the pile-up activity and on the flavour composition of
jets [46, 66]. The uncertainty on the scale and resolution of large- R jet energy and mass is evaluated by
comparing the ratio of calorimeter-based to track-based measurements in multi-jet data and simulation [51,
62]. The flavour tagging efficiency and its uncertainty for b -jets [53] is estimated in t t ¯ events, while the
misidentification rate for c -jets and other jets and the corresponding uncertainties are determined using
a t t ¯ enriched region and multi-jet events, respectively. The SD top-tagging uncertainty is estimated by
varying the p
Tof the subjets used as inputs to the SD algorithm by 2.5%. This value is derived using a
procedure described in Reference [62] and is found to cover any data/simulation differences in the log χ
SDdistribution (see Figure 2). Systematic uncertainties for the lepton veto were found to have a negligible
effect.
Flavour tagging simulation-to-data efficiency correction factors [53] depend on the jet p
Tand η . These correction factors have several sources of uncertainty. These are split into uncorrelated components which are then treated independently. Additional uncertainties are considered in the extrapolation of the b -quark jet and c -jet efficiency calibration from low p
T, where there is enough data to do a measurement, to high p
T.
The average number of interactions per bunch crossing is rescaled by 9% to improve the agreement of simulation with data, and an uncertainty, as large as the correction, is considered. Finally, a global normalisation uncertainty of 2.2% is assigned due to the uncertainty of the luminosity measurement [67].
The multi-jet background uncertainties pertain primarily to the estimation method itself. Simulation predictions for the correlation between top- and b -tagging criteria in the multi-jet background estimation is one source of uncertainty; different generators are compared to account for differences in modelling of the matrix element and parton showering. The size of the uncertainty on the total background yield arising from the multi-jet uncertainty is 15.4% in SR1, 21.5% in SR2 and 21.9% in SR3.
The second largest background, from t t ¯ events, is assigned a 6% normalisation uncertainty corresponding to the uncertainty on the process cross section. An additional uncertainty on the modelling of this background is derived from data/simulation differences observed in the top-quark p
Tspectrum in t¯ t differential cross-section measurements [59]. The dependence of this uncertainty as a function of m
t bis approximately linear. It is 13% at m
t b= 1 TeV, 31% at m
t b= 2 TeV, 48% at m
t b= 3 TeV and 65% at m
t b= 4 TeV.
The total systematic uncertainty on the yield is dominated by uncertainties on the 2D sideband method and on the flavour tagging efficiencies. The data statistical uncertainty dominates for m
t b> 2 TeV.
7 Statistical analysis and results
In order to test for the presence of a massive resonance, templates in the variable m
t bobtained from the signal simulated event samples and background events estimated using data-driven methods and simula- tion, are fit to data using a binned maximum-likelihood approach based on the RooStats framework [68, 69]. The fits are performed simultaneously in the three signal regions (see Section 5). The background processes considered in the maximum likelihood fit are the dominant multi-jet background and W/Z +jets, estimated together using the “2D sideband” method (see Section 5), and t t ¯ events (see Table 2 for event yields).
The systematic uncertainties described in Section 6 may change the acceptance and shape of a potential W
0boson signal and the background processes, and are incorporated into the fit as nuisance parameters with log-normal constraints, with correlations across signal regions and signal and background processes taken into account. Some systematic uncertainties, such as the JES, affect the shapes of the histogram templates. These shape systematics are accounted for by introducing nuisance parameters α
kthat describe the possible variation in the shapes of the histograms for each process k . A log-normal constraint with mean 0 and width 1 is applied to each of the α
k. When performing the maximum likelihood fit, all of the α
kare allowed to vary.
The signal ( s ) and background ( b ) expectations are functions of the nuisance parameters θ ® . These functions
are built such that the response of s and b to each θ is factorised from the nominal value ( s
0) of the expected
rate: s( ® θ) = s
0× Ö
ν( ® θ) where ν( ® θ) describe the effect of variations in the nuisance parameters θ ® and similarly for b .
The p -value p
b, representing the compatibility of the data with the background-only hypothesis, is estimated using the log-likelihood ratio (LLR) test statistic and evaluated using the asymptotic approxim- ation [70]. In the absence of any significant excess above the background expectation, upper limits at the 95% confidence level on the signal production cross-section times branching ratio are derived using the CLs method [71].
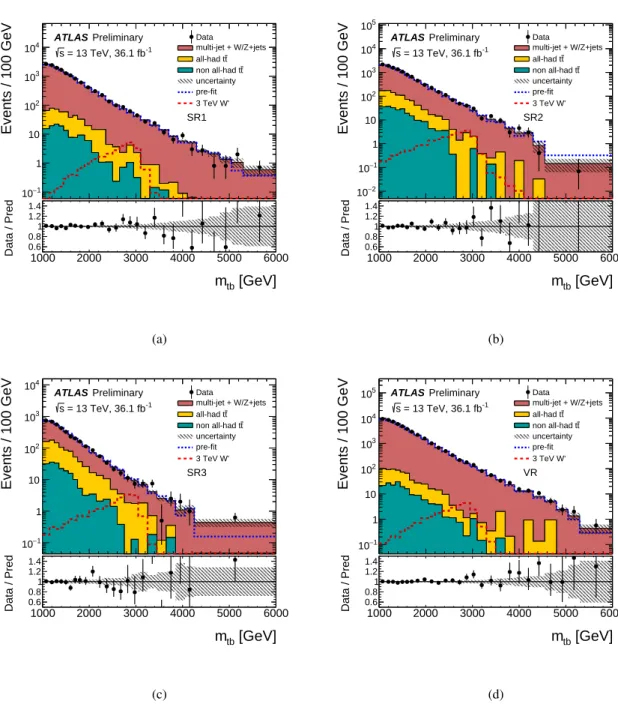
Figure 4 shows the m
t bdistributions in the three signal regions and the validation region after the fit to data. The hatched band in the bottom panel includes the systematic uncertainties described in Section 6 after the fit to data. The most discrepant region at 2.25 TeV is found to have a local significance of 1.96 σ , consistent with a background-only hypothesis. In the absence of any significant excess over the background-only hypothesis, 95% CL limits are derived on the cross section times branching ratio of W
0to t b ¯ decay, as shown in Figure 5, for the right-handed and left-handed couplings. They translate to observed (expected) limits on the mass of a W
0boson, with the same coupling to fermions as the SM W boson, to be above 2.98 (2.99) TeV and 2.85 (2.76) TeV in the right- and left-handed models, respectively. The limits are quoted using a linear interpolation between the 2.75 TeV and 3 TeV W
0-boson signal mass points both for the theoretical cross-section curve in red and the observed and expected limit curves in blue. The solid red band in Figure 5 shows the cross section times branching ratio of W
0to t b ¯ decay calculated with Ztop.
The difference in the mass exclusion limit results between the W
R0- and W
L0-boson signals is mainly due
to different total cross sections ( σ
p p→W· B(W → tb) ) of the two processes as discussed in Section 3.
−1
10 1 10 102
103
104
Events / 100 GeV
ATLAS Preliminary = 13 TeV, 36.1 fb-1
s
SR1 Data
multi-jet + W/Z+jets t all-had t
t non all-had t uncertainty pre-fit 3 TeV W'
1000 2000 3000 4000 5000 6000
[GeV]
m
tb 0.60.8 1 1.2 1.4
Data / Pred
(a)
−2
10
−1
10 1 10 102
103
104
105
Events / 100 GeV
ATLAS Preliminary = 13 TeV, 36.1 fb-1
s
SR2 Data
multi-jet + W/Z+jets t all-had t
t non all-had t uncertainty pre-fit 3 TeV W'
1000 2000 3000 4000 5000 6000
[GeV]
m
tb 0.60.8 1 1.2 1.4
Data / Pred
(b)
−1
10 1 10 102
103
104
Events / 100 GeV
ATLAS Preliminary = 13 TeV, 36.1 fb-1
s
SR3 Data
multi-jet + W/Z+jets t all-had t
t non all-had t uncertainty pre-fit 3 TeV W'
1000 2000 3000 4000 5000 6000
[GeV]
m
tb 0.60.8 1 1.2 1.4
Data / Pred
(c)
−1
10 1 10 102
103
104
105
Events / 100 GeV
ATLAS Preliminary = 13 TeV, 36.1 fb-1
s
VR Data
multi-jet + W/Z+jets t all-had t
t non all-had t uncertainty pre-fit 3 TeV W'
1000 2000 3000 4000 5000 6000
[GeV]
m
tb 0.60.8 1 1.2 1.4
Data / Pred
(d)
Figure 4: Reconstructed m
t bdistributions in data and for the background after the fit to data in the three signal
regions and in the multi-jet validation region: (a) SR1, (b) SR2, (c) SR3, and (d) VR. The top panel shows the
total-background m
t bdistribution before fit to data as the narrow dotted blue line and the 3 TeV W
R0-boson signal
m
t bdistribution as the wider dotted red line. The bottom panel of the plot shows the ratio of data to prediction and
the hatched band includes the systematic uncertainties after the fit to data.
1000 1500 2000 2500 3000 3500 4000 4500 5000 [GeV]
W'R
m
−2
10
−1
10 1 10 tb) [pb] →
RB(W' × )
RW' → (pp σ
Preliminary ATLAS
= 13 TeV, 36.1 fb
-1s
Observed 95% CL limit Expected 95% CL limit
1 s.d.
± Expected 95% CL limit
2 s.d.
± Expected 95% CL limit NLO W' cross section (ZTOP)
1000 1500 2000 2500 3000 3500 4000 4500 5000
[GeV]
W'L
m
−2
10
−1
10 1 10 tb) [pb] →
LB(W' × )
LW' → (pp σ
Preliminary ATLAS
= 13 TeV, 36.1 fb
-1s
Observed 95% CL limit Expected 95% CL limit
1 s.d.
± Expected 95% CL limit
2 s.d.
± Expected 95% CL limit NLO W' cross section (ZTOP)
Figure 5: Observed and expected 95% CL limit on the W
R0- (top) and W
L0- (bottom) boson cross-section times
branching ratio of W
0to t b ¯ decay as a function of the corresponding W
0-boson mass using the SD tagger. The red
solid curves show the theoretical cross-section prediction for the corresponding W
0-boson signal.
8 Summary
A search for W
0→ t b ¯ → q q ¯
0b b ¯ has been presented using 36 . 1 fb
−1of
√ s =13 TeV proton–proton collision data taken with the ATLAS detector. The analysis makes use of jet substructure tagging optimised to select large- R jets originating from hadronically decaying top quarks using the SD algorithm and b - tagging of small- R jets. The observed m
t bspectrum is consistent with the background-only prediction and exclusion limits at 95 % CL are set on the W
0-boson production cross section times branching ratio to t b ¯ decay for right-handed and left-handed couplings as a function of the W
0mass in the range 1–5 TeV. The use of jet substructure techniques allows cross-section limits to be set at high W
0-boson masses, excluding W
0bosons with right-handed couplings with masses below 2.98 TeV and excluding W
0bosons with left-handed couplings with masses below 2.85 TeV. This represents an improvement over previous ATLAS results in this channel due to a higher centre-of-mass energy, luminosity and improvements in the top-tagging techniques, understanding of systematic uncertainties, and statistical treatment.
References
[1] G. Burdman, B. A. Dobrescu and E. Pontón, Resonances from two universal extra dimensions , Phys. Rev. D 74 (2006) 075008, arXiv: hep-ph/0601186 .
[2] E. Malkawi, T. M. Tait and C.-P. Yuan, A model of strong flavor dynamics for the top quark , Phys.
Lett. B 385 (1996) 304, arXiv: hep-ph/9603349 .
[3] J. C. Pati and A. Salam, Lepton number as the fourth "color" , Phys. Rev. D 10 (1974) 275.
[4] D. J. Muller and S. Nandi, Topflavor: a separate SU(2) for the third family , Phys. Lett. B 383 (1996) 345, arXiv: hep-ph/9602390 .
[5] T. D. Lee, A Theory of Spontaneous T Violation , Phys. Rev. D 8 (1973) 1226.
[6] Z. Sullivan, Fully differential W
0production and decay at next-to-leading order in QCD , Phys. Rev.
D 66 (2002) 075011, arXiv: hep-ph/0207290 .
[7] D. Duffty and Z. Sullivan, Model independent reach for W
0bosons at the LHC , Phys. Rev. D 86 (2012) 075018, arXiv: 1208.4858 [hep-ph] .
[8] CDF Collaboration, Search for the Production of Narrow tb Resonances in 1 . 9 fb
−1of pp Collisions at √
s = 1 . 96 TeV, Phys. Rev. Lett. 103 (2009) 041801, arXiv: 0902.3276 [hep-ex] .
[9] D0 Collaboration, Search for W
0→ tb resonances with left- and right-handed couplings to fermions , Phys. Lett. B 699 (2011) 145, arXiv: 1101.0806 [hep-ex] .
[10] CMS Collaboration, Search for heavy resonances decaying to a top quark and a bottom quark in the lepton+jets final state in proton-proton collisions at 13 TeV , (2017), arXiv: 1708 . 08539 [hep-ex] .
[11] ATLAS Collaboration, Search for W
0→ t b ¯ in the lepton plus jets final state in proton-proton collisions at a centre-of-mass energy of √
s = 8 TeV with the ATLAS detector , Phys. Lett. B 743 (2015) 235, arXiv: 1410.4103 [hep-ex] .
[12] CMS Collaboration, Search for a W
0boson decaying to a bottom quark and a top quark in pp collisions at √
s = 7 TeV , Phys. Lett. B 718 (2013) 1229, arXiv: 1208.0956 [hep-ex] .
[13] CMS Collaboration, Search for W
0→ tb decays in the lepton + jets final state in pp collisions at
√ s = 8 TeV , JHEP 05 (2014) 108, arXiv: 1402.2176 [hep-ex] .
[14] ATLAS Collaboration, Search for W
0→ tb → qqbb decays in pp collisions at √
s = 8 TeV with the ATLAS detector , Eur. Phys. J. C 75 (2015) 165, arXiv: 1408.0886 [hep-ex] .
[15] ATLAS Collaboration, Search for a new heavy gauge boson resonance decaying into a lepton and missing transverse momentum in 36 fb
−1of pp collisions at √
s = 13 TeV with the ATLAS experiment , (2017), arXiv: 1706.04786 [hep-ex] .
[16] CMS Collaboration, Search for heavy gauge W
0boson in events with an energetic lepton and large missing transverse momentum at √
s = 13 TeV , Phys. Lett. B 770 (2017) 278, arXiv: 1612.09274 [hep-ex] .
[17] ATLAS Collaboration, Performance of large-R jets and substructure reconstruction with the ATLAS detector , ATLAS-CONF-2012-065, 2012, url: https://cds.cern.ch/record/1459530 . [18] D. E. Soper and M. Spannowsky, Finding physics signals with shower deconstruction , Phys. Rev.
D 84 (2011) 074002, arXiv: 1102.3480 [hep-ph] .
[19] D. E. Soper and M. Spannowsky, Finding top quarks with shower deconstruction , Phys. Rev. D 87 (2013) 054012, arXiv: 1211.3140 [hep-ph] .
[20] ATLAS Collaboration, The ATLAS Experiment at the CERN Large Hadron Collider , JINST 3 (2008) S08003.
[21] ATLAS Collaboration, ATLAS Insertable B-Layer Technical Design Report , (2010), url: https:
//cds.cern.ch/record/1291633 .
[22] ATLAS Collaboration, Performance of the ATLAS trigger system in 2015 , Eur. Phys. J. C77 (2017) 317, arXiv: 1611.09661 [hep-ex] .
[23] J. Alwall, M. Herquet, F. Maltoni, O. Mattelaer and T. Stelzer, MadGraph 5 : going beyond , JHEP 06 (2011) 128, arXiv: 1106.0522 [hep-ph] .
[24] T. Sjöstrand, S. Mrenna and P. Skands, A brief introduction to PYTHIA 8.1 , Comput. Phys. Commun.
178 (2008) 852, arXiv: 0710.3820 [hep-ph] .
[25] R. D. Ball, L. Del Debbio, S. Forte, A. Guffanti, J. I. Latorre et al., A first unbiased global NLO determination of parton distributions and their uncertainties , Nucl. Phys. B 838 (2010) 136, arXiv:
1002.4407 [hep-ph] .
[26] ATLAS Collaboration, ATLAS Pythia 8 tunes to 7 TeV data , ATL-PHYS-PUB-2014-021, 2014, url: https://cds.cern.ch/record/1966419 .
[27] M. Bahr et al., Herwig++ physics and manual , Eur. Phys. J. C 58 (2008) 639, arXiv: 0803.0883 [hep-ph] .
[28] T. Gleisberg et al., Event generation with SHERPA 1.1 , JHEP 02 (2009) 007, arXiv: 0811.4622 [hep-ph] .
[29] S. Alioli, P. Nason, C. Oleari and E. Re, A general framework for implementing NLO calculations in shower Monte Carlo programs: the POWHEG BOX , JHEP 06 (2010) 043, arXiv: 1002.2581 [hep-ph] .
[30] S. Frixione, P. Nason and G. Ridolfi, A positive-weight next-to-leading-order Monte Carlo for heavy
flavour hadroproduction , JHEP 09 (2007) 126, arXiv: 0707.3088 [hep-ph] .
[31] G. Corcella et al., HERWIG 6: An Event generator for hadron emission reactions with interfering gluons (including supersymmetric processes) , JHEP 01 (2001) 010, arXiv: hep-ph/0011363 . [32] H.-L. Lai et al., New parton distributions for collider physics , Phys. Rev. D 82 (2010) 074024,
arXiv: 1007.2241 [hep-ph] .
[33] M. Cacciari, M. Czakon, M. Mangano, A. Mitov and P. Nason, Top-pair production at had- ron colliders with next-to-next-to-leading logarithmic soft-gluon resummation , Phys. Lett. B 710 (2012) 612, arXiv: 1111.5869 [hep-ph] .
[34] M. Beneke, P. Falgari, S. Klein and C. Schwinn, Hadronic top-quark pair production with NNLL threshold resummation , Nucl. Phys. B 855 (2012) 695, arXiv: 1109.1536 [hep-ph] .
[35] P. Bärnreuther, M. Czakon and A. Mitov, Percent-Level-Precision Physics at the Tevatron: Next- to-Next-to-Leading Order QCD Corrections to q q ¯ → t t ¯ + X , Phys. Rev. Lett. 109 (2012) 132001, arXiv: 1204.5201 [hep-ph] .
[36] M. Czakon, P. Fiedler and A. Mitov, Total Top-Quark Pair-Production Cross Section at Hadron Colliders Through O(α
S4) , Phys. Rev. Lett. 110 (2013) 252004, arXiv: 1303.6254 [hep-ph] . [37] M. Czakon and A. Mitov, NNLO corrections to top pair production at hadron colliders: the
quark-gluon reaction , JHEP 01 (2013) 080, arXiv: 1210.6832 [hep-ph] .
[38] M. Czakon and A. Mitov, NNLO corrections to top-pair production at hadron colliders: the all- fermionic scattering channels , JHEP 12 (2012) 054, arXiv: 1207.0236 [hep-ph] .
[39] M. Czakon and A. Mitov, Top++: A program for the calculation of the top-pair cross-section at hadron colliders , Comput. Phys. Commun. 185 (2014) 2930, arXiv: 1112.5675 [hep-ph] . [40] T. Sjöstrand et al., High-energy physics event generation with PYTHIA 6.1 , Comput. Phys. Commun.
135 (2001) 238, arXiv: hep-ph/0010017 .
[41] P. Z. Skands, Tuning Monte Carlo generators: The Perugia tunes , Phys. Rev. D 82 (2010) 074018, arXiv: 1005.3457 [hep-ph] .
[42] D. Lange, The EvtGen particle decay simulation package , Nucl. Instrum. Meth. A 462 (2001) 152.
[43] S. Agostinelli et al., GEANT4: A Simulation toolkit , Nucl. Instrum. Meth. A 506 (2003) 250.
[44] ATLAS Collaboration, The ATLAS Simulation Infrastructure , Eur. Phys. J. C 70 (2010) 823, arXiv:
1005.4568 [physics.ins-det] .
[45] M. Cacciari, G. P. Salam and G. Soyez, The anti-k
tjet clustering algorithm , JHEP 04 (2008) 063, arXiv: 0802.1189 [hep-ph] .
[46] ATLAS Collaboration, Jet Calibration and Systematic Uncertainties for Jets Reconstructed in the ATLAS Detector at √
s = 13 TeV , ATL-PHYS-PUB-2015-015, 2015, url: https://cds.cern.
ch/record/2037613 .
[47] ATLAS Collaboration, Identification and rejection of pile-up jets at high pseudorapidity with the ATLAS detector , Eur. Phys. J. C 77 (2017) 580, arXiv: 1705.02211 [hep-ex] .
[48] D. Krohn, J. Thaler and L.-T. Wang, Jet trimming , JHEP 02 (2010) 084, arXiv: 0912 . 1342 [hep-ph] .
[49] S. Catani, Y. Dokshitzer, M. Seymour and B. Webber, Longitudinally-invariant k
t-clustering al- gorithms for hadron-hadron collisions , Nucl. Phys. B 406 (1993) 187.
[50] S. Ellis and D. Soper, Successive combination jet algorithm for hadron collisions , Phys. Rev. D 48
(1993) 3160, arXiv: 9305266 [hep-ph] .
[51] ATLAS Collaboration, Jet mass reconstruction with the ATLAS Detector in early Run 2 data , ATLAS-CONF-2016-035, 2016, url: https://cds.cern.ch/record/2200211 .
[52] ATLAS Collaboration, Performance of pile-up mitigation techniques for jets in pp collisions at
√ s = 8 TeV using the ATLAS detector , Eur. Phys. J. C 76 (2016) 581, arXiv: 1510 . 03823 [hep-ex] .
[53] ATLAS Collaboration, Performance of b-jet identification in the ATLAS experiment , JINST 11 (2016) P04008, arXiv: 1512.01094 [hep-ex] .
[54] ATLAS Collaboration, Optimisation of the ATLAS b-tagging performance for the 2016 LHC Run , ATL-PHYS-PUB-2016-012, 2016, url: https://cds.cern.ch/record/2160731 .
[55] ATLAS Collaboration, Expected performance of the ATLAS b-tagging algorithms in Run-2 , ATL- PHYS-PUB-2015-022, 2015, url: https://cds.cern.ch/record/2037697 .
[56] ATLAS Collaboration, Electron efficiency measurements with the ATLAS detector using 2012 LHC proton–proton collision data , Eur. Phys. J. C 77 (2017) 195, arXiv: 1612.01456 [hep-ex] . [57] ATLAS Collaboration, Electron reconstruction and identification efficiency measurements with the
ATLAS detector using the 2011 LHC proton–proton collision data , Eur. Phys. J. C 74 (2014) 2941, arXiv: 1404.2240 [hep-ex] .
[58] ATLAS Collaboration, Muon reconstruction performance of the ATLAS detector in proton–proton collision data at √
s = 13 TeV , Eur. Phys. J. C 76 (2016) 292, arXiv: 1603.05598 [hep-ex] . [59] ATLAS Collaboration, Measurements of top-quark pair differential cross-sections in the lepton+jets
channel in pp collisions at √
s = 13 TeV using the ATLAS detector , (2017), arXiv: 1708.00727 [hep-ex] .
[60] M. Cacciari, G. P. Salam and G. Soyez, FastJet user manual , Eur. Phys. J. C 72 (2012) 1896, arXiv:
1111.6097 [hep-ph] .
[61] M. Cacciari, G. P. Salam and G. Soyez, The catchment area of jets , JHEP 04 (2008) 005, arXiv:
0802.1188 [hep-ph] .
[62] ATLAS Collaboration, Identification of high transverse momentum top quarks in pp collisions at
√ s = 8 TeV with the ATLAS detector , JHEP 06 (2016) 093, arXiv: 1603.03127 [hep-ex] . [63] J. M. Butterworth, A. R. Davison, M. Rubin and G. P. Salam, Jet Substructure as a New Higgs-
Search Channel at the Large Hadron Collider , Phys. Rev. Lett. 100 (2008) 242001.
[64] ATLAS Collaboration, Boosted Object Tagging with Variable- R Jets in the ATLAS Detector , ATL- PHYS-PUB-2016-013, 2016, url: https://cds.cern.ch/record/2199360 .
[65] ATLAS Collaboration, Jet energy scale measurements and their systematic uncertainties in proton- proton collisions at √
s = 13 TeV with the ATLAS detector , Phys. Rev. D 96 (2017) 072002, arXiv:
1703.09665 [hep-ex] .
[66] ATLAS Collaboration, Jet global sequential corrections with the ATLAS detector in proton–proton collisions at √
s = 8 TeV , ATLAS-CONF-2015-002, 2015, url: https : / / cds . cern . ch / record/2001682 .
[67] ATLAS Collaboration, Luminosity determination in pp collisions at √
s = 8 TeV using the ATLAS detector at the LHC , Eur. Phys. J. C 76 (2016) 653, arXiv: 1608.03953 [hep-ex] .
[68] L. Moneta, The RooStats Project , Proceedings of Science (2010), arXiv: 1009.1003 [hep-ph] .
[69] M. Baak, HistFitter software framework for statistical data analysis , Eur. Phys. J. C 75 (2015) 153.
[70] G. Cowan, K. Cranmer, E. Gross and O. Vitells, Asymptotic formulae for likelihood-based tests of new physics , Eur. Phys. J. C 71 (2011) 1554, [Erratum: Eur. Phys. J.C73,2501(2013)], arXiv:
1007.1727 [physics.data-an] .
[71] A. L. Read, Presentation of search results: the C L
stechnique , J. Phys. G 28 (2002) 2693.
[72] ATLAS Collaboration, Performance of Top Quark and W Boson Tagging in Run 2 with ATLAS ,
ATLAS-CONF-2017-064, 2017, url: https://cds.cern.ch/record/2281054 .
Appendix
In Run 1, the subjets were defined by running the CA jet algorithm with R = 0.2 over the large- R jet constituents. This definition of the subjets was found to have a low signal efficiency for very high transverse momenta since at very high p
Tregimes, the distance between the decay products of the top quark ( ∆R
t,const) is expected to be lower than 0.2 due to the kinematic boost. As a result, the number of reconstructed subjets is lower than three. This has been improved in this analysis by defining subjets using exclusive jets [60]. The performance obtained by using exclusive jets compared to the Run 1 version of the algorithm is shown in Figure 6. The performance of the exclusive jets SD algorithm is especially better at very large p
T.
Figure 7 shows the signal efficiency as a function of large- R jet p
Tfor the the 50% and 80% working points in data and simulation using the SD tagger. These working points in addition to b -tagging requirements are used to define the signal regions in this analysis. The pink band in the ratio shows the effect of the SD uncertainty on the log χ distribution. As can be seen from Figure 7, the SD uncertainty covers any data/simulation differences in efficiency.
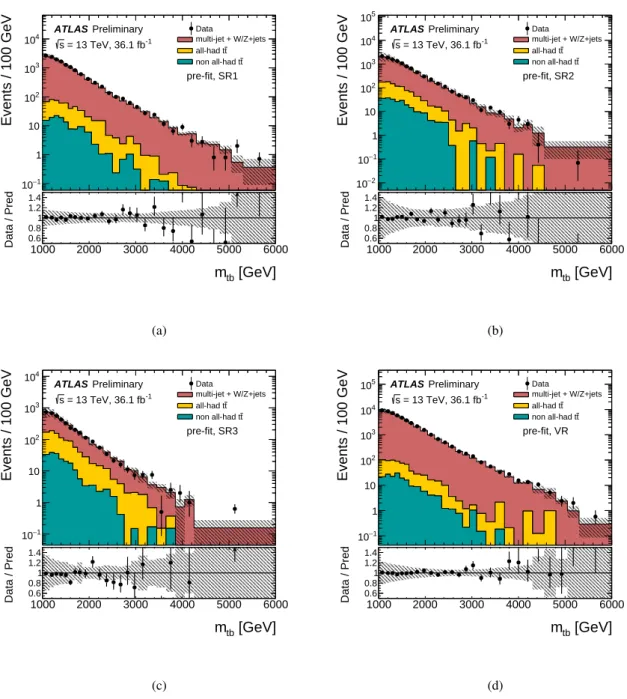
Figure 8 shows the m
t bdistributions in the three signal regions and the multi-jet validation region before the fit to data. The hatched band in the bottom panel includes the systematic uncertainties described in Section 6 before fit to data.
Figure 9 shows the W
0-boson signal event selection efficiency as a function of the W
0-boson mass for the W
R0- (left) and W
L0- (right) boson signal samples in the three signal regions.
Figure 10 shows the limits on the cross section times branching ratio for the right-handed and left-handed couplings in the current analysis and for the previously published analysis done with the 20.3 fb
−1dataset collected at
√ s = 8 TeV. The latter result is discussed in Reference [14].
Figure 11 shows the ranking plot of 15 nuisance parameters (NPs) ordered by the impact on the signal
strength with the highest impact NP at the top. The systematic uncertainties related to the 2D sideband
method of multi-jet + W/Z +jets estimation and b -tagging uncertainties have the highest impact on the
signal strength.
Signal efficiency 0.1 0.2 0.3 0.4 0.5 0.6 0.7 0.8 0.9
Background rejection
1 10 10
210
3= 15 GeV dcut Excl.
> 20 GeV
sj
Incl. CA R=0.2 pT
< 500 GeV
J
420 < pT
ATLAS Simulation
= 13 TeV
s Preliminary
PYTHIA
Signal efficiency 0.1 0.2 0.3 0.4 0.5 0.6 0.7 0.8 0.9
Background rejection
1 10 10
210
3= 15 GeV dcut Excl.
> 20 GeV
sj
Incl. CA R=0.2 pT
< 600 GeV
J
500 < pT
ATLAS Simulation
= 13 TeV
s Preliminary
PYTHIA
Signal efficiency 0.1 0.2 0.3 0.4 0.5 0.6 0.7 0.8 0.9
Background rejection
1 10 10
210
3= 15 GeV dcut Excl.
> 20 GeV
sj
Incl. CA R=0.2 pT
< 800 GeV
J
600 < pT
ATLAS Simulation
= 13 TeV
s Preliminary
PYTHIA
Signal efficiency 0.1 0.2 0.3 0.4 0.5 0.6 0.7 0.8 0.9
Background rejection
1 10 10
210
3= 15 GeV dcut Excl.
> 20 GeV
sj
Incl. CA R=0.2 pT
< 1000 GeV
J
800 < pT
ATLAS Simulation
= 13 TeV
s Preliminary
PYTHIA
Signal efficiency 0.1 0.2 0.3 0.4 0.5 0.6 0.7 0.8 0.9
Background rejection
1 10 10
210
3= 15 GeV dcut Excl.
> 20 GeV
sj
Incl. CA R=0.2 pT
< 1300 GeV
J
1000 < pT
ATLAS Simulation
= 13 TeV
s Preliminary
PYTHIA
Signal efficiency 0.1 0.2 0.3 0.4 0.5 0.6 0.7 0.8 0.9
Background rejection
1 10 10
210
3= 15 GeV dcut Excl.
> 20 GeV
sj
Incl. CA R=0.2 pT
< 1600 GeV
J
1300 < pT
ATLAS Simulation
= 13 TeV
s Preliminary
PYTHIA
Figure 6: Background rejection and signal efficiency between Run 1 version of SD algorithm (red) and the current
version using exclusive jets (blue) for different large- R jet p
Tbins.
Efficiency
0 0.2 0.4 0.6 0.8 1 1.2
Data unc.)
sj
MC (pT
50% W.P.
±2.5%
sj = /pT sj
pT
∆
fully correlated subjets ATLAS Preliminary
= 13 TeV, 36.1 fb-1 s
(GeV)
J
p
T600 800 1000 1200
Data / Pred. 0.8
1 1.2
Efficiency
0 0.2 0.4 0.6 0.8 1 1.2
Data unc.)
sj
MC (pT
80% W.P.
±2.5%
sj = /pT sj
pT
∆
fully correlated subjets ATLAS Preliminary
= 13 TeV, 36.1 fb-1 s
(GeV)
J
p
T600 800 1000 1200
Data / Pred. 0.8
1 1.2
Figure 7: Top tagging efficiency in data and MC for the t t ¯ lepton+jets selection (Section 6.1 in Reference [72]) for
the 50% and 80% signal efficiency working points using the shower deconstruction algorithm, as a function of the
transverse momentum of the large- R jet p
T. The pink band shows the effect of the SD uncertainty described in
Section 6.
−1
10 1 10 102
103
104
Events / 100 GeV
ATLAS Preliminary = 13 TeV, 36.1 fb-1
s
pre-fit, SR1 Data
multi-jet + W/Z+jets t all-had t
t non all-had t
1000 2000 3000 4000 5000 6000
[GeV]
m
tb 0.60.8 1 1.2 1.4
Data / Pred
(a)
−2
10
−1
10 1 10 102
103
104
105
Events / 100 GeV
ATLAS Preliminary = 13 TeV, 36.1 fb-1
s
pre-fit, SR2 Data
multi-jet + W/Z+jets t all-had t
t non all-had t
1000 2000 3000 4000 5000 6000
[GeV]
m
tb 0.60.8 1 1.2 1.4
Data / Pred
(b)
−1
10 1 10 102
103
104
Events / 100 GeV
ATLAS Preliminary = 13 TeV, 36.1 fb-1
s
pre-fit, SR3 Data
multi-jet + W/Z+jets t all-had t
t non all-had t
1000 2000 3000 4000 5000 6000
[GeV]
m
tb 0.60.8 1 1.2 1.4
Data / Pred
(c)
−1
10 1 10 102
103
104
105
Events / 100 GeV
ATLAS Preliminary = 13 TeV, 36.1 fb-1
s
pre-fit, VR Data
multi-jet + W/Z+jets t all-had t
t non all-had t
1000 2000 3000 4000 5000 6000
[GeV]
m
tb 0.60.8 1 1.2 1.4
Data / Pred

![Figure 7: Top tagging efficiency in data and MC for the t t ¯ lepton+jets selection (Section 6.1 in Reference [72]) for the 50% and 80% signal efficiency working points using the shower deconstruction algorithm, as a function of the transverse momentum of](https://thumb-eu.123doks.com/thumbv2/1library_info/4004257.1540740/22.892.153.728.437.706/efficiency-selection-section-reference-efficiency-deconstruction-algorithm-transverse.webp)