CERN-PH-EP-2013-032
Submitted to: Physical Review D
A search for t ¯ t resonances in the lepton plus jets final state with ATLAS using 4.7 fb −1 of pp collisions at √
s = 7 TeV
The ATLAS Collaboration
Abstract
A search for new particles that decay into top quark pairs (t ¯ t) is performed with the ATLAS ex- periment at the LHC using an integrated luminosity of 4.7 fb
−1of proton–proton (pp) collision data collected at a center-of-mass energy √
s = 7 TeV. In the t ¯ t → W bW b decay, the lepton plus jets final state is used, where one W boson decays leptonically and the other hadronically. The t ¯ t system is reconstructed using both small-radius and large-radius jets, the latter being supplemented by a jet substructure analysis. A search for local excesses in the number of data events compared to the Standard Model expectation in the t ¯ t invariant mass spectrum is performed. No evidence for a t ¯ t resonance is found and 95% credibility-level limits on the production rate are determined for massive states predicted in two benchmark models. The upper limits on the cross section times branching ratio of a narrow Z
0resonance range from 5.1 pb for a boson mass of 0.5 TeV to 0.03 pb for a mass of 3 TeV. A narrow leptophobic topcolor Z
0resonance with a mass below 1.74 TeV is excluded. Limits are also derived for a broad color-octet resonance with Γ/m = 15.3%. A Kaluza–Klein excitation of the gluon in a Randall–Sundrum model is excluded for masses below 2.07 TeV.
arXiv:1305.2756v2 [hep-ex] 18 Jun 2013
A search for t ¯ t resonances in the lepton plus jets final state with ATLAS using 4.7 fb
−1of pp collisions at √
s = 7 TeV
The ATLAS Collaboration (Dated: October 10, 2018)
A search for new particles that decay into top quark pairs (t ¯
t) is performed with the ATLASexperiment at the LHC using an integrated luminosity of 4.7 fb
−1of proton–proton (pp) collision data collected at a center-of-mass energy
√s
= 7 TeV. In the
t¯
t→W bW bdecay, the lepton plus jets final state is used, where one
Wboson decays leptonically and the other hadronically. The
t¯
tsystem is reconstructed using both small-radius and large-radius jets, the latter being supplemented by a jet substructure analysis. A search for local excesses in the number of data events compared to the Standard Model expectation in the
tt¯ invariant mass spectrum is performed. No evidence for a
t¯
tresonance is found and 95% credibility-level limits on the production rate are determined for massive states predicted in two benchmark models. The upper limits on the cross section times branching ratio of a narrow
Z0resonance range from 5.1 pb for a boson mass of 0.5 TeV to 0.03 pb for a mass of 3 TeV. A narrow leptophobic topcolor
Z0resonance with a mass below 1.74 TeV is excluded. Limits are also derived for a broad color-octet resonance with Γ/m = 15.3%. A Kaluza–Klein excitation of the gluon in a Randall–Sundrum model is excluded for masses below 2.07 TeV.
I. INTRODUCTION
Despite its many successes, the Standard Model (SM) of particle physics is believed to be an effective field the- ory valid only for energies up to the TeV scale. Due to its large mass, the top quark is of particular inter- est for the electroweak symmetry breaking mechanism and could potentially be connected with new phenom- ena. Several proposed extensions to the SM predict the existence of heavy particles that decay primarily to top quark pairs.
This paper presents the results of a search for produc- tion of new particles decaying to top quark pairs using a dataset corresponding to an integrated luminosity of 4.7 fb
−1of 7 TeV center-of-mass energy proton–proton (pp) collisions collected by the ATLAS experiment in 2011. The search is carried out using the lepton plus jets decay channel where the W boson from one top quark decays leptonically (to an electron or a muon, and a neu- trino) and the other top quark decays hadronically. This search uses a combination of resolved and boosted recon- struction schemes, defined by the cases when the top- quark decay products are well-separated or merged in the detector, respectively. In the resolved reconstruction scheme, the hadronically decaying top quark is identified by two or three distinct small-radius jets, while in the boosted reconstruction scheme one large-radius jet with substructure consistent with jets from a W boson and a b-quark is used. The boosted reconstruction scheme is more suitable for high-mass t ¯ t resonances as the top- quark decay products become more collimated.
Examples of hypothetical models that contain high- mass t ¯ t resonances are the topcolor assisted technicolor model (TC2) [1–3], which predicts a leptophobic Z
0par- ticle [4], and a Randall–Sundrum (RS) warped extra- dimension model, which predicts a bulk Kaluza–Klein (KK) gluon [5–9], a color-octet. Two specific benchmark models are chosen and are used throughout the rest of the paper. In the first model, a leptophobic topcolor
Z
0particle of width Γ
Z0/m
Z0= 1.2% is considered as a resonance that is narrow with respect to the detector resolution of typically 10%. In the second model, a KK gluon (g
KK) of width Γ
gKK/m
gKK= 15.3% is considered as a resonance that is broad with respect to the detector resolution.
Previous searches for t ¯ t resonances were carried out by ATLAS in the lepton plus jets final state with 2 fb
−1of integrated luminosity at √
s = 7 TeV using resolved and boosted reconstruction techniques separately [10, 11].
With a resolved reconstruction technique, a Z
0reso- nance is excluded for 0.50 < m
Z0< 0.88 TeV and a KK gluon is excluded for 0.50 < m
gKK< 1.13 TeV, both at 95% credibility level (CL). With a boosted recon- struction technique, a leptophobic Z
0is excluded for 0.60 < m
Z0< 1.15 TeV and a KK gluon is ruled out for 0.60 < m
gKK< 1.5 TeV at 95% CL. Using both re- solved and boosted reconstruction techniques on an in- tegrated luminosity of 5 fb
−1of lepton plus jets events at √
s = 7 TeV, the CMS experiment excludes a nar- row leptophobic topcolor Z
0resonance in the mass range 0.50–1.49 TeV and a KK gluon in the mass range 1.00–
1.82 TeV [12]. A CMS study conducted on the same dataset, but using dilepton plus jets final states, sets slightly less stringent limits on the narrow Z
0resonance, 0.75 < m
Z0< 1.3 TeV [13]. The ATLAS and CMS exper- iments also performed searches where the top quark pair decays hadronically, using 4.7 fb
−1and 5.0 fb
−1of inte- grated luminosity respectively at √
s = 7 TeV. ATLAS excludes a narrow Z
0resonance in the mass ranges 0.70–
1.00 TeV and 1.28–1.32 TeV [14] as well as a broad KK gluon with mass 0.7–1.62 TeV. The CMS collaboration excludes a narrow Z
0particle in the mass range 1.3–
1.5 TeV [15]. The reach of the LHC searches now ex- tends to far higher resonance masses than the Tevatron results [16–19].
Using 4.7 fb
−1of integrated luminosity, this analysis
improves the previous ATLAS lepton plus jets analyses
in that it uses a large-radius R = 1.0 jet trigger, applies
method for charged lepton isolation and combines the resolved and boosted reconstruction analyses.
II. THE ATLAS DETECTOR
The ATLAS detector [20] is designed to measure the properties of a wide range of TeV-scale physics processes that may occur in pp interactions. It has a cylindrical geometry and close to 4π solid-angle coverage.
ATLAS uses a right-handed coordinate system with its origin at the nominal interaction point (IP) in the center of the detector and the z-axis along the beam pipe. The x-axis points from the IP to the center of the LHC ring, and the y-axis points upward. Cylindrical coordinates (r, φ) are used in the transverse plane, φ being the az- imuthal angle around the beam pipe, measured from the x-axis. The pseudorapidity is defined in terms of the po- lar angle θ as η = − ln tan(θ/2). Transverse momentum and energy are defined in the x-y-plane, as p
T= p· sin(θ) and E
T= E · sin(θ).
The inner detector (ID) covers the pseudorapidity range |η| < 2.5 and consists of multiple layers of sili- con pixel and microstrip detectors as well as a straw- tube transition radiation tracker (|η| < 2.0), which also provides electron identification information. The ID is surrounded by a superconducting solenoid that provides a 2 T axial magnetic field.
The calorimeter system surrounds the ID and the solenoid and covers the pseudorapidity range |η| < 4.9.
It consists of high-granularity lead/liquid-argon (LAr) electromagnetic calorimeters, a steel/scintillator-tile hadronic calorimeter within |η| < 1.7 and two cop- per/LAr hadronic endcap calorimeters covering 1.5 <
|η| < 3.2. The solid-angle coverage is completed out to |η| = 4.9 with forward copper/LAr and tungsten/LAr calorimeter modules.
The muon spectrometer (MS) surrounds the calorime- ters, incorporating multiple layers of trigger and track- ing chambers in an azimuthal magnetic field produced by an air-core toroid magnet, which enables an indepen- dent, precise measurement of muon track momentum for
|η| < 2.7. The muon trigger covers the region |η| < 2.4.
A three-level trigger system [21] is employed for the ATLAS detector. The first-level trigger is implemented in hardware, using a subset of detector information to reduce the event rate to a design value of 75 kHz. This is followed by two software-based trigger levels, which together reduced the event rate to about 300 Hz in 2011.
III. DATA AND MONTE CARLO SAMPLES
The data used in this search were collected with the ATLAS detector at the LHC in 2011. The data are used only if they were recorded under stable beam conditions and with all relevant subdetector systems operational.
lected with a single-muon trigger with a transverse mo- mentum threshold of 18 GeV or a single-electron trigger with a transverse momentum threshold of 20 GeV, which was raised to 22 GeV later in the year. The data sam- ple used for boosted reconstruction was collected with a single large-radius (R = 1.0) jet trigger with a transverse momentum threshold of 240 GeV. R is the radius param- eter of the anti-k
tjet algorithm, which is discussed in Sec. IV. The jet trigger thresholds are measured at the electromagnetic (EM) energy scale, which, at threshold, is on average 80% of the true energy scale, increasing with p
T. The integrated luminosity for the data sample is 4.7 ± 0.2 fb
−1.
Simulated samples are used to predict the contribu- tions from various Standard Model processes to the ex- pected background and to model possible t ¯ t resonance signals. After Monte Carlo event generation, all sam- ples are passed through a GEANT 4-based [22] simula- tion [23] of the ATLAS detector and reconstructed using the same software as for data. The effect of multiple pp interactions is included in the simulated samples, and the simulated events are weighted such that the distribu- tion of the average number of pp interactions per bunch crossing agrees with data.
The primary irreducible background is Standard Model t t ¯ production, characterized by a smoothly falling invariant mass spectrum. It is modeled using the MC@NLO v4.01 [24–26] generator with Herwig v6.520 [27, 28] for parton showering and hadronization and Jimmy [29] for modeling the multiple parton in- teractions. The CT10 [30] parton distribution func- tions (PDFs) are used and the top quark mass is set to 172.5 GeV. Only events in which at least one of the W bosons decays leptonically (including decays to τ leptons) are produced. This corresponds to an effective cross sec- tion times branching ratio at approximate NNLO (next- to-next-to-leading-order) of 90.5 pb [31, 32], obtained us- ing the calculation described in Sec. VIII. Additional t ¯ t samples, generated with Powheg [33] interfaced with Pythia or Herwig , are used to evaluate the model un- certainty in the parton showering and fragmentation, as described in Sec. VIII.
Single top quark production is modeled using multi- ple generators. Production in the s-channel and pro- duction with an associated W boson (W t) are modeled with MC@NLO / Herwig / Jimmy [34, 35] as above. Pro- duction in the t-channel is modeled using the AcerMC v3.8 [36] generator and Pythia v6.421 [37] for parton showering and hadronization. For the s- and t-channels, events are generated in which the W boson is required to decay leptonically while for the W t process there is no such requirement. The cross section times branching ra- tios used are based on approximate NNLO calculations:
20.9 pb (t-channel) [38], 15.7 pb (W t process) [39] and 1.5 pb (s-channel) [40].
The Standard Model production of W and Z bosons
that decay leptonically, accompanied by jets, is an im-
portant background. This includes decays to τ leptons.
These samples are generated with Alpgen v2.13 [41]
with up to five extra partons in the matrix element. Mod- eling of parton showering, hadronization and the underly- ing event uses Herwig and Jimmy as for the t ¯ t samples, and the matching of the matrix element to the parton shower is done using the MLM method [42]. The PDFs used are CTEQ6L1 [43]. Specific W boson plus heavy- flavor processes (W b ¯ b, W c¯ c and W c) are generated sep- arately with Alpgen and double counting of the heavy- flavor contributions is removed from the W plus light- quark jets samples. The W +jets samples are normalized to the inclusive NNLO cross sections [44, 45] and then corrected using data as described in Sec. VII. The Z+jets production, modeled using Alpgen , includes contribu- tions from the interference between photon and Z boson exchanges, and events are required to have a dilepton in- variant mass 40 < m
``< 2000 GeV. The Zb ¯ b process is generated separately with Alpgen and heavy-flavor contribution overlap removal is done as in the W +jets case.
The diboson background is modeled using Herwig and Jimmy with MRST2007LO
∗PDFs [46]. A filter at gen- erator level requiring the presence of at least one lep- ton with p
T> 10 GeV and |η| < 2.8 is used. The NLO cross sections used for the samples before filtering are 17.0 pb for W W production, 5.5 pb for W Z pro- duction, and 1.3 pb for ZZ production, estimated with the MCFM [47] generator. The W Z and ZZ samples also include the off-shell photon contribution decaying to dilepton pairs [48].
Signal samples of Z
0events are modeled using Pythia with CTEQ6L1 PDFs. This Monte Carlo sample, where the resonance width is 3%, is used to interpret the data in the topcolor Z
0model (where the width is 1.2%) since in both cases the width is negligible compared to the de- tector resolution of 10%. The leptophobic topcolor Z
0boson has a branching fraction to t ¯ t of 33% for masses above 700 GeV, approaching exactly 1/3 for very large masses. It is marginally smaller at lower masses with the smallest value being 31% at a mass of 500 GeV [2, 3].
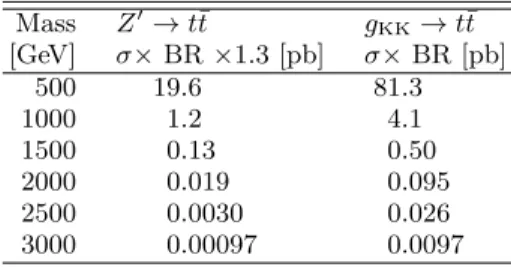
A K-factor of 1.3 [49] is applied to account for NLO ef- fects [50]. Signal samples of Randall–Sundrum KK glu- ons are generated via Madgraph [51] and then show- ered and hadronized using Pythia . The width of the KK gluon is 15.3% of its mass and its branching fraction to t t ¯ is 92.5% [5]. The production cross section times branching fractions for the two signals can be found in Table I.
IV. PHYSICS OBJECT SELECTION
The physics object selection criteria closely follow those in Ref. [52], the main exceptions being the treat- ment of charged lepton isolation and the use of large- radius jets.
Jets are reconstructed using the anti-k
talgorithm [53,
TABLE I. The production cross section times branching frac- tion (BR) for the resonant signal processes
pp→Z0→t¯
tin the topcolor model and
pp→gKK→tt¯ for the KK gluon in a Randall–Sundrum model with warped extra dimensions. A
K-factor of 1.3 has been applied to the Z0cross section to account for NLO effects.
Mass
Z0→t¯
t gKK→t¯
t[GeV]
σ×BR
×1.3 [pb] σ×BR [pb]
500 19.6 81.3
1000 1.2 4.1
1500 0.13 0.50
2000 0.019 0.095
2500 0.0030 0.026
3000 0.00097 0.0097
54] applied to topological clusters [55] of calorimeter cells with significant energy above the noise threshold. Jets with radius parameters of R = 0.4 and R = 1.0 are used.
For the small-radius R = 0.4 jets, topological clusters at the EM energy scale are used to form the jets [56], while for the large-radius R = 1.0 jets, locally calibrated topological clusters are used [56–58]. The usage of locally calibrated clusters ensures a more correct description of the energy distribution inside the large-radius jet, which is needed when using jet substructure variables, as de- scribed in Sec. V. Both the small-radius and large-radius jets have their final transverse momentum and pseudo- rapidity adjusted with energy- and η-dependent correc- tion factors. These are derived from simulation [56, 59]
and verified using data [56]. The small-radius jets are required to have p
T> 25 GeV and |η| < 2.5, while large- radius jets must have p
T> 350 GeV and |η| < 2.0. Above this jet p
Tvalue, the large-radius jet trigger is more than 99% efficient. A ∆R = p
(∆η)
2+ (∆φ)
2separation requirement between small-radius and large-radius jets in the boosted event selection below ensures no double- counting of topological cluster energy.
Small-radius jets are tagged as b-jets using a neural- network-based b-tagging algorithm that uses as input the results of impact parameter, secondary vertex, and decay topology algorithms [60]. The operating point chosen for the resolved selection corresponds to an average b-tagging efficiency in simulated t ¯ t events of 70% and a light-quark rejection factor of 140 for p
T> 20 GeV. For events pass- ing the boosted selection criteria, the b-tagging efficiency estimated from simulated t ¯ t events using small-radius jets with p
T> 25 GeV is 75% and the light-quark jet rejection factor is 85. The b-tag requirement for both the resolved and boosted event selections refers only to small-radius jets.
Electrons are identified by the shape of the shower in
the EM calorimeter and must have a matching track in
the inner detector [61]. The cluster in the EM calorime-
ter must satisfy |η| < 2.47 with the transition region
1.37 < |η| < 1.52 between EM calorimeter sections ex-
cluded. Electrons are required to be isolated as described
the primary event vertex must be smaller than 2 mm.
The primary event vertex is defined as the vertex with the highest sum of the squared p
Tvalues of the associ- ated tracks ( P p
2T,track) in the event. Electrons within a cone of ∆R = 0.4 with respect to any small-radius jet are removed, which suppresses the background from multi-jet events with non-prompt electrons and removes events where the same calorimeter energy deposits would be counted within two physics objects. The electron transverse momentum, p
T, is calculated using the clus- ter energy and track direction, and must be greater than 25 GeV to ensure a fully efficient trigger.
Muon candidates are formed by matching recon- structed ID tracks with tracks reconstructed in the MS.
Only muons with |η| < 2.5 are used. Muons are re- quired to be isolated as described below and to have
|z
0| < 2 mm. For the resolved reconstruction, muons are required to have a separation in ∆R of at least 0.1 from any small-radius jet. The muon momentum is calculated using both the MS and the ID tracks, taking the energy loss in the calorimeter into account. The transverse mo- mentum of the muon must be greater than 25 GeV, well above the trigger threshold, chosen to reduce the multi- jet background without impacting the signal.
The isolation of charged leptons is typically defined us- ing the transverse energy found in a fixed cone around the lepton [48]. Because the angle between the charged lepton and the b-quark decreases as the top quark is more boosted, a better measure of isolation, named mini- isolation, is used [62, 63]. The use of mini-isolation im- proves the lepton signal efficiency and background rejec- tion with respect to the fixed-cone algorithm. For this analysis, mini-isolation is defined as
I
mini`= X
tracks
p
trackT, ∆R(`, track) < K
T/p
`T, (1)
where the scalar sum runs over all tracks (except the matched lepton track) that have p
trackT> 1 GeV, pass quality selection criteria, and fulfill the ∆R(`, track) re- quirement shown in Eq. (1). Here p
`Tis the lepton trans- verse momentum and K
Tis an empirical scale parameter set to 10 GeV, chosen so that the size of the isolation cone is optimal both at high and low p
T. The requirement I
mini`/p
`T< 0.05 is used, corresponding to 95% (98%) ef- ficiency for a muon (electron) in the p
Tregion used for this analysis. At low p
T, this mini-isolation criterion cor- responds to a tighter isolation requirement than is used in other top quark analyses at ATLAS, and at high p
Tit is looser.
The missing transverse momentum, E
Tmiss, is calcu- lated [64] from the vector sum of the transverse energy in calorimeter cells associated with topological clusters.
The direction of the energy deposits is given by the line joining the cell to the interaction point. Calorimeter cells are first uniquely associated with a physics object (e.g.
electron, jet or muon). The transverse energy of each cell is then calibrated according to the type of object to which
muon transverse momenta are added and the associated calorimeter cell energies are subtracted. Finally, topolog- ical clusters not associated with any reconstructed object are calibrated at the EM energy scale and added to the transverse energy sum vector.
V. EVENT SELECTION
After passing a single-lepton trigger for the resolved re- construction or a large-radius jet trigger for the boosted reconstruction, events are required to have exactly one isolated lepton with p
T> 25 GeV and I
mini`/p
T< 0.05.
The reconstructed primary event vertex is required to have at least five tracks with p
T> 0.4 GeV. In the elec- tron channel, E
Tmissmust be larger than 30 GeV and the transverse mass larger than 30 GeV. The transverse mass is defined as m
T= p
2p
TE
Tmiss(1 − cos ∆φ), where p
Tis the transverse momentum of the charged lepton and ∆φ is the azimuthal angle between the charged lepton and the missing transverse momentum, which is assumed to be due to the neutrino. In the muon channel, the se- lection is E
Tmiss> 20 GeV and E
Tmiss+ m
T> 60 GeV.
These selection criteria are chosen to suppress the multi- jet background.
The selection requirements for jets differ for the cases of resolved or boosted reconstruction. For the resolved reconstruction, events are required to have at least three small-radius jets with p
T> 25 GeV and |η| < 2.5. To reduce the effects of multiple pp interactions in the same bunch crossing, at least 75% of the scalar sum of the p
Tof the tracks in each jet (called “jet vertex fraction”) is required to be associated with the primary vertex. If one of the jets has a mass [65] above 60 GeV, it is assumed to contain the two quarks from the hadronic W decay, or one of these quarks and the b-quark from the top-quark decay. If no jet has a mass above 60 GeV then at least four jets are required, one of which must be tagged as a b-jet.
For the boosted reconstruction, the three partons from the hadronic top-quark decay are expected to have merged into one large-radius jet. Thus, at least one large-radius jet with p
T> 350 GeV and a mass larger than 100 GeV is required. The constituents of the large-radius jets are then reclustered with the ex- clusive k
talgorithm [66, 67] using FastJet [54] and R = 1.0. The last step in the reclustering of subjets within a jet has the splitting scale √
d
12. Generally d
ij= min(p
2T,i, p
2T,j)∆R
2ij/R
2, where i and j refer to the two last proto-jets to be merged, ∆R
ijis a measure of the angle between them and R = 1.0 is the fixed radius parameter [66, 67]. The value of √
d
12is expected to be larger for jets that contain a top-quark decay than for jets from the non-top-quark backgrounds. The splitting scale
√ d
12is required to be larger than 40 GeV, a criterion that
rejects about 40% of the non-top-quark background, but
only 10% of the t ¯ t sample.
The jet formed by the b-quark from the semilepton- ically decaying top quark is selected as a small-radius jet that fulfills the same p
T, η and jet vertex fraction criteria as used in the resolved reconstruction and has a ∆R separation smaller than 1.5 from the lepton. If more than one jet fulfills these criteria, the one closest to the lepton is chosen. Two other requirements are ap- plied to the event: the decay products from the two top quarks are required to be well separated through the cri- teria ∆φ(`, j
1.0) > 2.3 and ∆R(j
0.4, j
1.0) > 1.5, where j
0.4and j
1.0denote the jets with R = 0.4 and R = 1.0, respectively. The ∆R(j
0.4, j
1.0) requirement guarantees that there is no energy overlap between the two jets [11].
The highest-p
Tlarge-radius jet passing these criteria is taken as the hadronically decaying top quark candidate.
Finally, in both selections at least one small-radius b-tagged jet is required. In the boosted analysis this requirement is independent of any large-radius jet in the event, i.e. the b-tagged jet may originate from the hadronic top-quark decay and overlap with the large- radius jet or it may originate from the leptonic top-quark decay and thus be near the lepton.
VI. EVENT RECONSTRUCTION
The t ¯ t candidate invariant mass, m
tt¯, is computed from the four-momenta of the two reconstructed top quarks.
For the semileptonically decaying top quark, in both the resolved and boosted selections, the longitudinal com- ponent of the neutrino momentum, p
z, is computed by imposing a W boson mass constraint on the lepton plus E
Tmisssystem [68, 69]. If only one real solution for p
zex- ists, this is used. If two real solutions exist, the solution with the smallest |p
z| is chosen or both are tested, de- pending on the reconstruction algorithm. In events where no real solution is found, the E
Tmissvector is rescaled and rotated, applying the minimum variation necessary to find exactly one real solution. This procedure is justified since mismeasurement of the E
Tmissvector is the likeliest explanation for the lack of a solution to the p
zequation, assuming that the lepton indeed comes from a W boson decay.
For the resolved reconstruction, a χ
2minimization al- gorithm is used to select the best assignment of jets to the hadronically and semileptonically decaying top quarks.
The χ
2minimization uses the reconstructed top quark and W boson masses as constraints:
χ
2=
m
jj− m
Wσ
W 2+
m
jjb− m
jj− m
th−Wσ
th−W 2+
m
j`ν− m
t`σ
t` 2+
(p
T,jjb− p
T,j`ν) − (p
T,th− p
T,t`) σ
diffpT 2, (2)
where t
hand t
`denote the hadronically and semileptoni- cally decaying top quarks respectively, and j and b denote
the jets originated by the light quarks and b-quarks. The first term constrains the hadronically decaying W boson.
The second term corresponds to the invariant mass of the hadronically decaying top quark, but since the in- variant mass of the jets from the W candidate (m
jj) is heavily correlated with the mass of the three jets from the hadronic top quark candidate (m
jjb), the mass of the hadronically decaying W boson is subtracted to decou- ple this term from the first one. The third term repre- sents the semileptonically decaying top quark, and the last term constrains the transverse momenta of the two top quarks to be similar, as expected for a resonance de- cay. The parameters of Eq. (2) (m
W, m
th−W, m
t`, σ
W, σ
th−W, σ
t`, p
T,th−p
T,t`and σ
diffpT) are determined from Monte Carlo simulation studies comparing partons from the top-quark decay with reconstructed objects [70]. All small-radius jets satisfying the physics object selection requirements of Sec. IV and p
T> 20 GeV are tried and the permutation with the lowest χ
2is used to calculate m
t¯t. The correct assignment of the jets to the partons of the t ¯ t decay (q, ¯ q
0, b, ¯ b) is achieved in approximately 65% of the t ¯ t events for which all the decay products of the top quarks are in the acceptance of the detector and can be matched to reconstructed objects. If one of the jets has a mass larger than 60 GeV, the χ
2is slightly modified to allow the heavy jet to contain either the two light quarks from the W boson decay or one quark from the W boson and the b-quark from the top-quark decay.
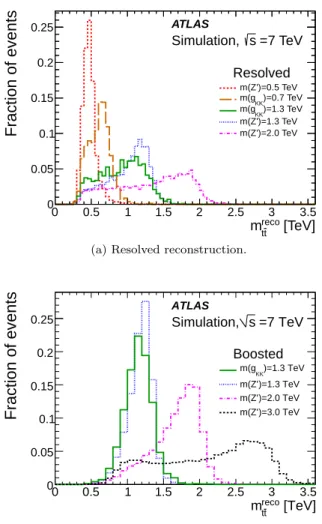
The reconstructed t ¯ t invariant mass, m
recott¯, in simulated events is shown in Fig. 1(a) for a selection of Z
0and g
KKmass values.
For the boosted reconstruction, the hadronically de- caying top-quark four-momentum is taken to be that of the large-radius jet, while the semileptonically decaying top-quark four-momentum is formed from the neutrino solution from the W boson mass constraint, the high-p
Tlepton and the nearest small-radius jet. In this case there is no ambiguity in the assignment of the objects to the original top quarks. The reconstructed t ¯ t invariant mass for a selection of simulated Z
0and g
KKmass points is shown in Fig. 1(b).
The extended tails at low masses for high-mass reso- nances in Fig. 1 are caused mainly by the convolution of the Z
0line shape and the steeply falling parton dis- tribution functions. The χ
2method sometimes also re- constructs a slightly lower m
t¯tvalue in the case of hard final-state radiation, since it tends to select the soft jets from the light quarks in the top-quark decay, rather than hard jets from final-state radiation.
Four independent m
t¯tinvariant mass spectra are used
to search for t t ¯ resonances. For each of the e+jets and
µ+jets decay channels, two orthogonal data samples are
created. The first sample contains all events that pass
the boosted event selection. For these events, m
t¯tis
estimated using the boosted reconstruction. This first
sample includes events that also pass the resolved event
selection. For these events the boosted reconstruction is
used because of its better reconstructed mass resolution.
[TeV]
reco t
m
t0 0.5 1 1.5 2 2.5 3 3.5
Fraction of events
0 0.05 0.1 0.15 0.2 0.25
m(Z’)=0.5 TeV )=0.7 TeV m(gKK
)=1.3 TeV m(gKK
m(Z’)=1.3 TeV m(Z’)=2.0 TeV ATLAS
=7 TeV s Simulation,
Resolved
(a) Resolved reconstruction.
[TeV]
reco t
mt
0 0.5 1 1.5 2 2.5 3 3.5
Fraction of events
0 0.05 0.1 0.15 0.2 0.25
ATLAS
)=1.3 TeV m(gKK
m(Z’)=1.3 TeV m(Z’)=2.0 TeV m(Z’)=3.0 TeV
=7 TeV s Simulation,
Boosted
(b) Boosted reconstruction.
FIG. 1. The reconstructed
t¯
tinvariant mass,
mrecot¯t, using the (a) resolved and (b) boosted selection, for a variety of simulated
Z0masses (m(Z
0)). The broad Kaluza–Klein gluon resonance at masses 0.7 TeV and 1.3 TeV are also shown for comparison.
The second sample, referred to as the resolved selection in the remainder of the paper, contains all events that pass the resolved event selection but do not pass the boosted event selection.
The efficiency of the boosted event selection for se- lecting Z
0→ t ¯ t events (including all possible t ¯ t decay channels) as a function of the true invariant mass of the t t ¯ system is shown in Fig. 2, together with the selection efficiency for all events passing either selection method.
These efficiencies are given with respect to the full set of Z
0→ t ¯ t events and they include both the fraction of events within the fiducial acceptance and the fraction of those events that pass the criteria for reconstructed ob- jects, as well as the branching fraction to the various final states. At masses below 1 TeV, the resolved selection is the most efficient, whereas the boosted selection gains in importance at high masses. The e+jets efficiency drops at high masses, due to the ∆R(j, e) > 0.4 requirement, which removes highly collimated top-quark decays. The
[TeV]
t
mt
E ff ic ie n c y [ % ]
0 2 4 6 8 10 12 14 16 18 20
0 0.5 1 1.5 2 2.5 3 3.5
ATLAS Simulation
=7 TeV s
+ jets, combined µ
+ jets, boosted µ
e + jets, combined e + jets, boosted
FIG. 2. The selection efficiency as a function of the true
mt¯tfor simulated
Z0resonances at various mass points. The
µ+jets channel is shown with gray lines and thee+jets chan-nel with black lines. Dashed lines show the boosted selection and solid lines the total selection efficiency.
overall selection efficiency is larger for the µ+jets chan- nel because of an inherent larger selection efficiency of muons compared with electrons, and also because of the differences in the requirements on the missing transverse energy and transverse mass.
VII. BACKGROUNDS DETERMINED FROM DATA
The W +jets and multi-jet backgrounds and their un- certainties are largely determined from data. The ex- pected shape of the m
recot¯tdistribution of the W +jets background is estimated using Alpgen simulation sam- ples, but the overall normalization and flavor fractions are determined from data.
The total number of W +jets events passing selection criteria in the data, N
W++ N
W−, is estimated from the observed charge asymmetry in data [71, 72] and the pre- dicted charge asymmetry in W +jets events from Monte Carlo simulation:
N
W++ N
W−=
r
MC+ 1 r
MC− 1
(D
corr+− D
corr−), (3) where r
MCis the predicted ratio in Monte Carlo simula- tion of the W
+to W
−boson cross sections after event selection criteria are applied (but without b-tagging) and D
corr+(−)is the number of observed events with a pos- itively (negatively) charged lepton. Charge-symmetric contributions from t ¯ t and Z +jets processes cancel in the difference and the contributions from the remaining, slightly charge-asymmetric processes are accounted for by Monte Carlo simulation. To increase the sample size for the boosted selection, the jet mass and √
d
12require-
ments are not applied and the p
Trequirement on the
large-radius jet is relaxed to be > 300 GeV. From sta-
bility tests performed by varying the p
Trequirement, it
is concluded that no additional uncertainty for the ex- trapolation to the signal region is needed. The result- ing corrections for the W +jets yields from Monte Carlo simulation to agree with data are unity within their un- certainties (10%–20%) for both the boosted and resolved selections.
Data are also used to determine scale factors for the relative fraction of W +jets events with heavy-flavor jets.
A system of three equations is solved to determine the fractions of events containing two b-quarks, two c-quarks, one c-quark or only light quarks, for each jet multiplicity i of the events. The ratio of events containing two b- quarks to events with two c-quarks is taken from Monte Carlo simulation. The sum of all flavor fractions is con- strained to unity. By comparing the number of events with i jets before and after b-tagging (separately for pos- itively and negatively charged leptons) between data and Monte Carlo simulation, correction factors for the flavor fractions for each jet bin i are determined [52, 72, 73].
The normalization and shape of the multi-jet back- grounds are determined directly from data using a ma- trix method [52] for both the resolved and boosted selec- tions. The multi-jet backgrounds include all background sources from processes with non-prompt leptons or jets misreconstructed as leptons, including the fully hadronic decays of W and Z bosons and t ¯ t pairs (both from Stan- dard Model production and from possible signal). The matrix method uses efficiencies, measured in data, asso- ciated with prompt leptons (from W and Z boson de- cays) and non-prompt leptons (from multi-jet events) passing the required isolation criterion. An alternative method, called the jet–electron method [69] is used to estimate the systematic uncertainty of the normalization and shape of the invariant mass spectrum associated with this background. Consistency checks comparing the ma- trix method with the jet–electron method show that the normalization uncertainty is 60%, for both the resolved and boosted selections, and that the impact of the shape uncertainty is negligible.
For both selection methods, the modeling of the multi- jet contribution is validated using a multi-jet-enriched control region with E
missT< 50 GeV and m
T< 50 GeV.
For muons, both selection methods require a transverse impact parameter significance |d
0|/σ(d
0) > 4 to en- hance the fraction of heavy-flavor jets in the sample, which is the dominant source of multi-jet events after b-tagging. For the boosted selection, at least one large- radius jet with p
T> 150 GeV is also required and the jet mass and k
tsplitting scale requirements are inverted to m
jet< 100 GeV and √
d
12< 40 GeV. The control re- gion for the boosted selection is disjoint from the signal region, while 14% (6%) of events from the control region for the resolved selection also pass the signal region cri- teria for the e+jets (µ+jets) channel. Within the quoted systematic uncertainties, the modeling of the multi-jet background agrees with the data in the control regions, as shown in Fig. 3.
VIII. SYSTEMATIC UNCERTAINTIES
The final observables are the four t ¯ t invariant mass spectra (two selections and two decay channels). The uncertainties can be broadly divided into two categories:
uncertainties that affect reconstructed physics objects (such as jets) and uncertainties that affect the modeling of certain backgrounds or signals. Some of the uncertain- ties affect both the shape and the normalization of the spectrum, while others affect the normalization only.
The dominant normalization uncertainty on the total background is the Standard Model t t ¯ cross-section uncer- tainty of 11%. The uncertainty has been calculated at approximate NNLO in QCD [31] with Hathor 1.2 [32]
using the MSTW2008 90% confidence-level NNLO PDF sets [74] and PDF+α
Suncertainties according to the MSTW prescription [75]. These uncertainties are then added in quadrature to the normalization and factoriza- tion scale uncertainty and found to give results consistent with the NLO+NNLL calculation of Ref. [76] as imple- mented in Top++ 1.0 [77]. A cross section uncertainty from varying the top-quark mass by ±1 GeV, added in quadrature to the scale and PDF+α
Suncertainties, is also included.
The W +jets normalization is varied within the uncer- tainty, dominated by statistics, of the data-driven deter- mination, corresponding to 12% (10%) for the resolved selection in the e+jets (µ+jets) channel and 19% (18%) for the boosted selection in the e+jets (µ+jets) channel.
Four variations of the flavor composition are considered, including the statistical uncertainty on their data-driven determination, the uncertainty on the extrapolation to different jet multiplicities, and the correlations between different flavor fractions, giving a change in the W +jets event yield of about 10% per variation. The normal- ization uncertainty on the multi-jet background is 60%, coming from the difference between the matrix and jet–
electron methods. The single top quark background un- certainty [38–40] is 7.7%. The normalization uncertainty of the Z+jets sample is 48%, estimated using Berends–
Giele scaling [48]. The diboson normalization uncertainty is 34%, which is a combination of the PDF uncertainty and additional uncertainties from each extra selected jet.
The preliminary estimate of the 2011 luminosity uncer- tainty of 3.9% is used, based on the techniques explained in Ref. [78], and is applied to the signal samples and all backgrounds except multi-jets and W +jets, which are estimated from data.
The variation in the shape of the t t ¯ mass spectrum due
to the next-to-leading-order scale variation is accounted
for as a mass-dependent scaling, obtained by varying the
renormalization and factorization scales up and down by
a factor of two in MC@NLO, and normalizing to the nom-
inal cross section (described in Sec. III). The resulting
uncertainties range from 10% of the t t ¯ background at
low m
t¯tto 20% at masses above 1 TeV. The PDF uncer-
tainty on all Monte Carlo samples is estimated by taking
the envelope of the MSTW2008NLO, NNPDF2.3 [79] and
[TeV]
reco t
mt
0 0.2 0.4 0.6 0.8 1 1.2 1.4 1.6
Events / 0.2 TeV
1 10 102
103
104
105
106 Data tt
Single top W+jets Multi-jets Z+jets Diboson
ATLAS = 4.7 fb-1
dt
∫
L= 7 TeV s
e + jets resolved
[TeV]
reco t
mt
0 0.2 0.4 0.6 0.8 1 1.2 1.4 1.6
Data/Bkg 0
1 2
(a) Resolved selection,e+jets channel.
[TeV]
reco t
mt
0 0.2 0.4 0.6 0.8 1 1.2 1.4 1.6
Events / 0.2 TeV
1 10 102
103
104
105
Data tt
Single top W+jets Multi-jets Z+jets Diboson
ATLAS = 4.7 fb-1
dt
∫
L= 7 TeV s
+ jets resolved µ
[TeV]
reco t
mt
0 0.2 0.4 0.6 0.8 1 1.2 1.4 1.6
Data/Bkg 0
1 2
(b) Resolved selection,µ+jets channel.
[TeV]
reco t
mt
0 0.2 0.4 0.6 0.8 1 1.2 1.4 1.6
Events / 0.2 TeV
1 10 102
103
104
105 Data tt
Single top W+jets Multi-jets Z+jets Diboson
ATLAS = 4.7 fb-1
dt
∫
L= 7 TeV s
e + jets boosted
[TeV]
reco t
mt
0 0.2 0.4 0.6 0.8 1 1.2 1.4 1.6
Data/Bkg 0
1 2
(c) Boosted selection,e+jets channel.
[TeV]
reco t
mt
0 0.2 0.4 0.6 0.8 1 1.2 1.4 1.6
Events / 0.2 TeV
1 10 102
103
104
105 Data tt
Single top W+jets Multi-jets Z+jets Diboson
ATLAS = 4.7 fb-1
dt
∫
L= 7 TeV s
+ jets boosted µ
[TeV]
reco t
mt
0 0.2 0.4 0.6 0.8 1 1.2 1.4 1.6
Data/Bkg 0
1 2
(d) Boosted selection,µ+jets channel.
FIG. 3. The reconstructed
t¯
tinvariant mass,
mrecot¯t, in the multi-jet control regions for the resolved (a, b) and boosted (c, d) selections. The 60% uncertainty on the multi-jet contribution is indicated as the shaded area. The multi-jet fraction is significantly larger for the
µ+jets channel than for the e+jet channel because of the impact parameter requirement on themuons, which suppresses prompt muons.
CT10 PDF set uncertainties at 68% confidence-level [80]
following the PDF4LHC recommendation [81] and nor- malizing to the nominal cross section. The PDF uncer- tainty has a much larger effect on the t t ¯ mass spectrum in the boosted sample than in the resolved sample, with variations in the number of t ¯ t events increasing from 5%
at 1 TeV to over 50% above 2 TeV, due primarily to the larger relative PDF uncertainties in the higher-mass (higher partonic x) regime. The effect on the total back- ground from the PDF variations is 4.7% (7.3%) after the resolved (boosted) selection.
One of the dominant uncertainties affecting recon- structed physics objects is the jet energy scale (JES) un- certainty, especially for large-radius jets [59, 65], which has an effect of 17% on the background yield in the boosted selection. This uncertainty also includes vari- ations in the jet mass scale (JMS) and the k
tsplitting scales within their uncertainties [59]. The uncertainty is
smaller for the resolved selection, since the large-radius jets are only used indirectly there, in the veto of events that pass the boosted selection. For small-radius jets, the uncertainties in the JES, the jet reconstruction effi- ciency and the jet energy resolution (JER) are consid- ered [56]. The b-tagging uncertainty is modeled through simultaneous variations of the uncertainties on the effi- ciency and rejection scale factors [60, 82]. An additional b-tagging uncertainty is applied for high-momentum jets (p
T> 200 GeV) to account for uncertainties in the mod- eling of the track reconstruction in dense environments with high track multiplicities [83]. The effect of uncer- tainties associated with the jet vertex fraction is also con- sidered.
The uncertainty on the Standard Model t ¯ t background
due to uncertainties in the modeling of QCD initial- and
final-state radiation (ISR/FSR) is estimated using Ac-
erMC [36] plus Pythia Monte Carlo samples by vary-
ing the Pythia ISR and FSR parameters while retain- ing consistency with a previous ATLAS measurement of t t ¯ production with a veto on additional central jet ac- tivity [84]. The magnitude of the variations comes from a measurement of extra radiation in top quark events.
Higher-order electroweak virtual corrections to the t ¯ t mass spectrum have been estimated in Ref. [85] and are used as an estimate of the systematic uncertainty of the t ¯ t Monte Carlo sample normalization. The parton shower- ing and fragmentation uncertainty on the t ¯ t background is estimated by comparing the result from samples gener- ated with Powheg interfaced with Pythia or Herwig for the parton showering and hadronization.
For the W +jets background, the uncertainty on the shape of the mass distribution is estimated by varying the parameterization of the renormalization and factor- ization scales [41].
The shape uncertainty of the multi-jet background is estimated by comparing the matrix method and the jet–
electron method, and its impact on the expected up- per cross-section limit of the signal models (discussed in Sec. X) is found to be negligible.
For the leptons, the uncertainties on the mini-isolation efficiency, the single-lepton trigger and the reconstruc- tion efficiency are estimated using Z → ee and Z → µµ events. The difference between Z boson and t ¯ t events is part of the mini-isolation uncertainty. Uncertainties on the E
missTreconstruction, as well as on the energy scale and energy resolution of the leptons are also considered, and generally have a smaller impact on the yield and the expected limits than the uncertainties mentioned above.
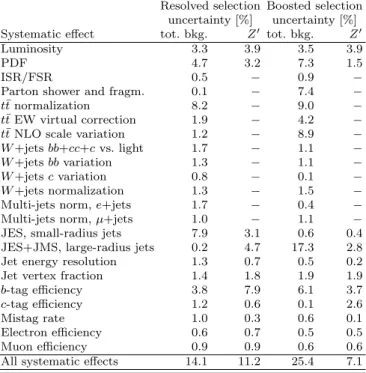
In Table II, an overview of the effects of the dominant systematic uncertainties on the background and signal yields is given. Only the impact on the overall normal- ization is shown in the table. Some of the systematic uncertainties also have a significant dependence on the reconstructed t ¯ t mass and this is fully taken into account in the analysis.
IX. COMPARISON OF DATA AND THE STANDARD MODEL PREDICTION
After all event selection criteria are applied, 61931 re- solved and 1078 boosted events remain. A total of 701 events pass both sets of selection criteria, and in the analysis they are treated as boosted events. The event yields from data and from the expected backgrounds for 4.7 fb
−1are listed in Table III, along with the total sys- tematic uncertainties, described in Sec. VIII.
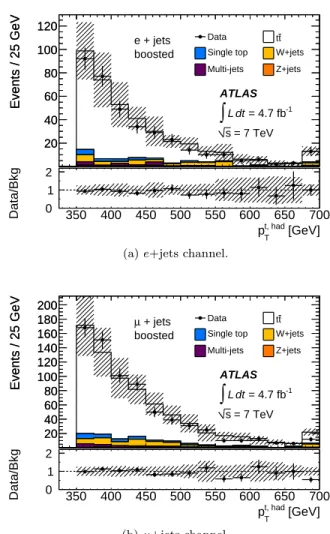
Figures 4 and 5 show the transverse momentum of the leading (small-radius) jet after the resolved selection and the transverse momentum of the selected large-radius jet after the boosted selection, respectively. In Figs. 6 and 7, the reconstructed mass distributions of the semilep- tonically and hadronically decaying top quark candidates are shown, using the boosted event selection. Figure 8 shows the distribution of the first k
tsplitting scale of the
TABLE II. Average uncertainty from the dominant system- atic effects on the total background yield and on the estimated yield of a
Z0with
m= 1.6 TeV. The
e+jets andµ+jets spec-tra are added. The shift is given in percent of the nominal value. The error on the yield from all systematic effects is es- timated as the quadratic sum of all systematic uncertainties.
Certain systematic effects are not relevant for the
Z0samples, which is indicated with a bar (−) in the table.
Resolved selection Boosted selection uncertainty [%] uncertainty [%]
Systematic effect tot. bkg. Z0 tot. bkg. Z0
Luminosity 3.3 3.9 3.5 3.9
PDF 4.7 3.2 7.3 1.5
ISR/FSR 0.5 − 0.9 −
Parton shower and fragm. 0.1 − 7.4 −
t¯tnormalization 8.2 − 9.0 −
t¯tEW virtual correction 1.9 − 4.2 −
t¯tNLO scale variation 1.2 − 8.9 −
W+jetsbb+cc+cvs. light 1.7 − 1.1 −
W+jetsbbvariation 1.3 − 1.1 −
W+jetscvariation 0.8 − 0.1 −
W+jets normalization 1.3 − 1.5 −
Multi-jets norm,e+jets 1.7 − 0.4 −
Multi-jets norm,µ+jets 1.0 − 1.1 −
JES, small-radius jets 7.9 3.1 0.6 0.4
JES+JMS, large-radius jets 0.2 4.7 17.3 2.8
Jet energy resolution 1.3 0.7 0.5 0.2
Jet vertex fraction 1.4 1.8 1.9 1.9
b-tag efficiency 3.8 7.9 6.1 3.7
c-tag efficiency 1.2 0.6 0.1 2.6
Mistag rate 1.0 0.3 0.6 0.1
Electron efficiency 0.6 0.7 0.5 0.5
Muon efficiency 0.9 0.9 0.6 0.6
All systematic effects 14.1 11.2 25.4 7.1
TABLE III. Data and expected background event yields after the resolved and boosted selections. The total systematic uncertainty of the expected background yields is listed.
Type Resolved selection Boosted selection
t¯
t44200
±7000 940
±260 Single top 3200
±500 50
±10 Multi-jets
e1600
±1000 8
±5 Multi-jets
µ1000
±600 19
±11
W+jets 7000
±2200 90
±30
Z+jets
800
±500 11
±6
Dibosons 120
±50 0.9
±0.6 Total 58000
±8000 1120
±280
Data 61931 1078
selected large-radius jet. In these figures, the diboson background is too small to be visible. Good agreement is observed between the data and the expected background.
The t t ¯ invariant mass spectra for the resolved and the
boosted selections in the e+jets and µ+jets decay chan-
nels are shown in Fig. 9. Figure 10 shows the t ¯ t invariant
mass spectrum for all channels added together. The data
agree with the Standard Model prediction within the un-
Events / 20 GeV
0 1000 2000 3000 4000 5000 6000 7000
Events / 20 GeV
0 1000 2000 3000 4000 5000 6000 7000
Data tt
Single top W+jets Multi-jets Z+jets
ATLAS = 4.7 fb-1
dt
∫
L = 7 TeV s e + jetsresolved
[GeV]
Leading jet pT
0 50 100 150 200 250 300 350 400 450 500
Data/Bkg 0
1 2
(a)e+jets channel.
Events / 20 GeV
0 1000 2000 3000 4000 5000 6000 7000 8000 9000
Events / 20 GeV
0 1000 2000 3000 4000 5000 6000 7000 8000 9000
Data tt
Single top W+jets Multi-jets Z+jets
ATLAS = 4.7 fb-1
dt
∫
L = 7 TeV s + jetsµ resolved
[GeV]
Leading jet pT
0 50 100 150 200 250 300 350 400 450 500
Data/Bkg 0
1 2
(b)µ+jets channel.
FIG. 4. The transverse momentum of the leading jet in (a) the
e+jets and (b) the µ+jets channels, after the resolvedselection. The shaded area indicates the total systematic un- certainties.
certainties. The slight shape mismatch between data and the Standard Model prediction seen in Fig. 9, especially for the resolved selection, is fully covered by the uncer- tainties. Systematic uncertainties that tilt the shape in this way include the t ¯ t generator uncertainty, the small- radius jet energy scale and resolution uncertainties, and the ISR/FSR modeling.
X. RESULTS
After the reconstruction of the t ¯ t mass spectra, the data and expected background distributions are com- pared to search for hints of phenomena associated with new physics using BumpHunter [86]. This is a hypothesis-testing tool that uses pseudo-experiments to search for local excesses or deficits in the data compared to the Standard Model prediction in binned histograms, taking the look-elsewhere effect into account over the full
Events / 25 GeV
0 20 40 60 80 100 120
Events / 25 GeV
0 20 40 60 80 100 120
Data tt
Single top W+jets Multi-jets Z+jets
ATLAS = 4.7 fb-1
dt
∫
L = 7 TeV s e + jetsboosted
[GeV]
t, had
pT
350 400 450 500 550 600 650 700
Data/Bkg 0
1 2
(a)e+jets channel.
Events / 25 GeV
0 20 40 60 80 100 120 140 160 180 200
Events / 25 GeV
0 20 40 60 80 100 120 140 160 180 200
Data tt
Single top W+jets Multi-jets Z+jets
ATLAS = 4.7 fb-1
dt
∫
L = 7 TeV s + jetsµ boosted
[GeV]
t, had
pT
350 400 450 500 550 600 650 700
Data/Bkg 0
1 2
(b)µ+jets channel.
FIG. 5. The transverse momentum of the hadronically decay- ing top quark candidate in (a) the
e+jets and (b) theµ+jetschannels, after the boosted selection. The shaded area indi- cates the total systematic uncertainties. The last bin contains histogram limit overflows.
mass spectrum. The Standard Model prediction is al- lowed to float within the systematic uncertainties. After accounting for the systematic uncertainties, no signifi- cant deviation from the expected background is found.
Upper limits are set on the cross section times branching ratio of the Z
0and KK gluon benchmark models using a Bayesian technique, implemented in a tool developed by the D0 collaboration [87]. The prior is taken to be con- stant in the signal cross section, which in this case is an excellent approximation of the reference prior that maxi- mizes the amount of missing information [88], as given in Ref. [89]. The Bayesian limits are in good agreement with results obtained using the CL
smethod [90, 91]. For each of the models investigated, 95% CL upper limits are set on the product of production cross section and branching ratio into t ¯ t pairs.
Figure 11 displays the upper limits on the cross sec-
tion, with systematic and statistical uncertainties, ob-
Events / 10 GeV
0 10 20 30 40 50 60 70
Events / 10 GeV
0 10 20 30 40 50 60
70 Data tt
Single top W+jets Multi-jets Z+jets
ATLAS = 4.7 fb-1
dt
∫
L = 7 TeV s e + jetsboosted
[GeV]
t, lep
m
100 150 200 250 300
Data/Bkg 0
1 2
(a)e+jets channel.
Events / 10 GeV
0 20 40 60 80 100 120
Events / 10 GeV
0 20 40 60 80 100
120 Data tt
Single top W+jets Multi-jets Z+jets
ATLAS = 4.7 fb-1
dt
∫
L = 7 TeV s + jetsµ boosted
[GeV]
t, lep
m
100 150 200 250 300
Data/Bkg 0
1 2
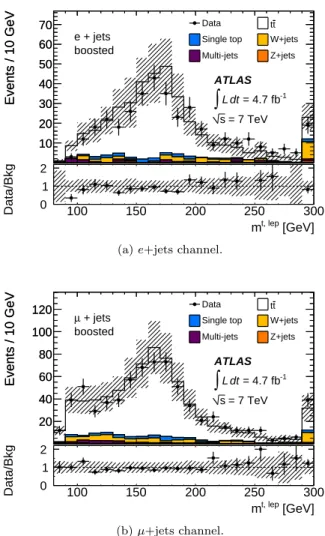
(b)µ+jets channel.
FIG. 6. The invariant mass of the semileptonically decaying top quark candidate,
mt,lep, in (a) the
e+jets and (b) the µ+jets channels, after the boosted selection. The mass hasbeen reconstructed from the small-radius jet, the charged lep- ton and the missing transverse momentum, using a
Wmass constraint to obtain the longitudinal momentum of the neu- trino. The shaded area indicates the total systematic uncer- tainties. The last bin contains histogram limit overflows.
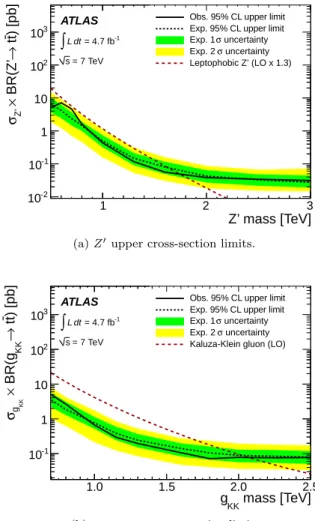
tained from the combination of the two selections for each of the benchmark models. The numerical values of the upper limits on the cross section are given in Ta- ble IV (Z
0) and Table V (g
KK). The expected limits and uncertainty band are obtained using pseudo-experiments based on Poisson distributions for the number of entries in each bin. In the combination, the four disjoint spectra are used, corresponding to boosted and resolved selec- tions, as well as e+jets and µ+jets decay channels. Due to the improvements in the analysis, the upper limits on the cross section for a Z
0resonance at 1.6 TeV and a KK gluon resonance at 2.0 TeV are less than half the values that would be obtained by a simple rescaling of the previ- ous best high-mass ATLAS limits [11] to account for the larger integrated luminosity. Using the combined upper
0 50 100 150 200 250 300 350
Events / 20 GeV
20 40 60 80 100 120 140
160 Data
Single top Multi-jets
t t W +jets Z+jets
ATLAS e + jets
boosted anti-kt R=1.0
= 4.7 fb-1
dt
∫
L = 7 TeV s[GeV]
t,had
m
0 50 100 150 200 250 300 350
Data/Bkg 0
1 2
(a)e+jets channel.
0 50 100 150 200 250 300 350
Events / 20 GeV
50 100 150 200 250 300
Data Single top Multi-jets
t t W +jets Z+jets
ATLAS + jets
µ boosted anti-kt R=1.0
= 4.7 fb-1
dt
∫
L = 7 TeV s[GeV]
t,had
m
0 50 100 150 200 250 300 350
Data/Bkg 0
1 2
(b)µ+jets channel.
FIG. 7. The mass of the large-radius jet from the hadroni- cally decaying top quark,
mt,had, in (a) the
e+jets and (b)the
µ+jets channels, after the boosted selection, except therequirement
mt,had >100 GeV. The shaded area indicates the total systematic uncertainties.
limits on the cross section, a leptophobic topcolor Z
0bo- son (KK gluon) with mass between 0.5 TeV and 1.74 TeV (0.7 TeV and 2.07 TeV) is excluded at 95% CL.
XI. SUMMARY
A search for t t ¯ resonances in the lepton plus jets decay channel has been carried out with the ATLAS experiment at the LHC. The search uses a data sample corresponding to an integrated luminosity of 4.7 fb
−1of proton–proton collisions at a center-of-mass energy of 7 TeV. The t ¯ t system is reconstructed in two different ways. For the resolved selection, the hadronic top-quark decay is re- constructed as two or three R = 0.4 jets, and for the boosted selection, it is reconstructed as one R = 1.0 jet.
No excess of events beyond the Standard Model predic-
tions is observed in the t t ¯ invariant mass spectrum. Up-
0 50 100 150 200 250
Events / 20 GeV
20 40 60 80 100 120
140 Data
Single top Multi-jets
t t W +jets Z+jets
ATLAS e + jets
boosted
= 4.7 fb-1
dt
∫
L = 7 TeV s[GeV]
d12
0 50 100 150 200 250
Data/Bkg 0
1 2
(a)e+jets channel.
0 50 100 150 200 250
Events / 20 GeV
50 100 150 200 250
Data Single top Multi-jets
t t W +jets Z+jets
ATLAS + jets
µ boosted
= 4.7 fb-1
dt
∫
L = 7 TeV s[GeV]
d12
0 50 100 150 200 250
Data/Bkg 0
1 2
(b)µ+jets channel.
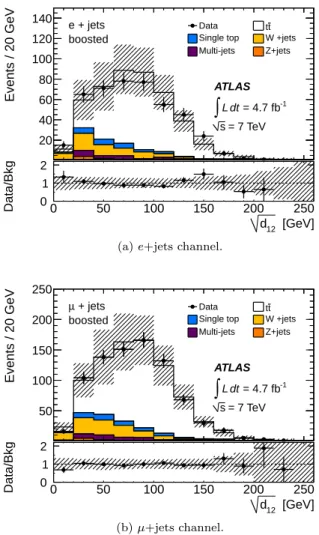
FIG. 8. The first
ktsplitting scale,
√d12
, of the large-radius jet from the hadronically decaying top quark in (a) the
e+jetsand (b) the
µ+jets channels, after the boosted selection, ex-cept the requirement
√d12>
40 GeV. The shaded area indi- cates the total systematic uncertainties.
TABLE IV. Upper limits on the cross-section times branching ratio, at 95% CL, for a leptophobic topcolor
Z0decaying to
t¯
t, using the combination of all four samples. The observedand expected limits for each mass point are given, as well as the
±1σvariation of the expected limit.
Mass Obs. Exp. Exp.−1σ Exp.+1σ
[TeV] [pb] [pb] [pb] [pb]
0.50 5.1 6.7 3.7 10.2
0.60 7.1 4.2 2.4 6.2
0.70 4.6 2.3 1.5 3.7
0.80 1.61 1.45 0.98 1.89
1.00 0.43 0.49 0.31 0.74
1.30 0.117 0.148 0.090 0.213 1.60 0.056 0.080 0.049 0.115 2.00 0.038 0.042 0.027 0.064 2.50 0.034 0.033 0.022 0.048 3.00 0.031 0.028 0.019 0.044
TABLE V. Upper limits on the cross-section times branching ratio, at 95% CL, for a Kaluza–Klein gluon decaying to
tt,¯ using the combination of all four samples. The observed and expected limits for each mass point are given, as well as the
±1σ
variation of the expected limit.
Mass Obs. Exp. Exp.−1σ Exp.+1σ
[TeV] [pb] [pb] [pb] [pb]
0.70 5.0 3.5 2.2 5.5
0.80 2.6 1.86 1.29 3.1
1.00 0.66 0.76 0.51 1.14
1.15 0.29 0.38 0.24 0.58
1.30 0.20 0.24 0.15 0.37
1.60 0.106 0.140 0.082 0.198 1.80 0.072 0.105 0.066 0.159 2.00 0.077 0.089 0.056 0.129 2.25 0.075 0.084 0.054 0.126 2.50 0.077 0.078 0.050 0.119
per limits on the cross section times branching ratio are set for two benchmark models: a narrow Z
0resonance from Ref. [1] and a broad Randall–Sundrum Kaluza–
Klein gluon from Ref. [5]. The 95% credibility upper limits on the cross section times branching ratio for the narrow resonance range from 5.1 pb at a resonance mass of 0.5 TeV to 0.03 pb at 3 TeV. The upper limits on the cross section determined for the broad resonance are higher, 5.0 pb (0.08 pb) at 0.7 (2.0) TeV. Based on these results, the existence of a narrow leptophobic topcolor Z
0boson with mass 0.5–1.74 TeV is excluded at 95% CL. A broad Kaluza–Klein gluon in the mass range 0.7–2.07 TeV is also excluded at 95% CL.
ACKNOWLEDGMENTS