ATLAS-CONF-2017-063 24July2017
ATLAS CONF Note
ATLAS-CONF-2017-063
21st July 2017
In-situ measurements of the ATLAS large-radius jet response in 13 TeV pp collisions
The ATLAS Collaboration
The response of the ATLAS experiment to groomed large radius (R=1.0) jets is measured in-situwith 33 fb−1 of √
s = 13 TeV LHC proton–proton collisions collected in 2016. The jet transverse momentum scale and resolution are measured in events where the jet recoils against a reference object, either a calibrated photon, another large-Rjet, or a recoiling sys- tem of well-measured small-Rjets. The jet mass is constrained using mass peaks formed by boostedW bosons and top quarks and by comparison to the jet mass calculated with track- jets. Generally, the description of the transverse momentum and mass response in Monte Carlo simulation is found to be correct to within 5%. The results of the different methods are combined to yield constraints on the ratio of the response in data and Monte Carlo simulation over a large transverse momentum range. The precision of the relative jetpT scale is 1-2%
forpT < 2 TeV, while that on the relative mass scale is 2-4%. The transverse momentum (mass) resolution is constrained to 10% (20%).
c
2017 CERN for the benefit of the ATLAS Collaboration.
Reproduction of this article or parts of it is allowed as specified in the CC-BY-4.0 license.
1 Introduction
Many ATLAS searches and measurements use large-Rjets (with a radius parameterR =1.0) to recon- struct the hadronic decays of highly boosted Higgs bosons, top quarks, andW± andZ0 bosons. These topologies are separated from the dominant multi-jet background through an analysis of the internal structure of the jet. The sensitivity of these analyses depends heavily on an accurate knowledge of the transverse momentum (pT), mass, and jet shape response of the experimental apparatus to jets. ATLAS relies on a number of techniques to measure thepTand mass response of jetsin-situ, using data collected by the experiment [1–6].
In ATLAS, jets are reconstructed using topological calorimeter clusters [7] and are calibrated to the level of stable final-state particles using Monte Carlo simulations [8, 9]. The Monte Carlo description of the response and resolution is verified and corrected using several data-driven methods [8,9]. The jetpTscale and resolution are measured by balance techniques that exploit the transverse momentum (pT) balance of large-Rjets and a recoiling system [3]. ThepTresolution is measured in dijet events [3] and a constraint on the ratio of resolutions in data and Monte Carlo simulation (JER) is derived. The JES, the ratio of the response in data and Monte Carlo simulation, is constrained by the photon-jet balance method [10], the multi-jet balance method [11], and a third method that exploits the transverse momentum balance in boostedt¯t production with a lepton+ jets final state. Further constraints on the relativepT response come from theRtrk method, that takes advantage of the independent measurements of the inner tracking detector and the calorimeter. The modelling of the mass response (jet mass scale or JMS and the jet mass resolution or JMR) is verifiedin-situusing theRtrkmethod and the mass peaks of boostedWbosons and top quarks.
In this note the in-situmeasurements of the ATLAS response to large-R jets determined using √ s = 13 TeVppcollision data recorded in 2016 are described as a function of the jetpT, rapidity and mass.
In Section2 the ATLAS experiment and the data set used for this study are introduced. Section3 de- scribes the reconstruction of large-Rjets in ATLAS. A brief overview of thein-situapproaches is given in Section4. The jet energy resolution measurements are presented in Section5. Sections6and Section7 discuss thein-situcalibrations of the jet energy scale and the jet mass scale. In Section8the procedure to combine the results of severalin-situmethods is presented, followed by the combined results in Section9.
A summary in Section10concludes this note.
2 The ATLAS experiment, data and simulated samples
The ATLAS detector consists of an inner detector to track charged particles covering the pseudo-rapidity1 range |η| < 2.5, sampling electromagnetic and hadronic calorimeters covering the range|η| < 4.9, and a muon spectrometer spanning |η| < 2.7. A real-time selection reduces the 40 MHz collision rate to an average of 1 kHz [12]. The ATLAS trigger system consists of a hardware-based Level 1 (L1) trigger
1The ATLAS reference system is a Cartesian right-handed coordinate system, with the nominal collision point at the origin.
The anticlockwise beam direction defines the positivez-axis, while the positivex-axis is defined as pointing from the collision point to the center of the LHC ring and the positivey-axis points upwards. The azimuthal angleφis measured around the beam axis, and the polar angleθis measured with respect to the z-axis. Pseudo-rapidity is defined asη =−ln[tan(θ/2)], rapidity is defined asy=0.5 ln[(E+pz)/(E−pz)], whereEis the energy andpzis thez-component of the momentum, and transverse energy is defined asET=Esinθ.
followed by a software-based high-level trigger (HLT). A detailed description of the ATLAS experiment can be found in Ref. [13].
The dataset used in this analysis consists of collisions ofppcollisions at a center-of-mass energy of √ s= 13 TeV, taken during 2016. The specific trigger requirements vary among thein-situ analyses and are described in the relevant sections. All data are required to meet basic quality criteria. Data taken during periods in which detector subsystems were not fully functional are discarded. Data quality criteria also reject events that have significant contamination from detector noise or with issues in the read-out. The remaining data correspond to an integrated luminosity of approximately 33 fb−1.
The data are compared to detailed Monte Carlo (MC) simulations [14] of the ATLAS detector response based on theGeant4[15] toolkit.
Hard-scattering events are simulated with a large number of different event generators. For all processes, multiple generators are used to assess possible systematic effects due to imperfections in the physics mod- elling. Several different Monte Carlo packages are used to hadronize final-state quarks and gluons. The leading-order generator Pythia8 [16] is used as a baseline for dijet andγ-jet production, with the A14 parameter set [17] and NNPDF2.3 LO PDF set [18]. The other leading-order generator Herwig++[19]
(with the UEEE5 parameter set and PDF set CTEQ6L1 [20]), and/or the leading-order multileg gener- ator Sherpa2.1 [21] (with up to 4 additional parton emissions) (with CT10 PDF set [22]) are used to assess differences in the simulated response. Top quark pair production is simulated at NLO accuracy with the Powheggenerator [23] and the CT10 PDF [22]. For the nominal sample Powhegis interfaced with Pythia6 [24]. Systematic uncertainties in the modelling of hadronization are evaluated with Powheg interfaced to Herwig++. Further uncertainties int¯tmodelling are evaluated by comparing with an alter- native Matrix Element generator (MG5_aMC@NLO [25]) and by varying the settings that govern initial and final state radiation [26]. The specific choices of each of thein-situanalyses are described in the relevant sections.
Due to the high luminosity of the LHC, multiple ppcollisions occur each bunch crossing. Interactions that occur within the bunch crossing of interest (in-time pile-up) or in neighbouring bunch crossings (out-of-time pile-up) can alter the measured energy of jets or lead to the reconstruction of additional, spurious jets. The average number of additional ppcollisions per bunch crossing (pileup interactions) is over 20 in the 2016 data analyzed here. Their effect on reconstructed jets are modelled by overlaying multiple low-energy inelastic pp events on the signal event. These events are generated with Pythia8.
The distribution of the number of interactions in simulation is weighted to match the luminosity profile in the 2016 data.
3 Jet reconstruction and calibration
This section describes the reconstruction of large-Rjets and the grooming procedure.
3.1 Anti-kt trimmed jets
The jets investigated in this note (indicated as “large-R jets”) are reconstructed using the anti-kt algo- rithm [27], with a distance parameterR=1.0. The jet clustering algorithm is implemented in the FastJet package [28]. Three classes of jets are used: particle-level (or truth) jets, calorimeter jets and track jet.
Calorimeter jets are formed from topological clusters [7], or “topoclusters,” which are collections of ad- jacent calorimeter cells grouped around cells with a significant energy above the calorimeter noise. The topoclusters are calibrated to correct for the scale differences between energy deposits from electromag- netic particles (electrons and photons) and hadrons, known as the local cluster weighting, LCW [6], and are defined to be massless.
To mitigate the effects of pileup, underlying event and soft emissions, a grooming procedure called trim- ming [29] is applied to the jets. Trimming recombines the jet constituents of eachR =1.0 jet into R = 0.2 sub–jets using thekt algorithm, producing a collection of sub–jets for each jet. The constituents of sub–jets with apsub−jetT /pjetT <0.05 are then removed and the jet four–momentum is recalculated from the remaining constituents [29].
The calorimeter jets studied here rely purely on calorimeter information. In this work no attempt is made to refine the jetpTor mass measurement using tracker information. The methods used here can be used in the future to calibrate particle-flow jets [30] or jets with a refined mass [1].
3.2 Monte-Carlo based jet calibration
The reference scale for the Monte-Carlo based jet calibration is formed by particle-level jets. These are formed from stable particles in simulated events that have a lifetime τ such that cτ > 10 mm. Parti- cles that do not leave significant energy deposits in the calorimeter, i.e. muons and neutrinos, are ex- cluded. Grooming is also applied to particle-level jets, but due to the absence of pileup, its effect is much smaller.
After reconstruction of the calorimeter jets, a correction derived from a sample of simulated inclusive jets is applied to restore the average reconstructed calorimeter jet energy scale to that of particle-level jets. An correction is also applied to theη of the reconstructed jet to correct a bias relative to truth jets in certain regions of the detector [3]. Both corrections are applied as a function of the reconstructed jet energy and pseudo-rapidity. This procedure is applied to large-R jets and to jets with radius parameter R=0.4, which are referred to as small-Rjets in this note.
For large-Rjets the jet invariant mass is calibrated in a final step [4,5]. This is important when using the jet mass in physics analyses since the jet mass is more sensitive than the transverse momentum to soft, wide-angle contributions and to cluster merging and splitting, as well as to the calorimeter geometry. The procedure measures the jet mass response after the standard JES calibration. The correction is derived using the same techniques as the jet energy correction. A correction parameterized in jet pT, pseudo- rapidity and mass is applied, keeping the jetpT constant [3].
3.3 Tracks and track–jets
Tracks are reconstructed from the hits formed by charged particles passing through the inner detector.
Tracks are required to have pT ≥ 500 MeV. To reduce fake tracks, they must have at least one pixel hit and at least 6 hits in the silicon tracker. The track transverse impact parameter|d0| with respect to the primary vertex must be less than 1.5 mm, and the longitudinal impact parameter|z0|times sinθwith respect to the primary vertex must be less than 1.5 mm. Track–jets are used as a reference in calibration uncertainty studies because of the independence of instrumental systematic effects between the inner
detector and the calorimeter. These are reconstructed by applying the same jet reconstruction procedure to the track objects defined above [31].
For pileup-removal purposes, individual tracks can also be associated with calorimeter jets using theghost associationprocedure [32], which includes a track in a jet if a massless constituent with negligible energy and the same direction as the track would have been clustered into the jet.
4 Description of in-situ calibration methods
The response of the detector to jets is constrainedin-situusing data collected by the experiment. This section provides a brief introduction to the methods used to measure the data/MC ratios of the resolution (JER and JMR) and average response (JES and JMS).
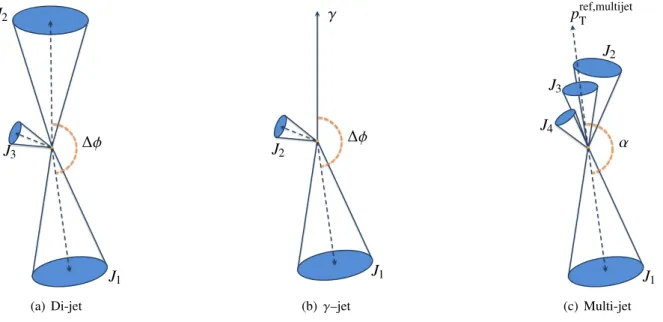
The strongest constraints on thepTresponse are based on topologies where a jet recoils against a reference object or system, such as a photon or a small-Rjet in a well-understood region (i.e. with lowerpT, or in the central part of the detector). Topologies are selected where the jet to calibrate (called the probe jet) recoils against a reference object with a precisely known momentum scale. Transverse momentum conservation allows a determination of the jet resolution and the transfer of the transverse momentum scale of the reference object to the probe jet. The three topologies used in this note are schematically depicted in Fig.1.
J2
J1
J3 ∆φ
(a) Di-jet
γ
J1
J2 ∆φ
(b)γ–jet
pref,multijet T
J1 J2 J3
J4
α
(c) Multi-jet
Figure 1: Schematic representation of the events used to constrain the JES and JER: (a) a dijet event, (b) an ideal γ–jet event for use in the direct balance method, and (c) a multi-jet event with several jets recoiling against the leading jet.
The jet mass response is also studiedin-situ, using two techniques. TheRtrkmethod relies on the indepen- dence of the systematic uncertainties in the response of the different sub-systems of the ATLAS detector, in particular of the tracker and the calorimeters. TheW boson and top quark mass peaks in the jet mass distribution int¯t events are used to constrain the mass response for jets that contain the multi-pronged topology of a boosted object [33].
4.1 Determination of the jet energy resolution from dijet events
The jet energy resolution is measured using dijet events, with the topologies of Fig.1(a), by exploiting the transverse momentum balance between the leading and subleading large-Rjets.
ThepTasymmetry of the two jets is defined as:
A=2p1T−p2T
p1T+p2T (1)
wherep1Tandp2T are the transverse momenta of the two leading jets in the event. The asymmetry distri- bution is approximately Gaussian. The width of the distribution is related to the momentum resolution of each of the jets. The width of the core of the distribution is estimated by an iterative fit with a Gaussian, changing the range at every iteration. The first fit is over the full histogram range (typically A=[-1,1]); the second fit is performed in a window of 2σaround the first fit result, and finally the third fit is performed in a window of 2σaround the second fit result.
If the two jets are both central (|η| <0.8), they are expected to have approximately the same resolution.
Then the fractional jet energy resolution on the average transverse momentumσ(pavgT ), uncorrected for the intrinsic width of the asymmetry distribution at truth level, can be expressed in terms of the width of the asymmetry distributionσ(A) as:
σ(pTavg)
pTavg ∼ σ(A)
√
2 (2)
The resolution of forward jets, which is significantly different from that of central ones, is extracted from the width of the asymmetry distribution in events where a central jet balances a forward jet (in the region 0.8<|η| <2.0). The result is corrected for the resolution of central jets by subtracting the asymmetry of central dijet systems:
σ(pfwdT ) pavgT =
r
σ(Actl,fwd)2− σ(Actl,ctl)2
2 , (3)
where the labels ctl andfwdrefer to the central and forward detector (|η| < 0.8 and 0.8 < |η| < 2.0, respectively). The jet resolution calculated this way is biased by any momentum imbalance present at the particle-level that arises from not having a perfect dijet topology. For example, the energy flow not captured by the finite-size jets (out-of-cone radiation), give rise to a non-zero width of the asymmetry of jets reconstructed on stable particles. For each of the generators the relative resolution of truth jets is indicated in Fig.2with a dashed line of the same colour. This contribution is subtracted, in quadrature, from the measured relative resolution to isolate the effect of the detector response. For forward jets, the additional correction shown in Eq. 3is applied to account for the effect of the resolution of the central, recoiling jet.
The selection of the events relies on a combination of jet triggers. These include triggers based on standard small-Rjets and special large-Rjet triggers, with trigger (pT) thresholds ranging from 110 GeV to 420 GeV. For eachpT range considered in this note, events are selected by triggers that are over 99%
efficient. Dijet events with two large-Rjets with an approximately back-to-back configuration are selected
by requiring∆φ >2.5 to ensure that they are in a back-to-back configuration. The third large-Rjet in the event is required to have apTof less than 50 GeV.
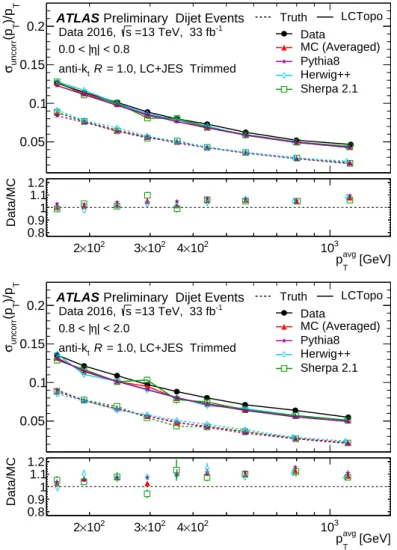
An example of such a fit on 2016 data is shown as the solid black curve with the round markers in Fig.2, where the measured relative resolution σ(pT)/pT is plotted as a function of the average pT of the two jets,pavgT . Further curves show the result of simulations based on three Monte Carlo generators: Pythia8, Herwig++ and Sherpa2.1. The JER, the ratio of the jet energy resolution in data and Monte Carlo simulation, is obtained by dividing the resolution measured in data and Monte Carlo simulation.
T)/p T(puncorrσ
0.05 0.1 0.15
0.2 Truth LCTopo
Data
MC (Averaged) Pythia8 Herwig++
Sherpa 2.1 ATLAS Preliminary Dijet Events
=13 TeV, 33 fb-1
s Data 2016,
| < 0.8 η 0.0 < |
= 1.0, LC+JES Trimmed
tR anti-k
[GeV]
avg
pT
102
×
2 3×10² 4×10² 103
Data/MC
0.8 0.9 1 1.1 1.2
T)/p T(puncorrσ
0.05 0.1 0.15
0.2 Truth LCTopo
Data
MC (Averaged) Pythia8 Herwig++
Sherpa 2.1 ATLAS Preliminary Dijet Events
=13 TeV, 33 fb-1
s Data 2016,
| < 2.0 η 0.8 < |
= 1.0, LC+JES Trimmed
tR anti-k
[GeV]
avg
pT
102
×
2 3×10² 4×10² 103
Data/MC
0.8 0.9 1 1.1 1.2
Figure 2: Comparison between jet pT resolution in data and in simulation, uncorrected for truth-level intrinsic asymmetry resolution, as a function of the average jetpT(black, round markers). The measurement is compared to the prediction from Monte Carlo simulation based on three generators: Pythia8 in light blue, Herwig++in green and Sherpa2.1 in purple. Also an unweighted average of the three is shown. Statistical errors are usually smaller than the size of the marker. The resolution at the truth-level is also shown, with dashed lines with the same colour coding. The plot in the upper panel corresponds to the central region (|η|<0.8), that in the lower panel the forward region (0.8<|η|<2.0).
4.2 Photon-Jet balance method
The large-Rjet energy scale can be constrained using theγ–jet final state, shown in Fig.1(b). It exploits the fact that the energy of photons is measured very precisely in the electromagnetic calorimeter. In run 1 at √
s = 7 and 8 TeV the photon energy calibration had an uncertainty of≈ 0.3% [34], and similar uncertainties are also present in Run 2 [35].
Theγ–jet method [10] is based on the balance between large-Rjets and photons, using the balance ratio
defined as:
B = pleading jet T
prefT . (4)
where the reference momentumprefT = pγT
cos (∆φ)
is the component ofpγTcollinear to the jet.
The double ratio ofhBdatai/hBMCidefines any residual mismodeling in the jet energy scale calibration.
If the reference photon is well measured experimentally and theγ-jet events are correctly modelled in simulation, any deviation from unity in the double ratio can be attributed to a mismodelling of the jet response in the Monte Carlo simulation.
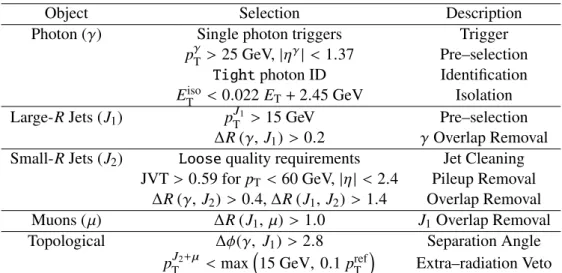
The photon-jet balance analysis follows that of Ref. [10], with some modifications and updates. Events are selected by requiring the presence of a photon satisfying the tight identification requirements [36]
and a large-Rjet that satisfy the requirements summarised in Table1, including a combination of single photon triggers with (pT) thresholds ranging from 20 GeV to 140 GeV. These cuts, in particular that on the azimuthal angle between the probe jet and photon, are designed to select events where the transverse momentum is predominantly carried by the leading large-Rjet and the leading photon.
Object Selection Description
Photon (γ) Single photon triggers Trigger
pγT > 25 GeV,|ηγ| <1.37 Pre–selection Tightphoton ID Identification ETiso <0.022ET+2.45 GeV Isolation Large-RJets (J1) pTJ1 >15 GeV Pre–selection
∆R(γ, J1) >0.2 γOverlap Removal Small-RJets (J2) Loosequality requirements Jet Cleaning
JVT> 0.59 forpT< 60 GeV,|η|< 2.4 Pileup Removal
∆R(γ, J2) >0.4,∆R(J1,J2) >1.4 Overlap Removal Muons (µ) ∆R(J1, µ) >1.0 J1Overlap Removal
Topological ∆φ(γ, J1) > 2.8 Separation Angle
pTJ2+µ < max
15 GeV, 0.1prefT
Extra–radiation Veto
Table 1: Summary of the event selection for thein-situtransverse momentum constraint fromγ–jet events. HereJ1 refer to the leading large-Rjet, andJ2to the leading small-Rjet.ETisois the calorimeter energy in a 0.4 cone around the photon, excluding a region around the photon.
A photon purity correction is applied to the mean balance results in data to correct for contamination from misidentified jets or electrons that may skew the nominal pT balance. The photon purity correction is
derived using the double-sideband, or ABCD, method using the photon isolation2and ID3as independent variables from which the fake photon contamination in the signal region is extracted.
4.3 Multi-jet balance
The calibration of high-pT large-R jets is carried out using the multi-jet momentum balance method, where an energetic large-Rjet is balanced against a system of fully-calibrated small-Rjets. The reference pTis obtained from the vector sum of jet momenta [11]. A schematic representation of the event topology used in this method is shown in Figure1(c).
The transverse momentum balance,BMJBis defined as:
BMJB= pleadingjetT
precoilT , (5)
wherepTleadingis the transverse momentum of the leading large-Rjet andpTrecoilis the vectorial sum of the transverse momenta of the recoil system of small-Rjets.
The mean value of theBMJBis measured in both data and Monte Carlo simulation in bins of precoilT . The data-to-MC double ratioBMJBdata/BMJBMC allows for the estimation of the response of high-pTjets.
The events were selected using single small-Rjet triggers, each of which is fully efficient in a givenpTrecoil bin. The triggers used for 200 GeV< precoilT < 550 GeV were prescaled, whereas an unprescaled jet trigger was used forprecoilT >550 GeV.
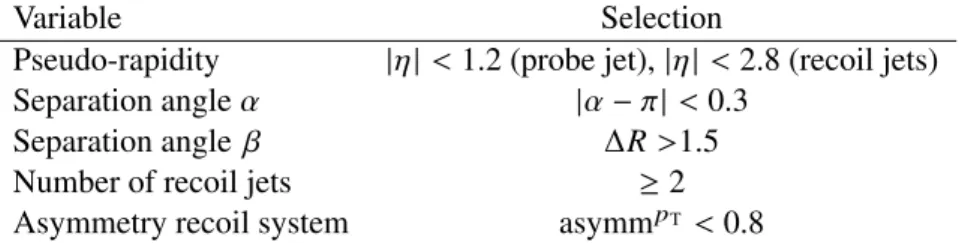
The selection is summarized in Table2. For small-Rjets withpT < 60 GeV, the jet-vertex-tagger [37]
selection is applied to suppress pileup jets. The large-Rprobe jet is required to have|ηdet| < 1.2, while the small-Rjets that constitute the recoil system are required to have|ηdet| <2.8. To select events with multi-jet recoil systems, the leading jet in the recoil system (pjet2T ) is allowed to have no more than 80%
of the total transverse momentum of the recoil system ( asymmpT= pjet2T /pTrecoil<0.8 ). Furthermore, the angle in the azimuthal plane between the leading large-Rjet and the vector defining the recoil system,α, is required to satisfy|α−π| <0.3, and β, the∆Rdistance between the leading large-Rjet and the nearest small-Rjet from the recoil system, is required to be greater than 1.5.
Variable Selection
Pseudo-rapidity |η| <1.2 (probe jet),|η| <2.8 (recoil jets)
Separation angleα |α−π|<0.3
Separation angleβ ∆R>1.5
Number of recoil jets ≥2
Asymmetry recoil system asymmpT <0.8
Table 2: Summary of the event selection for the multi-jet balance analysis.
2The calorimeter isolation variableEisoT is defined as the sum of theETof topological clusters deposited in a cone of size
∆R =0.4 around the photon candidate, excluding an area of size∆η×∆φ =0.125×0.175 centered on the photon cluster, and subtracting the expected photon energy deposit outside of the excluded area.
3The photon identification decision is based on a set of shower shape variables computed from energy deposits in the first and second layers of the electromagnetic calorimeter, and from leakage in the hadronic calorimeter.
4.4 TheRtrkmethod
The uncertainty on the jet energy and jet mass scales for large-Rjets can be determined from the double ratio of track to calorimeter jetpTbetween data and Monte Carlo simulation [4,5]. Using track–jets as a reference in these measurements ensures high precision even in the high-pTregions.
The double ratioRtrk is formed by comparing thertrk in data to Monte Carlo predictions, i.e.
Rtrk = pcalo
T ptrackT
data
pcalo T ptrackT
MC. (6) where the four terms of the ratio represent the jet transverse momentum from the calorimeter or the tracker, in data and Monte Carlo. When this method is applied to another variable X, the ratios of this variable between calorimeter and tracker is defined asrtrkX, and the double ratio RtrkX. The particular case presented above hasX = pT. If the simulation provides a perfect description of the detector, the double ratio should be one. Any deviation from this expectation points at imperfections in the jet response.
The double ratio method is built around the fact that the layered nature of the ATLAS detector provides two independent measurements of the properties of the same jet, from the tracker and calorimeter. Jets formed from inner detector tracks only take into account the energy flow carried by charged particles, while jets formed from calorimeter deposits also measure the energy of neutral particles. The ratiortrk =
pcaloT
ptrackT is therefore expected to be greater than one. Similar ratios can be defined for the jet mass, or any other substructure observable, so this method can be used to estimate the scale uncertainty for a much larger class of jet shape observables.
Large-R jets used in the Rtrk method are selected in the pT range from 150 to 3000 GeV, within the coverage of the inner detector,|η| <1.2.
4.5 Jet response of boostedW bosons and top quarks
A clean signal sample of large-Rjets with boosted W boson and top quark decays can be obtained by selectingt¯tevents in the lepton+jets final state.
The event selection is based on the ATLAS search fort¯tresonances [38] and is summarized in Table3. It requires a central high-pT, isolated muon and significantETmiss. TheW boson transverse mass4mT must be greater than 60 GeV.
The semi-leptonic decay of the top quark pair is reconstructed as the four-vector sum of the charged lepton, the neutrino5and a (possiblyb-tagged) small-Rjet found in a 0.2 cone around the lepton [38] and provides the reference system. The highestpTlarge-Rjet in the opposite hemisphere is the probe jet.
The measurement is performed in fourpT bins. Jets with a 200 < pT < 350 GeV (divided into the bins 200< pT < 250 GeV and 250 < pT < 350 GeV) tend to contain a boostedW boson produced in the top quark decay. AnW-boson enriched region is obtained by vetoing onb-tagged small-Rjets within∆R <
4The transverse mass is defined asm2T=2plepT ETmiss(1−cos(∆φ)), where∆φis the azimuthal angle between the lepton and the direction of the missing transverse momentum.
5TheEmiss
T is assigned to the neutrino, and its longitudinal momentumpzis reconstructed using theW-mass constraint.
Object Selection Description
Muon (µ) Single-muon triggers Trigger
pTµ >25 GeV,|η|< 2.5 Pre–selection tightmuon ID Identification
∆Rµ,j et >0.4 Isolation ETmiss ETmiss>20 GeV,mT >60 GeV
Small-RJets (J2) pT>25 GeV Jet selection
at least oneb-tagged jet (70% WP) Flavour Tagging at least one jet with∆R(j, µ) <1.5 Boosted top decay
Large-RJets ∆Rj,J >2 Opposite hemispheres
200< pT <250 GeV ∆Rb,J > 1 BoostedWsample
250< pT <350 GeV ∆Rb,J > 1 b-jet veto
350< pT <500 GeV ∆Rb,J < 1 Boosted top,b-jet matched
0.5< pT <1 TeV High-boost sample
Table 3: Summary of the event selection for the top quark events decaying into lepton+jets, to be used for top quark andW boson mass calibration.
Jet mass [GeV]
Events / 5 GeV
0 2000 4000 6000
8000 ATLAS Preliminary µ + jets, |η| < 2.0 = 13 TeV, 33 fb-1
s
R=1.0 Trimmed anti-kt
LC+JES+JMS
350 GeV
T≤ 200 GeV < p
R(b; jet) > 1
∆ b-jet veto:
2016 Data t t Single top W+jets Z+jets Dibosons MC syst. error
Jet mass [GeV]
0 20 40 60 80 100 120 140 160 180 200
Data / MC
0.5 1
1.5 Jet mass [GeV]
Events / 5 GeV
0 200 400 600
800 ATLAS Preliminary = 13 TeV, 33 fb-1
s
R=1.0 Trimmed anti-kt
LC+JES+JMS
| < 2.0 η + jets, | µ
1000 GeV
T≤ 350 GeV < p
R(b; jet) < 1
∆ b-jet tag:
2016 Data t t Single top W+jets Z+jets Dibosons MC syst. error
Jet mass [GeV]
0 50 100 150 200 250 300 350
Data / MC
0.5 1 1.5 2 2.5
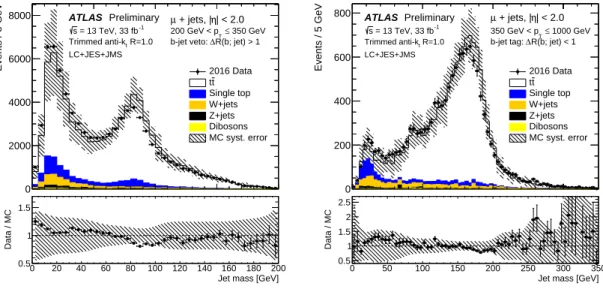
Figure 3: The distributions of the jet invariant mass for large-Rjets in a sample enriched in boostedW bosons (a) or boosted top quarks (b). The SM template estimated from MC is rescaled to match the observed yield. The lower plots display the data/MC ratio. The error bars on the data represent the statistical uncertainty. The dashed uncertainty band on the MC template includes the systematic uncertainties due to signal and detector modelling.
1 of the large-Rprobe jet. Jets with 350 < pT < 1000 GeV (divided into the bins 350< pT <5000 GeV and 500< pT <1000 GeV) tend to contain the boosted top quark decay products. A top-enriched region can be defined by requiring ab-jet within∆R<1 of the probe jet.
Fig.3shows the invariant mass of the large-Rjets for data and Monte Carlo simulation in the W-enriched and top-enriched regions. The nominal Monte Carlo simulation is shown for signal, as well as for back- grounds from single top,W +jets,Z +jets and diboson events.
The position and shape of the mass peaks carry information about the jet mass scale and resolution.
Values for the JMS and JMR are extracted from the jet mass spectrum by fitting the data with templates constructed from Monte Carlo simulation. Templates for the large-R jet invariant mass spectrum are constructed from simulation, by folding jets constructed with stable final-state particles with a response function, as documented in Ref. [1], which was first used in the analysis of 2012 data [2]. For a given variablex, the truth-level distribution is convoluted with a response function depending on two variables:
the scalesand the resolutionr, according to the following relation:
hxfolded|xtruth,precoT i= sxreco+(xreco− hxreco|xtruth,pTrecoi)(r −s) (7) This produces detector-level distributions that are a function of the scale and resolution, and have been shown to describe the result for the full Monte Carlo simulation for the nominal scale and resolution (r = s =1). The data distribution is then compared to this set of parametric detector-level distributions, and the values ofr andsthat best match data are extracted using a fit, together with their uncertainties.
Constraints on the JES and JER can be obtained by fitting the distribution of the ratio of probe jet pT and the recoiling semi-leptonic top quark decay system (charged lepton+reconstructed neutrino+b-jet).
This distribution has a distinctive peak around 1 reflecting the transverse momentum balance. The mean and the width of the peak in this distribution are sensitive to the JES and JER, respectively.
5 Results for the jet p
Tresolution
The jet energy resolution is primarily estimated from dijet events. A measurement in at¯tsample provides anin-situconstraint on the JER in topologies such as boostedW boson and top quarks.
5.1 JetpTresolution from dijet events
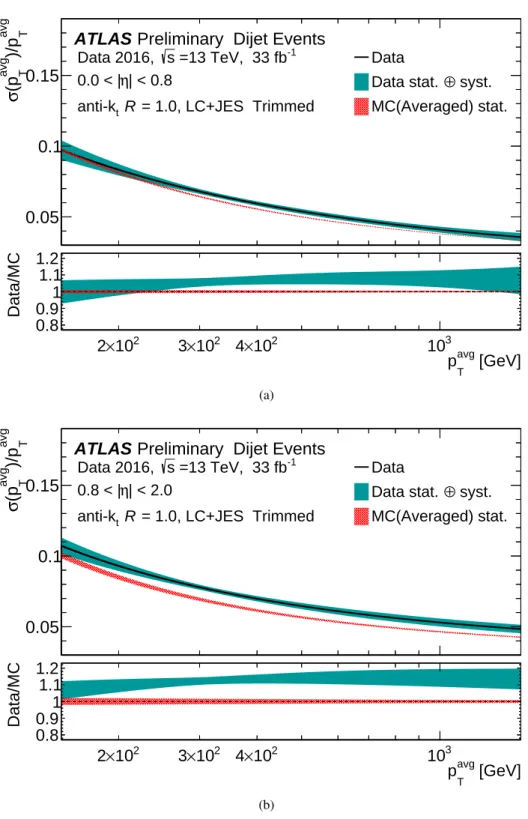
The measured jet pT resolution is shown in Fig.4, as a function of the average pT of the two jets. The upper panel corresponds to jets in the pseudorapidity range |η| <0.8, the lower panel to 0.8 < |η| <
2.0. The particle-level imbalance was subtracted as described in Section4.1. The total uncertainty on the measurement is shown as a green band.
The measured resolution is compared to the resolution determined in Monte Carlo simulation. The red band in both panels corresponds to the mean and envelope of three Monte Carlo predictions, Pythia8, Herwig++and Sherpa2.1. Smaller panels below each plot present the ratio of data and Monte Carlo expectations (JER).
The measured resolution in the central region is in reasonable agreement with the predicted resolution.
The uncertainty on the jet energy resolution is approximately 2% at 300 GeV. The uncertainty increases slowly at highpT, but remains well below 5% up to 1 TeV. The resolution of forward jets is underesti- mated by the simulation, typically by 5-10%. The choice of the Monte Carlo generator has a small effect on the resolution.
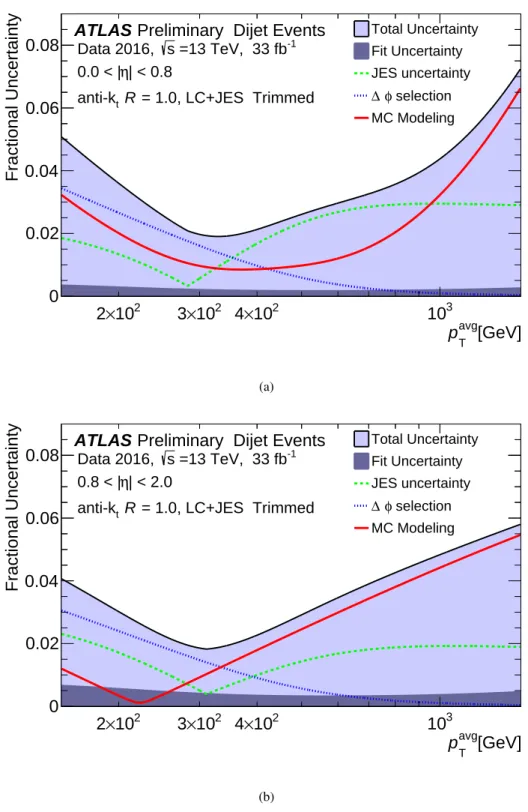
The total uncertainty on the determination of the JER is shown in Fig.5as a function of the average pT and in two pseudo-rapidity regions. A breakdown of the uncertainties into individual sources is presented.
The small-R jet pT scale is varied within its uncertainty, leading to a 2-3% variation in the measured resolution, labelled as JES uncertainty in Fig.5. The∆φrequirement is also varied by ±0.5, which has
an effect primarily for lowpTjets. Finally, the MC modelling uncertainty is estimated as the variation in the result using different generators predictions for the particle-level momentum imbalance (Pythia8 is chosen as a nominal sample, and Herwig++and Sherpa2.1 as the variations).
5.2 JES and JER fromtt¯events
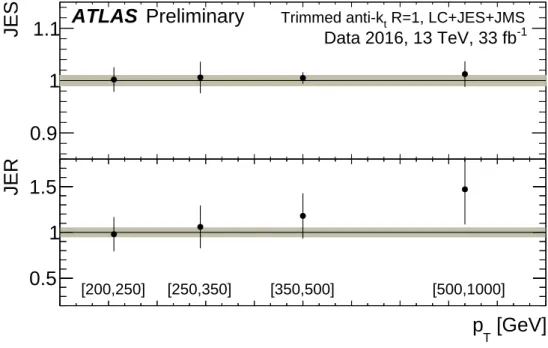
The JES and JER are extracted simultaneously from the template fit to the ratio of the transverse momenta of the large-Rjet and the lepton+jet top decay candidates are shown in Fig.6. The fit is performed in four pT bins. The measured jet energy scale is in agreement with simulation at the percent level, within the uncertainties (1% statistical, 2% modeling). The measured JER is in agreement with simulation within the large uncertainties(5-10% statistical, 20% modeling).
Experimental uncertainties are estimated by varying the scale and resolution of the reconstructed muons, ETmiss and small-R and large-R jets within uncertainties and repeating the fit. Modelling uncertainties are estimated from the variation of the fit result when using different Monte Carlo generators (Powheg + Pythia8, Powheg +Herwig++, MC@NLO+ Herwig++) to create the SM template for top quark pair production. These include variations of the NLO matrix element code, of the parton shower model and of the settings for initial and final state radiation. Experimental uncertainties are negligible in comparison with the modelling uncertainties.
Although this method has much larger uncertainties than the dijet balance method, it provides anin-situ verification of the jetpTresponse in data for boostedW bosons and top quarks.
avg T)/pavg T(pσ
0.05 0.1 0.15
ATLAS Preliminary Dijet Events =13 TeV, 33 fb-1
s Data 2016,
| < 0.8 η 0.0 < |
= 1.0, LC+JES Trimmed
tR anti-k
Data
syst.
⊕ Data stat.
MC(Averaged) stat.
[GeV]
avg
pT
102
×
2 3×10² 4×10² 103
Data/MC
0.8 0.9 1 1.1 1.2
(a)
avg T)/pavg T(pσ
0.05 0.1 0.15
ATLAS Preliminary Dijet Events =13 TeV, 33 fb-1
s Data 2016,
| < 2.0 η 0.8 < |
= 1.0, LC+JES Trimmed
tR anti-k
Data
syst.
⊕ Data stat.
MC(Averaged) stat.
[GeV]
avg
pT
102
×
2 3×10² 4×10² 103
Data/MC
0.8 0.9 1 1.1 1.2
(b)
Figure 4: Comparison of the measured jetpTresolution in data and Monte Carlo simulation, both as a function of the average jetpT, after subtraction of the truth resolution. Figure (a) corresponds to the central region (|η| <0.8), figure (b) to the pseudo-rapidity interval 0.8 < |η| < 2.0. The green error band represents the statistical and systematic uncertainties added in quadrature. The red band shows the average of three Monte Carlo simulations and their envelope. The smaller panels below each plot show the JER, the ratio of the resolution in the Monte Carlo simulation and the measured resolution.
[GeV]
avg
pT
102
×
2 3×10² 4×10² 103
Fractional Uncertainty
0 0.02 0.04 0.06 0.08
Total Uncertainty Fit Uncertainty JES uncertainty
selection φ
∆
MC Modeling
ATLAS Preliminary Dijet Events =13 TeV, 33 fb-1
s Data 2016,
| < 0.8 η 0.0 < |
= 1.0, LC+JES Trimmed
tR anti-k
(a)
[GeV]
avg
pT
102
×
2 3×10² 4×10² 103
Fractional Uncertainty
0 0.02 0.04 0.06 0.08
Total Uncertainty Fit Uncertainty JES uncertainty
selection φ
∆
MC Modeling
ATLAS Preliminary Dijet Events =13 TeV, 33 fb-1
s Data 2016,
| < 2.0 η 0.8 < |
= 1.0, LC+JES Trimmed
tR anti-k
(b)
Figure 5: The uncertainty on the ratio of the jetpTresolution measured in dijet events and in Monte Carlo simula- tion as a function of the average jetpT. The fit uncertainty is indicated with a dark fill colour, the total uncertainty with a light fill colour. Contributions from three sources are estimated separately by propagating uncertainty on the pT scale to the measurement, by varying the∆φselection and by varying the Monte Carlo generator. Figure (a) corresponds to the central region (|η|<0.8), figure (b) to the pseudo-rapidity interval 0.8<|η|<2.0.
200245290335380425470515560605650
JES
0.9 1
1.1 ATLAS Preliminary
Trimmed anti-kt R=1, LC+JES+JMS Data 2016, 13 TeV, 33 fb-1[GeV]
p
TJER
0.5 1 1.5
[200,250] [250,350] [350,500] [500,1000]
Figure 6: Summary of thein-situconstraints on the modelling of the large-Rresponse int¯tevents with a lepton+jets final state. Round markers represent the ratio data/Monte Carlo for the jetpTscale (JES) and resolution (JER). The error bars represent the total uncertainty. Statistical uncertainties are indicated with the inner error bar (only visible on some of the points). The grey band, corresponding to±1% for the JES and±5% for the JER, is drawn as a reference. The results in the first twopTbins (200< pT <250 GeV and 250< pT <350 GeV) correspond to a sample of boostedW bosons, the highest two bins to boosted top quarks.
6 Results for the jet p
Tscale
In this section the results from the various methods constraining the jet transverse momentum scale are presented.
6.1 JetpTscale fromγ–jet events
Theγ–jet events balance method provides a precise constraint on the jetpTscale.
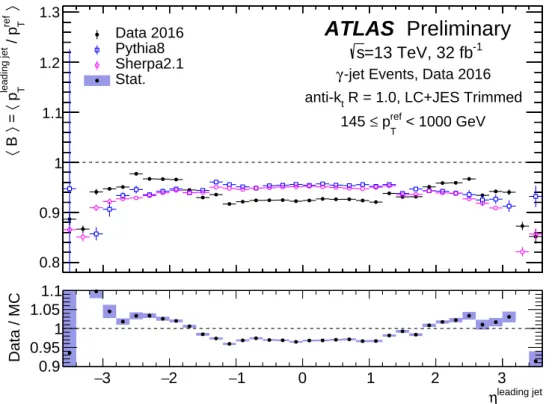
The uniformity of the large-Rjet response across the detector geometry is studied in Fig. 7. The main panel shows the values of theγ-jet balance Bas a function of the large-Rjet pseudorapidity in data and simulation, and the lower panel the ratio of data to simulation. The relative response in the central region, out to |η| < 1.2, does not change by more than 1%. Thein-situjet pT constraints derived in this note correspond to that interval and are unaffected by the effect of detector structures. The measured response in the forward region, however, shows considerable structure, and a gradual increase of the data/MC ratio.
〉ref T / pleading jet T p〈 = 〉 B 〈
0.8 0.9 1 1.1 1.2 1.3
leading jet
η
−3 −2 −1 0 1 2 3
Data / MC
0.9 0.95 1 1.05
1.1
ATLAS Preliminary
=13 TeV, 32 fb-1
s
-jet Events, Data 2016 γ
R = 1.0, LC+JES Trimmed anti-kt
< 1000 GeV
ref
pT
≤ 145 Data 2016
Pythia8 Sherpa2.1 Stat.
Figure 7: The ratio of the fitted mean values of theγ–jet balance distributions in data and Monte Carlo simulation versus the pseudo-rapidity of the large-R jet. The blue uncertainty band on the relative response (JES) in the Data/MC ratio at the bottom represents the statistical uncertainty.
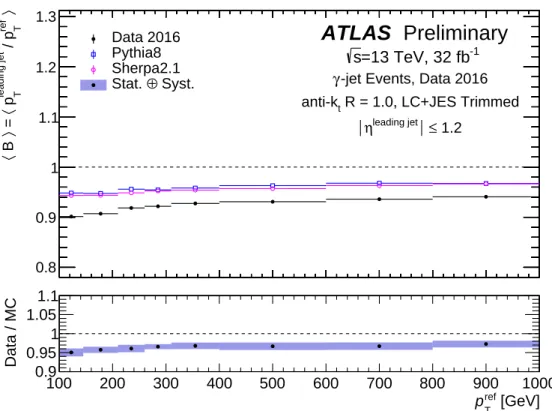
In Fig.8the result is plotted as a function of the referencepTfor large-Rjets in the region|η| <1.2. The ratio between the result obtained in data and MC simulation corresponds to the extracted jet energy scale, and a small dependence onpTis observed, at least in the low–pTregion.
〉ref T / pleading jet T p〈 = 〉 B 〈
0.8 0.9 1 1.1 1.2 1.3
[GeV]
ref
pT
100 200 300 400 500 600 700 800 900 1000
Data / MC
0.9 0.95 1 1.05
1.1
ATLAS Preliminary
=13 TeV, 32 fb-1
s
-jet Events, Data 2016 γ
R = 1.0, LC+JES Trimmed anti-kt
≤ 1.2
leading jet
η Data 2016
Pythia8 Sherpa2.1
Syst.
⊕ Stat.
Figure 8: The ratio of the fitted mean values of theγ–jet balance distribution in data and Monte Carlo simulation versus referencepT(the photonpTscaled by the cosine of the angle between the photon and the jet) in data and MC simulation. The statistical uncertainties on the balance distributions are included but are too minute to visualize. The blue uncertainty band on the relative response (JES) includes the combined statistical and systematic uncertainty.
The systematic uncertainties on thein-situ pT scale arise in four main areas; extra radiation outside the jet affecting the balance, the measurement of the photon, the presence of pileup jets, and the Monte Carlo physics modelling. The effects of extra radiation on the balance are assessed by varying the topological selections and the overlap removal∆R(J1, j2) between the large and small-R jets. The effects of the photon measurement are assessed by varying the energy scale and resolution of the photon calibration, as well as by varying the measured photon purity in the purity correction. The effects of pileup jets on the calibration are estimated by varying the jet–vertex–tagger (JVT) [37] selection threshold on the small-R jets. Lastly, the analysis is repeated with Sherpa2.1 MC samples, in place of the nominal Pythia8 samples, to assess the modelling uncertainty. The different sources of uncertainty are then added in quadrature.
As shown in Fig.9, the overall combined systematic and statistical uncertainty is approximately 1% for theprefT range from 100 GeV to 1 TeV. The photon energy scale uncertainty is the dominant source over most of thepT range. The total uncertainty is of the same order as the total JES uncertainty forR = 0.4 jets in run 1 at √
s=8 TeV [10,11].
[GeV]
ref
pT
100 200 300 400 500 600 700 800 900 1000
Fractional JES uncertainty
0 0.005 0.01 0.015
0.02
ATLAS Preliminary
=13 TeV, 32 fb-1
s
-jet Events, Data 2016 γ
R = 1.0, LC+JES Trimmed anti-kt
≤ 1.2
leading jet
η Syst.
⊕ Stat.
Statistical
Energy Scale and Res.
γ
MC Modeling Event Topology Veto Overlap
φ
∆
Pileup (JVT) Purity γ
Figure 9: A break-down of the systematic uncertainties on thein-situconstraint on the JES, the ratio of the jetpT
response in data and Monte Carlo simulation, obtained with theγ–jet method, as a function of the referencepT.
6.2 JetpTscale from the multi-jet balance method
Figure10shows the distribution of the multijet balance for leading-pTlarge-Rjets as a function of refer- encepT. The balance increases from approximately 0.94 atpT ∼200 GeV to about 0.98 for jets with 1
< pT <3 TeV. The Monte Carlo simulation shows a similar trend. The shaded band in the data/MC ratio plot of Fig.10represents the total uncertainty of the measurement.
The reference system in the multi-jet-balance method is made up of small-R jets. These have been calibrated using severalin-situapproaches described in Ref. [10,11]. Therefore, the uncertainty in the energy scale of the jets of the recoil system depends on the systematic and statistical uncertainties on each in-situprocedure. To propagate the uncertainty to the multi-jet-balance method, all input components (including those referring to pile-up and punch-through) are individually varied by ±1σ and the full iterative analysis procedure repeated. In this analysis, no assumption is made on the flavor of the recoil jets, and this lack of knowledge is also a source of systematic uncertainty. The uncertainty on the multi- jet-balance observable due to the jet flavor response is evaluated using a correlated propagation of the small-Rjet flavor response uncertainties, i.e. all jets are shifted simultaneously. The jet flavor composition uncertainty is propagated to the multi-jet-balance observable for the first, second and third recoil jet independently, with the final composition uncertainty obtained from the quadrature sum of the three variations. In addition to the jet calibration and uncertainties in the reference scale, the event selection criteria and the modelling in the event generators directly affect thepTbalance used to obtain the multi- jet-balance results. The impact of the event selection criteria is investigated by shifting each cut up and
102
×
3 4×10² 103 2×10³ 3×10³
〉
recoil T/p
lead jet Tp 〈
0.94 0.96 0.98 1 1.02 1.04 1.06 1.08
[GeV]
recoil
p
T 102×
3 103 2×10³ 3×10³
Data / MC
0.94 0.96 0.98 1
Data Pythia Sherpa 2.1 Herwig++
syst.
⊕ Stat.
ATLAS Preliminary
= 13 TeV, 33 fb-1s
< 1.2
lead jet
η Multi-jet Events,
R = 1.0, LC+JES Trimmed Anti-kt
0.4 LC Recoil system: anti-kt
Figure 10: Mean transverse momentum balance for leading-pTlarge-Rjets (|η| ≤1.2 ) balanced against a system of at least two small-Rjets (pT≥25 GeV,|η| ≤2.8 ), as a function of thepTof the recoil system. In the main panel the measured balance (black markers) is compared to the prediction of Monte Carlo simulations based on several generators: Pythia8 (red, square markers), Sherpa2.1 (blue, triangular markers) and Herwig++(pink, triangular markers). In the smaller panel the ratio of data and Monte Carlo simulation (JES) is presented. The shaded band indicates the total uncertainty on the measurement, described in detail in the text.
down by a specified amount and observing the change in the multi-jet-balance variable. Using a similar approach to systematic uncertainties as the small-R in-situanalysis, the transverse momentum threshold for recoil-jets is shifted by±5 GeV, theasymmpT =pjet2T /precoilT is shifted by±0.1, the angleαis shifted by±0.1 and the angle βis shifted by±0.4. The uncertainty due to MC modelling of multi-jet events is estimated from the symmetrised envelope of multi-jet-balance results obtained from the envelope of the nominal results obtained with Pythia8 to those obtained with Sherpa2.1 and Herwig++.
Figure 11 shows the breakdown of the fractional uncertainties on the jet energy scale derived from leading-pTlarge-Rjets recoiling against multiple small-Rjets.
[GeV]
jet
p
T10
2×
2 3 × 10
210
32 × 10
33 × 10
3Fractional JES uncertainty
0 0.01 0.02 0.03 0.04 0.05
ATLAS Preliminary
= 13 TeV, 33 fb-1s Data 2016,
< 1.2
lead jet
η Multi-jet Events,
R=1.0 LC+JES Trimmed Anti-kt
0.4 LC Recoil system: anti-kt
Total uncertainty Statistical uncertainty
In-situ R=0.4 LC JES uncertainty Flavor composition, response
Punch-through, average 2016 conditions Pileup, average 2016 conditions
MC modeling
Event selection criteria
Figure 11: The fractional uncertainty on the ratio of the jetpTresponse in data and Monte Carlo simulation, derived with the multi-jet balance method. The JES is determined in events where the leading-pTlarge-Rjets withpT ≥ 300 GeV,|η| ≤1.2 ) is balanced against a system of at least two small-Rjets (pT≥25 GeV,|η| ≤2.8 ). The results are presented as a function of thepTof the large-Rjet.
6.3 JetpTscale from the Rtrkmethod
TheRtrkmethod constrains the jetpTresponse up to apTof 3 TeV. The calorimeter-to-tracker jetpTratio (and the data-to-MC double ratio) are shown in Fig.12. Deviations of the double ratio indicate imperfect modelling of the calorimeterpTresponse (assuming the tracker response is correctly modelled).
Systematic uncertainties due to physics and detector mismodelling are investigated by using an alternative MC generator (Herwig++) and three alternative settings for the tracker simulation. The curves in Fig.12 labelledTracking efficiency,Tracking fake rateandTracking q/pcorrespond to simulated samples with a reduced tracking efficiency, increased fake rate and biased curvature estimate, respectively. Overall, the results are compatible within a few percent.
The envelope of the different curves indicates the systematic uncertainty on the jetpT scale. The contri- butions of the several classes of uncertainties to the total uncertainty are shown in Fig.13, for values of m/pTof about 0.1, corresponding to the kinematics of large-Rjets containgWbosons and top quarks.
500 1000 1500 2000 2500 3000
〉
trkTp
r 〈
1.5 2 2.5 3 3.5
4 ATLAS Preliminary = 13 TeV, 33 fb-1
s
= 1.0, LC+JES Trimmed
tR anti-k
| < 1.2 η > 150 GeV, |
jet
pT
Data 2016 Herwig++ dijet Pythia8 dijet Tracking efficiency Tracking fake rate Tracking q/p
[GeV]
jet
pT
500 1000 1500 2000 2500 3000
〉 trk
Tp R〈
0.9 0.95 1 1.05
1.1
Figure 12: The constraints on the jetpTscale obtained with theRtrk method, as a function of the jetpT. Data is compared with two generators, and to three additional tracking models for the default generator Pythia8.The main panel displays the ratio of calorimeter and track-jets. The double ratio of data over Monte Carlo is shown in the smaller panel below.
[GeV]
jet
p
T10
2×
3 10
32 × 10
33 × 10
3Fractional JPtS uncertainty
0 0.02 0.04 0.06 0.08 0.1 0.12 0.14 0.16 0.18 0.2
ATLAS Preliminary
= 0.2) Rsub
= 0.05, Trimmed (fcut
= 1.0 jets, LC+JES+JMS
t R k anti-
= 13 TeV s
Data 2016,
= 0.10
jet
pT jet/
| < 2, m ηjet
|
Total uncertainty
Baseline Modelling
Tracking Statistical
Figure 13: The total uncertainty on the relative jet transverse momentum scale in data and Monte Carlo simulation associated with theRtrkmethod is plotted a function of jetpT. The contributions from several sources are indicated as well. The baseline uncertainty represents the deviation of the double ratio from 1.