ATLAS-CONF-2012-164 24/05/2013
ATLAS NOTE
ATLAS-CONF-2012-164
December 2nd, 2012 Revision: May 23rd, 2013
The underlying event in jet events at 7 TeV with the ATLAS experiment
ATLAS Collaboration
Abstract
Particle distributions sensitive to the underlying event in calorimeter jet events have been measured with the ATLAS detector at the LHC, based on 37 pb
−1of proton–proton collision data collected at a centre-of-mass energy of 7 TeV during the LHC run in 2010. Charged particle multiplicity, charged and inclusive
Pp
Tdensities and mean charged-particle p
Tin the regions of each event, azimuthally transverse to the hardest jet, are presented as functions of the hardest jet p
Tfrom 20 GeV to 800 GeV. The mean p
Tvalue of the charged particles is also presented as a function of their multiplicity. Separate inclusive jet and exclusive dijet event selections, and event-by-event transverse min
/max regions, are included in this study for all observables. When compared to the predictions of different Monte Carlo models, the data show sensitivity to the modelling of the underlying event.
A truncation of the p
Tdistribution in the inclusive-jet selection caused a shift of the high leading jet p
Tpart of the inclusive jet topology profiles in Figure 2 (top row) and Figure 4 (left column, both rows) outside of the systematic uncertainties. The Figure 5 (left column, both rows) profiles changed within the systematic uncertainties. In Figure 4 (bottom right corner), the uncertainty was erroneously overestimated before, which is also corrected. No other exclusive jet topology profiles were a
ffected. The physics conclusions are unchanged.
c
Copyright 2013 CERN for the benefit of the ATLAS Collaboration.
Reproduction of this article or parts of it is allowed as specified in the CC-BY-3.0 license.
1 Introduction
To perform precise measurements or search for new physics phenomena at hadron colliders, it is essential to have a good understanding not only of the hard scattering process, but also of the accompanying interactions of the rest of the proton – collectively termed the “underlying event” (UE). The UE can receive contributions from initial and final state radiation (ISR, FSR), leftover partons after the hard scatter, termed beam–beam remnants (BBR), and additional hard scatters in the same proton-proton collision, termed multiple parton interactions (MPI). It is impossible, even in principle, to uniquely separate the UE from the hard scattering process on an event-by-event basis. However, observables can be measured which are sensitive to its properties.
The behaviour of soft interactions cannot reliably be calculated with perturbative QCD methods, due to the divergence of the QCD coupling at low scales, and is hence typically modelled in a phenomenologi- cal manner by Monte Carlo (MC) event generator programs. These models invariably contain parameters whose values are not a priori known or calculable and hence must be fitted (“tuned”) to experimental data. Predictivity of UE modelling is important as it forms an irreducible background of particle activity in all hard-scale processes studied at the LHC, including in phase space regions where the UE has not been or cannot be directly characterised. The greater the range of UE measurements adequately described by a tuned model – for example di
fferent observables, hard process types, centre-of-mass energies, col- liding particles, etc. – the more that model may be considered to be predictive and hence trustworthy for modelling events which may be a background to rare physics processes.
This note reports the measurement of UE observables in inclusive jet and exclusive dijet events, performed with the ATLAS detector [1] at the LHC using proton–proton collisions at a centre-of-mass energy of 7 TeV. The ATLAS jet data from the 2010 run contains sufficient events to perform an exten- sive underlying event analysis, probing jet p
Tranges above 500 GeV for the first time. UE observables have been measured previously with dijet and Drell-Yan events in Tevatron p p ¯ collisions by the CDF experiment in Run I [2] and Run II [3], at centre-of-mass energies of
√s
=1.8 TeV and 1.96 TeV re- spectively. The LHC experiments, ATLAS [4, 5], ALICE [6] and CMS [7, 8] have thus far measured the UE in pp collisions at 900 GeV and 7 TeV, using highest-p
Tcharged particles, track-jets and leptonically decaying Z
0bosons to define the hard scattering direction in the event.
This measurement based on calorimeter jets is complementary to the ATLAS charged particle jet UE measurement, where for the first time variation in the mean value of UE observables with jet radius R was demonstrated [9]. It extends previous studies of the UE by probing a much higher p
Tscale, the exclusive dijet topology and by measuring the sum of the transverse energy in the full range of ATLAS calorimeter acceptance, the latter following the ATLAS measurement of forward energy flow [10].
2 The underlying event observables
The UE observables presented in this note are constructed both from reconstructed charged particle tracks with p
T>0.5 GeV and from energy clusters reconstructed in the calorimeters. Tracks are required to be within
|η| <2.5 for all observables
1by the acceptance of the ATLAS tracker, while cluster observables are constructed separately for pseudorapidity acceptances of
|η| <4.8 and
|η| <2.5, to provide one measurement with full forward coverage and one compatible with the more restricted central tracker acceptance. Lower momentum particles are not included as they are unlikely to deposit significant energy
1The ATLAS reference system is a Cartesian right-handed coordinate system, with the nominal collision point at the origin.
The anti-clockwise beam direction defines the positivez-axis, while the positivex-axis is defined as pointing from the collision point to the centre of the LHC ring and the positivey-axis points upwards. The azimuthal angleφis measured around the beam axis and the polar angleθis the angle measured with respect to thez-axis. The pseudorapidity is given byη=−ln tan(θ/2).
Transverse momentum is defined relative to the beam axis aspT= q
p2x+p2y=psinθ.
∆φ
−∆φ
leading jet
towards
|∆φ|<60◦
away
|∆φ|>120◦
transverse 60◦<|∆φ|<120◦ transverse
60◦<|∆φ|<120◦
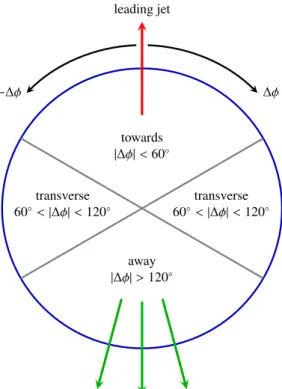
Figure 1: Definition of regions in the azimuthal angle with respect to the leading jet. The balancing parts of the jet system are indicated with green arrows, compatible with the dominant dijet event topology.
Multijet topologies, encountered in the inclusive jet event selection, are expected to contribute more substantially to the transverse regions than the geometry shown here.
in the ATLAS calorimeters, due to interactions with material upstream of the calorimeters and bending in the magnetic field.
These detector-level objects have been identified [10] with true hadron-level quantities in terms of primary particles, i.e. particles with a mean proper lifetime
τ &0.3
×10
−10s either directly produced in the pp interactions or in the decay of particles with a shorter lifetime. The selected tracks correspond to primary charged particles with p
T>0.5 GeV and
|η|<2.5, and ATLAS clusters are equivalent (when summed over) to primary charged particles with momentum p
>0.5 GeV or primary neutral particles with p
>0.2 GeV. Lower momentum particles are not included as they are unlikely to reach the ATLAS calorimeters due to material interactions and bending in the magnetic eld.
The observables used in this study, defined in Table 1, employ the conventional UE azimuthal division of events into regions relative to the direction of the “leading” object in the event. The leading object in this case is defined by the calorimeter-based anti-k
T[11] jet with a radius of R
=0.4 and having the largest p
T, after application of jet selection criteria as described in Section 4. The azimuthal regions used are defined with respect to the
φof the leading jet (i.e. the jet with the largest p
T, which is denoted by p
leadT): a 120
◦“towards” region surrounds the leading jet, an “away” region of the same size is azimuthally opposed to it and two “transverse” regions each of 60
◦are defined orthogonal to the leading jet direction [2]. This is illustrated in Figure 1, with the azimuthal angular di
fference from the leading jet defined as
|∆φ|=|φ−φlead jet|.
As the towards region is dominated by the leading jet and in the dominant dijet configuration the away
region is dominated by the balancing jet, the transverse regions are the most sensitive to accompanying
particle flow, i.e. the UE. In addition, the transverse regions may be distinguished event-by-event based
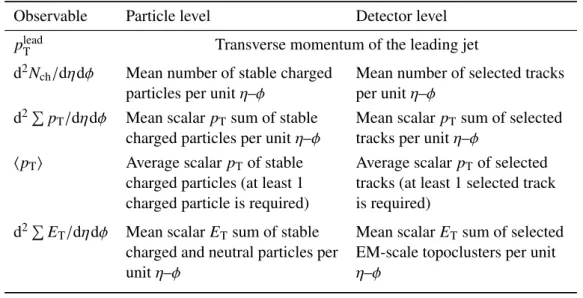
Table 1: Definition of the measured observables at particle and detector level. Particle level observables for momentum use only particles with p
T >0.5 GeV, and for energy use p
>0.5 GeV for charged particles and p
>0.2 GeV for neutral particles. Tracks are selected if they pass the criteria described in Section 4. The charged particle mean transverse momentum
hp
Tiis constructed on an event-by-event basis and then averaged over the events. The trans-max and -min sub-regions are defined per-event and are also specific to the observable being considered: in principle, if not in practice, the trans-max side for N
ch(i.e. the transverse side in an event which contains more charged particles) could be different from the trans-max side for
Pp
Tin the same event.
Observable Particle level Detector level
p
leadTTransverse momentum of the leading jet d
2N
ch/dηdφ Mean number of stable charged
particles per unit
η–φMean number of selected tracks per unit
η–φd
2Pp
T/dηdφ Mean scalar p
Tsum of stable charged particles per unit
η–φMean scalar p
Tsum of selected tracks per unit
η–φhpTi
Average scalar p
Tof stable charged particles (at least 1 charged particle is required)
Average scalar p
Tof selected tracks (at least 1 selected track is required)
d
2PE
T/dηdφ Mean scalar E
Tsum of stable charged and neutral particles per unit
η–φMean scalar E
Tsum of selected EM-scale topoclusters per unit
η–φon which one has more activity: summed over events, observables in the more- or less-active transverse region are then respectively referred to as “trans-max” and “trans-min” observables and the di
fference of those is referred to as “trans-di
ff”. Of these, the trans-max is more likely to be a
ffected by wide-angle emissions associated with the hard process and hence the trans-min observables have the potential to be more sensitive to MPI activity. The trans-di
ffis very sensitive to hard initial and final-state radiation.
This idea was suggested in Refs. [12, 13] and has been used in CDF’s underlying event analyses.
As mentioned, this azimuthal segmentation of events around the leading jet direction is based on an assumption of dominant dijet topologies. Measurements of LHC jet rates [14] indicate that events with three or more jets are expected to contribute to inclusive jet UE observables and hence there will be substantial contributions to the transverse regions from the hard partonic scattering. While this subverts the intention of the azimuthally segmented observable definitions, the resulting interplay of hard and soft event features is itself interesting and relevant to modelling of LHC signal events. Hence, the trans- verse UE observables are studied both in inclusive jet events where multijet topologies contribute and in the subset of exclusive dijet events where the connection of the observable definition to the dominant geometry of dijet systems is made explicit.
3 Monte Carlo models of the underlying event
In scattering processes modelled by perturbative QCD two-to-two parton scatters, at su
fficiently low p
Tthe partonic jet cross-section exceeds that of the total hadronic cross-section. This apparent problem
is resolved by allowing the possibility of MPI in a given hadron-hadron interaction. In this picture, the
ratio of the partonic jet cross-section to the total cross-section is interpreted as the mean number of parton
interactions in such events. This idea is implemented in several Monte Carlo event generators.
Recent phenomenological extensions of this basic picture include (non-exhaustively) further low p
Tscreening of the partonic differential cross-section [15], use of phenomenological transverse hadronic- matter distributions (including dependence on the Bj¨orken x of the hard interaction [16]), stochastic reconfiguration of colour string or cluster topologies [15–17], saturation of parton densities at low-x [17]
and connection to elastic scattering and cut-pomeron models via the optical theorem [18].
Such models typically introduce several parameters, which are to be tuned to data at different centre- of-mass energies and for a variety of hadronic processes. Models which can successfully describe mini- mum bias and UE observables in a wide range of initial and final state configurations can be applied with greater confidence to modelling of UE effects in regimes in which they have not been directly measured, e.g. those key to new physics searches. MC tuning in ATLAS has made extensive use of ATLAS and Tevatron underlying event and minimum bias data for a variety of event generators, most notably the P
ythiaand H
erwigfamilies.
In this analysis, simulated inclusive jet events created by the P
ythia6 [15], P
ythia8 [16], H
er-
wig/J
immy[19], H
erwig++[17, 20] and A
lpgen+H
erwig/J
immy[21] event generators are used. These are all leading-order parton shower generators, but use different hadronisation models and different parton shower formalisms: the P
ythiafamily uses a hadronisation model based on the Lund string and a p
T- or virtuality-ordered parton shower, while H
erwig/J
immyand H
erwig++implement a cluster hadronisation scheme and their parton showers are ordered in emission angle.
2The Fortran Herwig [19] generator by itself does not simulate multiple partonic interactions: these are added by the J
immy[22] package. The A
lpgengenerator provides leading-order multi-leg matrix element events, i.e. events with more complex hard process topologies than those used by the other generators but omitting loop diagram contributions:
the A
lpgenpartonic events are showered and hadronised by the H
erwig/J
immygenerator combination, making use of MLM matching between the matrix element and parton shower to avoid double-counting of jet production mechanisms.
Tunes have been made for MC generators to match their simulation with data. The P
ythia6 tunes AMBT1 [23] and AUET2B CTEQ6L1 [24], P
ythia8 tune AU2 CT10 [25], H
erwig/J
immytune AUET2 LO
∗∗[26] and Herwig
++tune UE7-2 [27] have been used in this study. Version 6.425 of Pythia was used in all cases other than the DW tune sample, for which version 6.421 was used, and the versions of P
ythia8, H
erwig++, and H
erwig/J
immywere 8.153, 2.5.1 and 6.5.20
+4.31 respectively.
The AMBT1 tune (ATLAS Minimum Bias Tune 1) was the first LHC-data tune of Pythia 6 to be made by ATLAS, constructed primarily using the diffraction-suppressed observables from the early AT- LAS minimum bias (MB) measurements [28]. This tune uses the MRST LO∗ [29] parton density func- tions (PDFs) and the Pythia p
T-ordered parton shower.
The AUET2B series is the latest set of ATLAS underlying event tunes of P
ythia6, which defines parameter sets giving roughly equivalent tune quality for a variety of PDFs [24]. These tunes improve on earlier ATLAS tunes such as AMBT1 by inclusion of a LEP-based retuning of final state shower and hadronisation effects, and by optimising initial state shower parameters by comparison to ATLAS track jet [30], jet shapes [31] and dijet decorrelations [32] data. The AUET2B variant with the leading-order CTEQ6L1 PDF [33] is used here.
The P
ythiaDW tune uses a virtuality-ordered parton shower and a MPI model not interleaved with the ISR. This tune was constructed to describe CDF Run II underlying event and Drell-Yan data and uses the leading-order CTEQ5L1 PDF [34]: it is included here for comparison to previous results and as a semi-distinct MPI model from the more recent P
ythia6 configurations.
P
ythia8 adds to the established P
ythia-family MPI model by interleaving not only the ISR emission sequence with the MPI scatterings, but also the FSR: all three processes compete against each other for
2The Pythiashowers include an angular veto on the first ISR emission to approximate the colour coherence effect implicit in the Herwig angular ordering. The Herwig++shower additionally uses massive splitting functions for heavy quark emissions.
emission phase space in the resulting evolution. The AU2 CT10 tune used is the variant of the latest ATLAS underlying event tune set of P
ythia8, AU2 [25], for the next-to-leading order CT10 PDF [35].
This configuration is used as the standard setup for ATLAS jet sample simulation in current production use, and gives an excellent description of leading-track underlying event data at
√s
=7 TeV.
Two tunes of H
erwig/J
immyare used in this study: the ATLAS AUET2 LO
∗∗tune for stand-alone Herwig/Jimmy, and the older AUET1 CTEQ6L1 used in the Alpgen sample. For Herwig
++the standard 7 TeV underlying event tune UE7-2 for the MRST LO
∗∗PDF was used. This model includes a colour reconnection model – the first for a cluster hadronisation generator – and provides a good description of both leading-track UE and minimum bias data at 7 TeV.
The P
ythia6 AMBT1 and H
erwig++samples were processed through the ATLAS detector simula- tion framework [36], which is based on Geant4 [37]. They were then reconstructed and analysed identi- cally to the data. Reconstructed events were then used to calculate detector acceptances and efficiencies, to correct the data for detector effects. The H
erwig++sample used for unfolding was generated with H
erwig++2.5.0 with the default tune – an older configuration than that shown in the physics comparison plots in this note. All other MC models described were used at the generated stable particle level only.
4 Analysis object selection
This analysis uses the full 2010 dataset of jet events in proton–proton collisions at
√s
=7 TeV, with jets of p
T >20 GeV and
|y| <2.8. Two different trigger systems have been used in this measurement; the minimum bias trigger scintillators (MBTS) and the central jet trigger. The MBTS 1 trigger is activated by charged particles crossing one of the counters of the MBTS system, and has been used to select events with jets having transverse momenta in the range 20–60 GeV, below the threshold of full efficiency of the calorimeter-based jet trigger, above which jet triggers with di
fferent thresholds are used. For each p
T-bin a single trigger chain has been used, chosen as the fully e
fficient (> 99%) trigger with the smallest possible prescale factor [38].
The inclusive jet topology requires no other selection for the jets. For the exclusive dijet selection an additional requirement of one and only one subleading jet was made, with p
subT /pleadT >0.5 and
|∆φ| >
2.5. If any other jet passed the jet selection criteria, the event was rejected. The jets were fully corrected to account for the response of the energy deposited in the calorimeter.
To reject events due to cosmic ray muons and other non-collision backgrounds, events were required to have at least one primary vertex (highest-
Pp
2Tvertex defined as the primary interaction vertex of the event), constrained by the reconstruction to be consistent with the beam-spot position and to have at least five associated tracks, selected as described in Reference [28]. In order to reduce the contributions from pile-up interaction, events with more than one vertex with at least two associated tracks were removed.
The efficiency for collision events to pass these vertex requirements, as measured in a sample of events passing all other event and jet selection requirements, was well over 99%.
Topoclusters constructed from active calorimeter cells have been used both to allow the measure- ment of charged and neutral particles flows in the UE and to extend the pseudorapidity coverage of the measurement beyond the ATLAS central tracker acceptance of
|η|<2.5. The cluster-based observables have been studied separately for the central region (
|η|<2.5) and for full
ηacceptance.
About 429,000 and 99,000 events were selected for the inclusive and exclusive selections respec-
tively. The total luminosity for the corresponding trigger selection was 37.3
±1.2 pb
−1, uncorrected for
trigger prescales.
5 Correction to particle level
To simplify the comparison of these results with theoretical predictions and other experimental studies, the underlying event distributions need to be corrected for selection efficiencies and detector resolution effects. A two-step correction procedure was used, where first the track efficiency corrections were applied for the track based observables, then the remaining detector e
ffects were unfolded to produce observables at particle level which may be directly compared to MC model predictions.
5.1 Track and cluster reconstruction e ffi ciency
To obtain the true number of charged particles, it is necessary to account for the inefficiencies of the track measurement and reconstruction. The e
fficiency of the ATLAS detector to reconstruct a charged particle as a track has been measured previously [28], with the same track selection as used here. Each track was reweighted by the inverse of this efficiency, which also accounts for the fractions of tracks that are reconstructed from secondary particles, fake tracks and particles migrating in from outside of the kinematic range. For tracks with p
T >500 MeV, fakes and migrations from outside the kinematic region were found to be negligible.
For cluster-based observables, the detector simulation must accurately describe the energy response of the calorimeters to low energy particles. The EM-scale cluster energy is corrected directly to the momentum of the charged or neutral hadron without using intermediate local energy corrections. The simulation has been validated using the di-photon invariant mass distribution, M
γγ, for
π0 →γγcandi- dates [10]. Scale factors, which account for any deviations, are applied to the energy of the MC clusters before unfolding the data: these typically deviate from unity by 2–3%, reaching up to 10% in some
ηregions.
5.2 Unfolding
Bayesian iterative unfolding [39] was used to remove the remaining detector e
ffects, using the Ima- giro [40] (v0.9) software implementation.
The Bayesian iterative unfolding method requires two inputs. Firstly a prior probability distribution for the observable: the MC generator level distribution is used for this. Secondly a ‘smearing matrix’
which relates the measured distribution of an observable to its true distribution. The smearing matrix is the probability of a particular event from bin i of the true distribution being found in bin j of the corresponding reconstructed distribution, calculated using MC samples.
The unfolding process is iterated to avoid dependence on the prior probability distribution: the cor- rected data distribution produced in each iteration is used as the prior for the next. In this analysis, two iterations were performed as this gave the smallest residual bias when tested on MC while keeping the statistical uncertainties small. The final corrected values have been calculated using prior distributions and smearing matrices from the Pythia 6 AMBT1 MC sample.
6 Systematic uncertainties
Systematic uncertainties on the measured distributions have been assessed by use of the same unfolding procedure as for central values of observables, but where the input p
leadT, track/cluster p
Tand track/cluster weights have been shifted by
±1σvariations on each source of uncertainty.
The following sources of uncertainty have been included:
Jet reconstruction
These uncertainties, dependent on the jet calibration procedure, the impact of pile-up
on the jet energy, the jet reconstruction efficiency and the jet energy resolution have been calculated
as in Reference [41]. For the UE profiles, they add up to approximately 1%.
Track reconstruction efficiency uncertainty:
Tracking efficiency uncertainties were studied in [28], and the largest were found to be due to the material in the inner detector and the consequence of the
χ2probability cut to remove misreconstructed tracks. The e
ffect of material budget uncertainties in the inner detector was determined to affect the efficiency by a relative difference of 2% in the barrel region, rising to over 7% for 2.3
<|η|<2.5, for tracks with p
T >500 MeV. The maximum di
fference between the fraction of events in data and MC which passed the
χ2probability cut was found to be 10%. This value was taken as a conservative estimate of the systematic uncertainty, applied to tracks with p
T >10 GeV only.
Cluster reconstruction efficiency:
The accuracy with which the MC simulates the energy response of the calorimeters to low energy particles is determined separately for electromagnetic and hadronic particles. An average is then obtained, using the P
ythia6 AMBT1 prediction of the relative contri- bution to
PE
Tby different particle types [10]. For electromagnetic particles the systematic error comes from uncertainties on the extraction of the energy scale from fits to the M
γγdistributions in
π0→γγcandidates. The total uncertainty depends on the
|η|region and is typically 2–4%, but in- creases up to 15% in the regions where different calorimeter subsystems overlap. The uncertainty of the energy response for hadronic particles in the central region (|η|
<2.4), where there is good coverage from the inner tracking detector, is obtained from studies of the ratio of the calorime- ter energy measurement to the inner detector track momentum measurement, for isolated charged pions [41].
Cluster material uncertainty:
The amount of material before the calorimeters affects the
PE
Tdistri- butions as particles can interact and lose some of their energy before reaching the calorimeter. In order to assess the systematic uncertainty from possible discrepancies in the material description, detector corrections are recalculated with an MC sample reconstructed with additional material introduced in the forward region. The results are compared to the nominal unfolded data and the resulting systematic uncertainty is symmetrised to account for the possibility of the MC simulation over-estimating the amount of material.
Pile-up and merged vertices:
The e
ffect of pile-up on the underlying event observables after the tight vertex selection is assessed by using a MC sample realistically modelling the pile-up condition in 2010 data. The largest deviation was observed to be 1%, which is propagated through the unfolding and taken as the systematic uncertainty due to pile-up contributions. This is usually less than a couple of percent, but increases to approximately 5% at high p
leadT.
Unfolding:
The uncertainty due to model-dependence of the unfolding procedure is taken to be the dif- ference between the results of unfolding with each of the two MC samples, P
ythia6 AMBT1 and H
erwig++. For each sample, two di
fferent priors are used: the unmodified generator level distri- bution, and the generator level distribution after reweighting so that the reconstructed distribution matches the data.
7 Results
The main type of distribution used to characterise the UE is a “profile” histogram showing the depen-
dence of an average UE characteristic (e.g. mean transverse region multiplicity) on the
y-axis, as afunction of another event characteristic, binned on the x-axis. In this section several such key distribu-
tions from this analysis are shown, primarily displaying mean UE characteristics as functions of p
leadT(i.e. hard process scale), but also the soft–soft correlation of transverse mean p
Tto transverse charged multiplicity.
In these plots, all observables have been computed for both the inclusive jet and exclusive dijet event selections. The data, corrected to particle level, are compared to predictions of P
ythia6 with the AUET2B CTEQ6L1 and DW tunes, H
erwig/J
immywith the AUET2 tune, P
ythia8 with the AU2 CT10 tune, Alpgen
+Herwig/Jimmy with the AUET1 tune, and Herwig
++with the UE7-2 tune.
To allow direct comparison between total transverse and trans-min/max/diff quantities, between cen- tral and full-η cluster quantities, and between all these results and experiments with di
fferent angular acceptances, the raw quantities are divided by angular area in
η–φspace to produce number and momen- tum densities, d
2N
ch/dηdφ, d2Pp
T/dηdφ, and d
2PE
T/dηdφ. The central transverse observables are normalised by
∆φ∆η=(2
×π/3)×(2
×2.5)
=10π/3. The full charged and neutral particle
PE
Tuses the full pseudorapidity range, so its area normalisation is
∆φ∆η=(2
×π/3)×(2
×4.8)
=19.2π/3. The trans-max, trans-min and trans-diff regions have only half of the corresponding transverse area since by definition they only consider one side in
∆φ.7.1 Charged particle P
p
Tand multiplicity vs. p
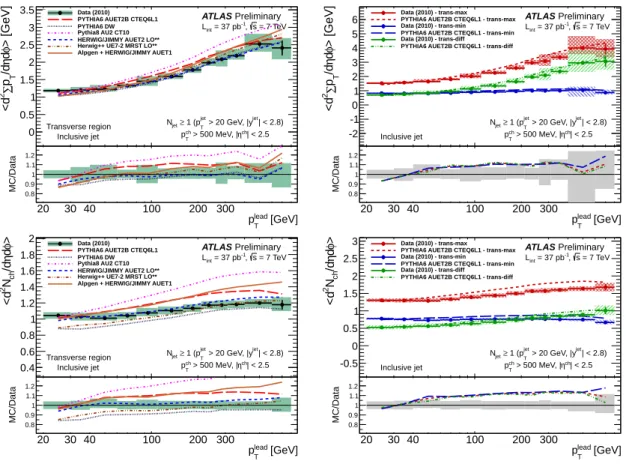
leadTIn Figures 2 and 3 the charged multiplicity and
Pp
Tprofiles are shown as functions of p
leadT. For the inclusive jet events in Figure 2, the total transverse activity increases with p
leadTaccording to both the mean
Pp
Tand N
chmeasures, while for the exclusive dijet event selection in Figure 3 the total transverse
Pp
Tand N
chboth slightly decrease as p
leadTincreases.
The division of the transverse regions into per-event max and min sides, and the corresponding per- event differences between them, the trans-diff, are shown in the right-hand columns of the two figures.
In the inclusive jet events, the trans-max activity (for both
Pp
Tand N
ch) grows with p
leadT, similarly to the total transverse region trend, but its trans-min complement is almost constant over the whole range of p
leadT. This observation is compatible with the interpretation of the trans-min region as being less affected by the hard part of the underlying event; the slow rise of the trans-min profiles with p
leadTmay either indicate the contributions of multijet topologies (which have a larger cross-section for higher jet p
T) or an increase in MPI activity as the hard process scale increases.
The insensitivity of the trans-min region to changes in p
leadTindicates that pure MPI activity can indeed be modelled as plateauing as a function of hard process scale once the scale is hard enough that the proton impact parameters are e
ffectively zero and all collisions are central.
The MC models are notably good at reproducing the qualitative features of the inclusive jet data, but surprisingly the P
ythia6 models, which have received most UE tuning attention in recent years, are further from the data than the less flexible and less tuned H
erwig++and H
erwig/J
immymodels.
The exclusive dijet topology, where multijet events are explicitly excluded, provides an alternative view of the same observables. This results in removal of extra jets produced by the UE itself. In Figure 3, the p
leadTprofiles decrease with the increase of p
leadT. In the max
/min characterisation, the distinction between the behaviours of the min and max sides is reduced for this distribution, with either both falling (N
ch) or the trans-max remaining roughly constant while the trans-min falls o
ff(
Pp
T). The fall-o
ffbehaviour, as opposed to p
leadT-independence, implies that a major e
ffect of the exclusive dijet selection has been to exclude events where extra jets with p
T>20 GeV were produced by MPI activity, meaning that only events with low average transverse activity pass the selection. The MC models describe the exclusive dijet observables somewhat better than they did the inclusive jet ones. The P
ythia6 models are particularly improved and are better than the Herwig family for the exclusive dijet selection
Pp
Tobservables.
Finally, it is interesting to compare the trans-di
ffregions between the inclusive and exclusive jet
selections: trans-diff is intended to be most sensitive to additional hard scattering from either MPI or
ISR/hard-process, and indeed it may be seen in the right side of Figures 2 and 3 to be essentially flat
for the exclusive dijet topology, as compared to its increase with p
leadTfor the inclusive distributions.
Again, this behaviour is well-modelled by the P
ythia6 MC generator, with particularly good numerical agreement for the simulation of trans-diff in the exclusive dijet selection.
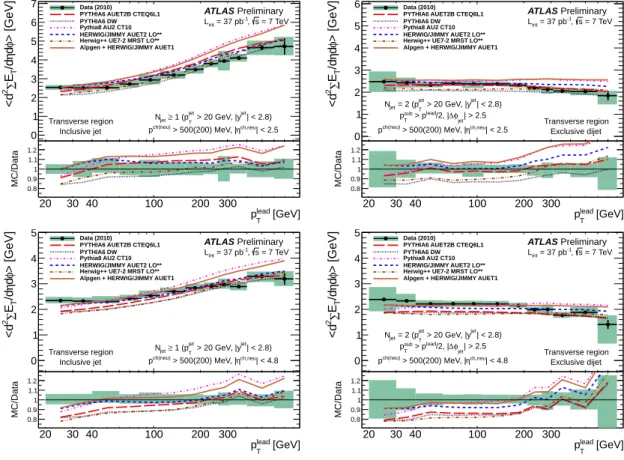
7.2 Charged and neutral particle P
E
Tvs. p
leadTIn Figure 4 the corrected charged and neutral particle
PE
Tis shown in both the full
ηacceptance range on the bottom row and in the central region in the top row, for the inclusive jet and exclusive dijet topologies. The trends are broadly similar to those for the track-based observables, and for the central
|η|
range the comparison between the data and MC models is comparable to that seen for the charged particle
Pp
Tequivalent plots. However, the full acceptance plots show increased disagreement between the MC models and the data: the MC models undershoot the observed level of activity at low p
leadTvalues in both the inclusive and exclusive event selections. This discrepancy is notable as all MPI models have to date been tuned to observables measured solely for central rapidities. The models are also seen to predict a faster rise of
PE
Tas a function of p
leadTthan seen in the data.
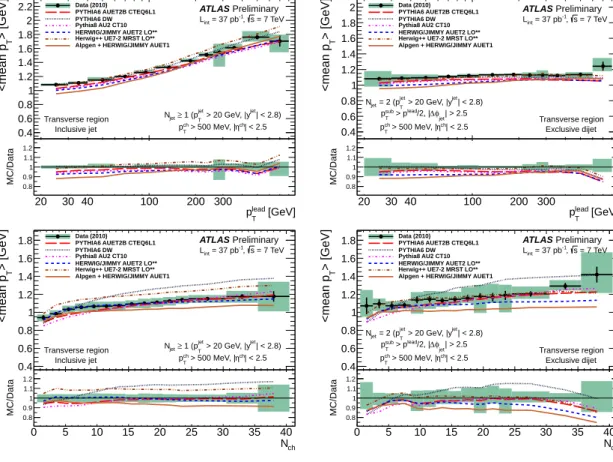
7.3 Charged particle hp
Ti vs. p
leadTand N
chIn Figure 5, the distributions of transverse charged particle mean p
Tagainst p
leadTand the charged mul- tiplicity are shown. No max/min region subdivision is made for the
hpTiobservables since while there is a clear case for identifying the more and less active sides of an event based on particle multiplicity or momentum flow, the meaning of the transverse side with the higher/lower average particle p
Tis not clearly indicative of anything meaningful about the UE.
The mean p
Tvs. p
leadTprofile displays a very di
fferent behaviour between the inclusive jet and ex- clusive dijet event selections: in the inclusive jet case
hp
Tirises strongly with increasing p
leadT, but when the event selection is restricted to dijet events only, the correlation disappears to give a distribution flat within uncertainties. The roots of this behaviour may be seen in Figures 2 and 3: in the inclusive jet case the N
chprofile (the denominator in construction of
hp
Ti) is less sharply rising than
Pp
T(the numerator) as a function of p
leadT, while for the exclusive dijet selection there is less distinction between
Pp
Tand N
ch, leading to the flat ratio. Based on previous conclusions about the nature of the contributions to the trans-max and trans-min components of the
Pp
Tand N
chvs. p
leadTprofiles, this distinction between inclusive and exclusive mean p
Tbehaviours implies that it is the high p
Ttails of UE particle production, that are e
ffectively removed by the dijet selection, which are responsible for production of particles with higher average p
T.
For both the inclusive jet and exclusive dijet selections, the transverse mean p
Tas a function of p
leadTis well-described by the MC models – within 10% of the data. This is not unexpected, as the descriptions of the related transverse charged particle
Pp
Tand multiplicity were described to similar levels of precision.
The
hpTivs. N
chplots follow the pattern established by previous experiments, of being dominated by a gentle rising linear correlation between number of charged particles and mean particle p
T. This observable is well described by the bulk of the MC models considered, in particular for the exclusive dijet event selection. The main outliers are P
ythia6 Tune DW, which overshoots the data for events with more than
∼10 charged particles, and the older AUET1 tune of H
erwig/J
immyused by the A
lpgensample, which undershoots the data. Herwig
++also overshoots the inclusive event data, but gives one of the best descriptions of dijet event
hpTivs. N
chfor exclusive dijet events.
An underestimation of
hpTivs. N
chdata is not unexpected from the J
immymodel, as it contains no colour reconnection mechanism via which to redistribute momentum in high-multiplicity events [42].
The newer AUET2 tune of H
erwig/J
immy, however, outperforms its older relative and despite the lack
of colour reconnection remains just within the lower edge of the data errors for both event selections. In
102
> [GeV]φdη/d Tp∑2<d
0 0.5 1 1.5 2 2.5 3
3.5 Data (2010)
PYTHIA6 AUET2B CTEQ6L1 PYTHIA6 DW Pythia8 AU2 CT10 HERWIG/JIMMY AUET2 LO**
Herwig++ UE7-2 MRST LO**
Alpgen + HERWIG/JIMMY AUET1
| < 2.8) > 20 GeV, |yjet T
1 (pjet jet≥ N
| < 2.5 ηch
> 500 MeV, |
T
pch
Transverse region Inclusive jet
ATLAS Preliminary = 7 TeV s
-1, = 37 pb Lint
[GeV]
T
plead
20 30 40 100 200 300
MC/Data 0.80.9
1 1.1 1.2
102
> [GeV]φdη/d Tp∑2<d
-2 -1 0 1 2 3 4 5
6 Data (2010) - trans-max PYTHIA6 AUET2B CTEQ6L1 - trans-max Data (2010) - trans-min PYTHIA6 AUET2B CTEQ6L1 - trans-min Data (2010) - trans-diff PYTHIA6 AUET2B CTEQ6L1 - trans-diff
| < 2.8) > 20 GeV, |yjet T
1 (pjet jet≥ N
| < 2.5 ηch
> 500 MeV, |
T
pch
Inclusive jet
ATLAS Preliminary = 7 TeV s
-1, = 37 pb Lint
[GeV]
T
plead
20 30 40 100 200 300
MC/Data 0.80.9
1 1.1 1.2
102
>φdη/dchN2<d
0.4 0.6 0.8 1 1.2 1.4 1.6 1.8
2 Data (2010)
PYTHIA6 AUET2B CTEQ6L1 PYTHIA6 DW Pythia8 AU2 CT10 HERWIG/JIMMY AUET2 LO**
Herwig++ UE7-2 MRST LO**
Alpgen + HERWIG/JIMMY AUET1
| < 2.8) > 20 GeV, |yjet T
1 (pjet jet≥ N
| < 2.5 ηch
> 500 MeV, |
T
pch
Transverse region Inclusive jet
ATLAS Preliminary = 7 TeV s
-1, = 37 pb Lint
[GeV]
T
plead
20 30 40 100 200 300
MC/Data 0.80.9
1 1.1 1.2
102
>φdη/dchN2<d
-0.5 0 0.5 1 1.5 2 2.5
3 Data (2010) - trans-max PYTHIA6 AUET2B CTEQ6L1 - trans-max Data (2010) - trans-min PYTHIA6 AUET2B CTEQ6L1 - trans-min Data (2010) - trans-diff PYTHIA6 AUET2B CTEQ6L1 - trans-diff
| < 2.8) > 20 GeV, |yjet T
1 (pjet jet≥ N
| < 2.5 ηch
> 500 MeV, |
T
pch
Inclusive jet
ATLAS Preliminary = 7 TeV s
-1, = 37 pb Lint
[GeV]
T
plead
20 30 40 100 200 300
MC/Data 0.80.9
1 1.1 1.2
Figure 2: Profiles of charged particle
Pp
T(top row) and charged multiplicities (bottom row) against p
leadT, for the inclusive jet event selection. The left column shows the result for the total transverse region and several MC models for comparison, with the data error bars indicating the statistical uncertainty and the shaded area showing the combined statistical and systematic uncertainty. The right column plots compare the trans-max/min/diff observables to each other and the Pythia 6 AUET2B CTEQ6L1 MC model. The error bands on the top plots show the combined systematic and statistical uncertainty, while the grey band in the ratio plots shows the maximum combined statistical and systematic uncertainty among the three regions.
fact, H
erwig/J
immyAUET2 LO
∗∗gives the best description of all models considered here for inclusive jet events with N
ch.15.
Finally, the ATLAS tunes of both P
ythia6 and P
ythia8 are seen to undershoot this data somewhat
for low N
ch, particularly in the inclusive jet sample, but describe the
hpTiof higher-multiplicity events
well for both event selections. As both these tunes incorporated the equivalent of this observable in
the ATLAS leading charged particle UE analysis [4], the flaws in their data description seen here are
unexpected, and use of this data in future tunes may substantially change the MPI model parameters.
102
> [GeV]φdη/d Tp∑2<d
0 0.5 1 1.5 2 2.5
3 Data (2010)
PYTHIA6 AUET2B CTEQ6L1 PYTHIA6 DW Pythia8 AU2 CT10 HERWIG/JIMMY AUET2 LO**
Herwig++ UE7-2 MRST LO**
Alpgen + HERWIG/JIMMY AUET1
| < 2.8) > 20 GeV, |yjet T
= 2 (pjet
Njet
| > 2.5 φjet
∆ /2, | > plead T
psub
| < 2.5 ηch
> 500 MeV, |
T
pch Transverse region
Exclusive dijet ATLAS Preliminary
= 7 TeV s
-1, = 37 pb Lint
[GeV]
T
plead
20 30 40 100 200 300
MC/Data 0.80.9
1 1.1
1.2 102
> [GeV]φdη/d Tp∑2<d
-1 0 1 2 3 4
Data (2010) - trans-max PYTHIA6 AUET2B CTEQ6L1 - trans-max Data (2010) - trans-min PYTHIA6 AUET2B CTEQ6L1 - trans-min Data (2010) - trans-diff PYTHIA6 AUET2B CTEQ6L1 - trans-diff
| < 2.8) > 20 GeV, |yjet T
= 2 (pjet
Njet
| > 2.5 φjet
∆ /2, | > plead T
psub
| < 2.5 ηch
> 500 MeV, |
T
pch
Exclusive dijet
ATLAS Preliminary = 7 TeV s
-1, = 37 pb Lint
[GeV]
T
plead
20 30 40 100 200 300
MC/Data 0.80.9
1 1.1 1.2
102
>φdη/dchN2<d
0.4 0.6 0.8 1 1.2 1.4 1.6 1.8
2 Data (2010)
PYTHIA6 AUET2B CTEQ6L1 PYTHIA6 DW Pythia8 AU2 CT10 HERWIG/JIMMY AUET2 LO**
Herwig++ UE7-2 MRST LO**
Alpgen + HERWIG/JIMMY AUET1
| < 2.8) > 20 GeV, |yjet T
= 2 (pjet
Njet
| > 2.5 φjet
∆ /2, | > plead T
psub
| < 2.5 ηch
> 500 MeV, |
T
pch Transverse region
Exclusive dijet ATLAS Preliminary
= 7 TeV s
-1, = 37 pb Lint
[GeV]
T
plead
20 30 40 100 200 300
MC/Data 0.80.9
1 1.1
1.2 102
>φdη/dchN2<d
-0.5 0 0.5 1 1.5 2 2.5
3 Data (2010) - trans-max PYTHIA6 AUET2B CTEQ6L1 - trans-max Data (2010) - trans-min PYTHIA6 AUET2B CTEQ6L1 - trans-min Data (2010) - trans-diff PYTHIA6 AUET2B CTEQ6L1 - trans-diff
| < 2.8) > 20 GeV, |yjet T
= 2 (pjet
Njet
| > 2.5 φjet
∆ /2, | > plead T
psub
| < 2.5 ηch
> 500 MeV, |
T
pch
Exclusive dijet
ATLAS Preliminary = 7 TeV s
-1, = 37 pb Lint
[GeV]
T
plead
20 30 40 100 200 300
MC/Data 0.80.9
1 1.1 1.2
Figure 3: Profiles of charged particle
Pp
T(top row) and charged multiplicities (bottom row) against
p
leadT, for the exclusive dijet event selection. The left column shows the result for the total transverse re-
gion and several MC models for comparison, with the data error bars indicating the statistical uncertainty
and the shaded area showing the combined statistical and systematic uncertainty. The right column plots
compare the trans-max/min/diff observables to each other and the P
ythia6 AUET2B CTEQ6L1 MC
model. The error bands on the top plots show the combined systematic and statistical uncertainty, while
the grey band in the ratio plots shows the maximum combined statistical and systematic uncertainty
among the three regions.
102
> [GeV]φdη/dTE∑2<d
0 1 2 3 4 5 6
7 Data (2010)
PYTHIA6 AUET2B CTEQ6L1 PYTHIA6 DW Pythia8 AU2 CT10 HERWIG/JIMMY AUET2 LO**
Herwig++ UE7-2 MRST LO**
Alpgen + HERWIG/JIMMY AUET1
| < 2.8) > 20 GeV, |yjet T
1 (pjet jet≥ N
| < 2.5
ch,neu
η > 500(200) MeV, |
ch(neu)
p Transverse region
Inclusive jet
ATLAS Preliminary = 7 TeV s
-1, = 37 pb Lint
[GeV]
T
plead
20 30 40 100 200 300
MC/Data 0.80.9
1 1.1 1.2
102
> [GeV]φdη/dTE∑2<d
0 1 2 3 4 5
6 Data (2010)
PYTHIA6 AUET2B CTEQ6L1 PYTHIA6 DW Pythia8 AU2 CT10 HERWIG/JIMMY AUET2 LO**
Herwig++ UE7-2 MRST LO**
Alpgen + HERWIG/JIMMY AUET1
| < 2.8) > 20 GeV, |yjet T
= 2 (pjet
Njet
| > 2.5 φjet
∆ /2, | > plead T
psub
| < 2.5
ch,neu
η > 500(200) MeV, |
ch(neu)
p
Transverse region Exclusive dijet ATLAS Preliminary
= 7 TeV s
-1, = 37 pb Lint
[GeV]
T
plead
20 30 40 100 200 300
MC/Data 0.80.9
1 1.1 1.2
102
> [GeV]φdη/dTE∑2<d
0 1 2 3 4
5 Data (2010)
PYTHIA6 AUET2B CTEQ6L1 PYTHIA6 DW Pythia8 AU2 CT10 HERWIG/JIMMY AUET2 LO**
Herwig++ UE7-2 MRST LO**
Alpgen + HERWIG/JIMMY AUET1
| < 2.8) > 20 GeV, |yjet T
1 (pjet jet≥ N
| < 4.8
ch,neu
η > 500(200) MeV, |
ch(neu)
p Transverse region
Inclusive jet
ATLAS Preliminary = 7 TeV s
-1, = 37 pb Lint
[GeV]
T
plead
20 30 40 100 200 300
MC/Data 0.80.9
1 1.1 1.2
102
> [GeV]φdη/dTE∑2<d
0 1 2 3 4
5 Data (2010)
PYTHIA6 AUET2B CTEQ6L1 PYTHIA6 DW Pythia8 AU2 CT10 HERWIG/JIMMY AUET2 LO**
Herwig++ UE7-2 MRST LO**
Alpgen + HERWIG/JIMMY AUET1
| < 2.8) > 20 GeV, |yjet T
= 2 (pjet
Njet
| > 2.5 φjet
∆ /2, | > plead T
psub
| < 4.8
ch,neu
η > 500(200) MeV, |
ch(neu)
p
Transverse region Exclusive dijet ATLAS Preliminary
= 7 TeV s
-1, = 37 pb Lint
[GeV]
T
plead
20 30 40 100 200 300
MC/Data 0.80.9
1 1.1 1.2