ATLAS-CONF-2013-018 07March2013
ATLAS NOTE
ATLAS-CONF-2013-018
March 6, 2013
Search for heavy top-like quarks decaying to a Higgs boson and a top quark in the lepton plus jets final state in pp collisions at √
s = 8 TeV with the ATLAS detector
The ATLAS Collaboration
Abstract
A search is presented for production of a heavy up-type quark (t
0) together with its antiparticle, assuming a significant branching ratio for subsequent
t0decay into a Standard Model Higgs boson and a top quark, as predicted by vector-like quark models. The search is based on 14.3 fb
−1of
ppcollisions at
√s =
8 TeV recorded in 2012 with the ATLAS detector at the CERN Large Hadron Collider. Data are analysed in the lepton+jets final state, characterised by an isolated electron or muon with moderately high transverse momentum, significant missing transverse momentum, and at least six jets. The search exploits the high total transverse momenta of all final state objects and the high multiplicity of
bjets characteristic of signal events with at least one Higgs boson decaying into
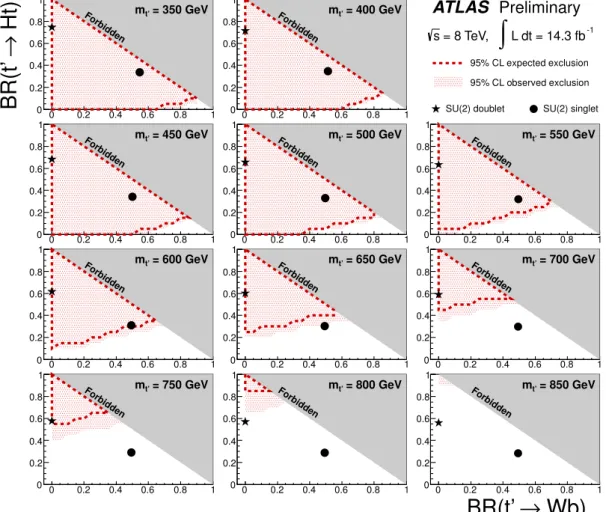
bb, to discriminate¯ against the dominant background from top quark pair production. No significant excess of events above the Standard Model expectation is observed, and upper limits are derived for vector-like quarks of various masses in the two-dimensional plane of
BR(t0 → Wb) versus BR(t0 → Ht), where His the Standard Model Higgs boson, assumed to have a mass of 125 GeV. Under the branching ratio assumptions corresponding to a weak-isospin doublet (singlet) scenario, a
t0quark with mass lower than 790 (640) GeV is excluded at the 95%
confidence level.
c
Copyright 2013 CERN for the benefit of the ATLAS Collaboration.
Reproduction of this article or parts of it is allowed as specified in the CC-BY-3.0 license.
1 Introduction
Since the discovery of the top quark [1,2], which completed the third generation of fundamental fermions in the quark sector of the Standard Model (SM) of particle physics, searches for heavier quarks have been of particular interest in high-energy physics research. These quarks are predicted by many new physics models aimed at solving some of the limitations of the SM.
A compelling possibility is the addition of weak-isospin singlets, doublets or triplets of vector-like quarks [3], defined as quarks for which both chiralities have the same transformation properties under the electroweak group S U(2)
×U(1). Vector-like quarks appear in many extensions of the SM such as little Higgs [4–6] or extra-dimensional models [7, 8]. In these models, a top-partner quark, for simplicity referred to here as t
0, often plays a key role in cancelling the quadratic divergences in the Higgs boson mass induced by radiative corrections involving the top quark.
The large centre-of-mass energy (
√s) and integrated luminosity in proton-proton (pp) collisions produced at the CERN Large Hadron Collider (LHC) offer a unique opportunity to probe these models.
At the LHC, vector-like quarks would be produced predominantly in pairs via the strong interaction for masses below O(1 TeV) [3], with sizable cross sections and clean experimental signatures. For higher masses, single production mediated by the electroweak interaction can potentially dominate, depending on the strength of the interaction between the new quarks and the weak gauge bosons.
Vector-like quarks can couple preferentially with third-generation quarks, as the mixing is propor- tional to the mass of the SM quark [9], and thus present a rich phenomenology. In particular, a vector-like t
0quark has a priori three possible decay modes, t
0→Wb, t
0→Zt, and t
0 →Ht, with branching ratios that vary as a function of m
t0and depend on the weak-isospin quantum number of the t
0quark. While all three decay modes can be sizable for a weak-isospin singlet, decays to only Zt and Ht are most natural for a doublet [3]. In the case of a triplet, the t
0quark can decay either as a singlet or a doublet depend- ing on its hypercharge. The recent observation of a Higgs-like boson with a mass of
∼125 GeV by theATLAS [10] and CMS [11] Collaborations raises the level of interest for vector-like quark searches, as t
0 →Ht and b
0→Hb decays have completely specified final states for a SM-like Higgs boson.
Most searches for t
0t ¯
0production by the ATLAS and CMS Collaborations so far have focused on the t
0 →Wb decay mode, exploiting both the lepton+jets signature [12, 13], where one of the W bosons decays leptonically and the other decays hadronically, and the dilepton signature [14, 15], where both W bosons decay leptonically. These searches make the assumption that BR(t
0 →Wb)
=1, which is reasonable for a chiral fourth generation t
0quark. Under this assumption, the most restrictive lower limit obtained on the mass of a t
0quark is m
t0 >656 GeV at 95% confidence level (CL) [16]. A recent search by the CMS Collaboration using the lepton
+jets signature [17] has focused instead on the t
0→Zt decay mode assuming that BR(t
0 →Zt)
=1. Unfortunately, the limits derived by these searches can not easily be applied to other branching ratio values, due to the potentially large signal contamination from mixed decay modes. A consistent treatment of those additional signal contributions is thus necessary to set quasi-model independent limits on the plane of BR(t
0→Ht) vs BR(t
0 →Wb) as a function of m
t0. Such an analysis was done recently by the ATLAS Collaboration [16], using a search for t
0t ¯
0→W
+bW
−b ¯ to set constraints in that branching ratio plane: e.g. a t
0quark with a mass of 550 GeV and BR(t
0 →Wb)
>0.63 is excluded at 95% CL, regardless of the value of its branching ratios to Ht and Zt.
The search presented in this note is focused on the lepton+jets signature and requires events with high multiplicities of jets (≥ 6) and b-tagged jets (≥ 2), making it particularly sensitive to decay modes such as t
0t ¯
0 →HtH¯ t, ZtHt and WbHt
1, with H
→b b, and thus to the low ¯ BR(t
0 →Wb) region. This search assumes a SM Higgs boson with mass of 125 GeV. A simple kinematic variable, chosen to be rather insensitive to the signal decay mode in order to ensure good sensitivity over most of the branching ratio plane, is used to discriminate between signal and background, which is dominated by t¯ t
+jets. This
1Complex-conjugate decay modes are implicit:ZtHtincludesZtHt¯andHtZt, and¯ WbHtincludesW+bH¯tandHtW−b.¯
represents the first ATLAS search for a t
0quark decaying into a Higgs boson.
This note is organised as follows. After a brief overview of the ATLAS detector in Sect. 2, the main reconstructed physics objects used in this search, as well as the dataset and event preselection requirements made are discussed in Sects. 3 and 4, respectively. Section 5 summarises the simulated samples used for signal and backgrounds, while Sect. 6 is devoted to the background predictions based on data-driven techniques. The final event selection and discriminating variable are presented in Sect. 7.
A detailed discussion of the systematic uncertainties considered in this search is given in Sect. 8. The statistical analysis and results obtained are presented in Sects. 9 and 10, respectively. Finally, a summary is given in Sect. 11.
2 ATLAS Detector
The ATLAS detector [18] consists of four main subsystems: an inner tracking system surrounded by a superconducting solenoid, electromagnetic and hadronic calorimeters, and a muon spectrometer. The inner detector provides tracking information from pixel and silicon microstrip detectors in the pseudora- pidity
2range
|η| <2.5 and from a transition radiation tracker covering
|η| <2.0, all immersed in a 2 T magnetic field provided by a superconducting solenoid. The electromagnetic (EM) sampling calorimeter uses lead and liquid-argon (LAr) and is divided into a barrel region (|η|
<1.475) and an end-cap region (1.375
<|η|<3.2). Hadron calorimetry is based on two di
fferent detector technologies, with scintillator tiles or LAr as active media, and with either steel, copper, or tungsten as the absorber material. The calorimeters cover
|η| <4.9. The muon spectrometer measures the deflection of muon tracks within
|η|<
2.7 using multiple layers of high-precision tracking chambers located in a toroidal field of approxi- mately 0.5 T and 1 T in the central and end-cap regions of ATLAS, respectively. The muon spectrometer is also instrumented with separate trigger chambers covering
|η|<2.4.
3 Object Reconstruction
The main physics objects considered in this search are electrons, muons, jets, b jets and missing trans- verse momentum. A brief summary of the main reconstruction and identification criteria applied for each of these physics objects is given below.
Electron candidates [19] are reconstructed from energy deposits (clusters) in the EM calorimeter that are associated to reconstructed tracks in the inner detector. They are required to have a transverse energy, E
T, greater than 25 GeV and
|ηcluster| <2.47 (where
|ηcluster|is the pseudorapidity of the calorimeter cluster associated with the electron candidate). Candidates in the calorimetry transition region 1.37
<|ηcluster| <
1.52 are excluded. To reduce the background from non-prompt electrons, i.e. from decays of hadrons (including heavy flavour) produced in jets, electron candidates are also required to be isolated.
An
η-dependent 90% efficient isolation cut, based on the energy sum of cells around the direction of eachcandidate, is made for a cone of radius
∆R
= p(
∆φ)2+(
∆η)2 =0.2. This energy sum excludes cells associated with the electron cluster and is corrected for leakage from the electron cluster itself. A further 90% efficient isolation cut is made on the track transverse momentum (p
T) sum around the electron in a cone of radius
∆R
=0.3. The longitudinal impact parameter of the electron track with respect to the selected event primary vertex (see Sect. 4), z
0, is required to be less than 2 mm.
2ATLAS uses a right-handed coordinate system with its origin at the nominal interaction point (IP) in the centre of the detector and thez-axis coinciding with the axis of the beam pipe. Thex-axis points from the IP to the centre of the LHC ring, and they-axis points upward. Cylindrical coordinates (r,φ) are used in the transverse plane,φbeing the azimuthal angle around the beam pipe. The pseudorapidity is defined in terms of the polar angleθasη=−ln tan(θ/2). For the purpose of the fiducial selection, this is calculated relative to the geometric centre of the detector; otherwise, it is relative to the reconstructed primary vertex of each event.
Muon candidates are reconstructed from track segments in the various layers of the muon spec- trometer, and matched with tracks found in the inner detector. The final candidates are refitted using the complete track information from both detector systems, and required to satisfy p
T >25 GeV and
|η| <
2.5. Additionally, muons are required to be separated by
∆R
>0.4 from any selected jet (see below). Muons are required to satisfy a p
T-dependent track-based isolation requirement that has good performance even under high pileup conditions or in boosted configurations where the muon is close to a jet: the scalar sum of the track p
Tin a cone of variable radius
∆R
<10 GeV/ p
µTaround the muon (excluding the muon track itself) must be less than 5% of the muon p
T. Muons are required to have a hit pattern in the inner detector consistent with a well-reconstructed track. Analogously to the electrons, the muon track longitudinal impact parameter with respect to the primary vertex, z
0, is required to be less than 2 mm.
Jets are reconstructed with the anti-k
talgorithm [20–22] with a radius parameter R
=0.4 from calibrated topological clusters [18] built from energy deposits in the calorimeters. Prior to jet finding, a local cluster calibration scheme [23, 24] is applied to correct the topological cluster energies for the e
ffects of non-compensation, dead material and out-of-cluster leakage. The corrections are obtained from simulations of charged and neutral particles. After energy calibration [25] jets are required to have
p
T>25 GeV and
|η|<2.5.
To avoid selecting jets from secondary pp interactions, a selection on the so-called “jet vertex frac- tion” (JVF) variable above 0.5 is applied, representing a requirement that at least 50% of the sum of the p
Tof tracks with p
T >1 GeV associated with a jet comes from tracks compatible with originating from the primary vertex. During jet reconstruction, no distinction is made between identified electrons and jet energy deposits. Therefore, if any of the jets lie within
∆R of 0.2 of a selected electron, the single closest jet is discarded in order to avoid double-counting of electrons as jets. After this, electrons which are within
∆R of 0.4 of a remaining jet are removed.
Jets are identified as originating from the hadronisation of a b quark (b tagging) via an algorithm [26]
using multivariate techniques to combine information from the impact parameters of displaced tracks as well as topological properties of secondary and tertiary decay vertices reconstructed within the jet.
The working point used for this search corresponds to 70% efficiency to tag a b-quark jet, with a light- jet rejection factor of
∼130 and a charm jet rejection factor of 5, as determined forb-tagged jets with
p
T>20 GeV and
|η|<2.5 in simulated t¯ t events.
The missing transverse momentum (E
missT) is used to estimate the transverse momentum of an as- sumed neutrino originating from the decay of one of the W bosons in the t
0t ¯
0final state. E
missTis itself reconstructed by first matching each calorimeter energy cluster with either a reconstructed lepton or jet.
Failing this, the cluster is left unassociated. The remaining unassociated clusters are then calibrated for energy losses in un-instrumented regions and for different responses of the calorimeters to electromag- netic and hadronic shower components. This calibration scheme is similar to that described in Ref. [27].
E
missTis calculated from a vector sum of the calibrated cluster momenta, together with a term associated with muon momenta.
4 Event Preselection
This search is based on 14.3 fb
−1of data collected by the ATLAS experiment between April and October 2012 in pp collisions at
√s
=8 TeV. Only events collected using a single electron or muon trigger under
stable beam conditions and for which all detector subsystems were operational are considered. Triggers
with different p
Tthresholds are combined in a logical OR in order to improve the overall efficiency. The
p
Tthresholds are 24 or 60 GeV for electrons and 24 or 36 GeV for muons. The triggers with the lower
p
Tthreshold include isolation requirements on the candidate lepton, resulting in ine
fficiencies at high p
Tthat are recovered by the triggers with higher p
Tthreshold. The triggers use similar but looser selection
criteria than the final reconstruction requirements.
Events accepted by the trigger are required to have at least one reconstructed vertex with at least five associated tracks, consistent with the beam collision region in the x
−yplane. If more than one vertex is found, the primary vertex is taken to be the one which has the largest sum of the squared transverse momenta of its associated tracks. Events are discarded if any jet with p
T >20 GeV is independently identified as out-of-time activity from a previous pp collision or as calorimeter noise [28].
Events are required to have exactly one reconstructed electron or muon and at least four jets satis- fying the quality and kinematic criteria discussed in Sect. 3. For both electron and muon channels, the selected lepton is required to match (∆ R
<0.15) the lepton reconstructed by the high-level trigger. The background from multijet production is suppressed by a requirement on E
missTas well as on the trans- verse mass of the lepton and E
missT(m
T)
3. For both electron and muon channels the requirements are E
missT >20 GeV and E
missT +m
T>60 GeV.
5 Background and Signal Modelling
After event preselection the main background is t¯ t
+jets production, with the production of a W boson in association with jets (W
+jets) and multijet events contributing to a lesser extent. Small contributionsarise from single top quark, Z
+jets and diboson (WW, WZ, ZZ) production, as well as from the associ- ated production of a vector boson and a t¯ t pair. Multijet events contribute to the selected sample via the misidentification of a jet or a photon as an electron or the presence of a non-prompt lepton, e.g. from a semileptonic b- or c-hadron decay, and the corresponding yield is estimated via data-driven meth- ods [29]. For the W
+jets background, the shape is obtained from the simulation but the normalisation is determined from the data, using the predicted asymmetry between W
++jets andW
−+jets productionin pp collisions [30], and separating the events into categories based on the multiplicity of b and c jets.
Details on the estimation of the multijet and W
+jets backgrounds are given in Sect. 6. The rest of the backgrounds, as well as the signal, are estimated from the simulation and normalised to their theoretical cross sections. In the case of the t¯ t
+jets background prediction, further corrections to match the data are applied, as discussed in Sect. 7.
Samples of t¯ t
+jets andW/Z
+jets events are generated using the Alpgen v2.13 [31] leading-order (LO)generator and the CTEQ6L1 PDF set [32]. Parton shower and fragmentation are modelled with H
erwigv6.520 [33]. To avoid double-counting of partonic configurations generated by both the matrix-element calculation and the parton-shower evolution, a parton-jet matching scheme (“MLM matching”) [34] is employed. The t¯ t
+jets samples are generated separately fort¯ t
+light jets with up to three additional lightpartons (u, d, s quarks or gluons), and for t¯ t
+heavy-flavour jets, including t¯ tb b ¯ and t¯ tc¯ c. The overlap between t¯ tQ Q ¯ (Q
=b, c) events generated from the matrix element calculation and those generated from parton-shower evolution in the t¯ t
+light jet samples is avoided via an algorithm based on the angularseparation between the extra heavy quarks: if
∆R(Q, Q) ¯
>0.4, the matrix-element prediction is used, otherwise the parton-shower prediction is used. These t¯ t
+jets samples are generated assuming a topquark mass of 172.5 GeV and are normalised to the approximate next-to-next-to-LO (NNLO) theoretical cross section calculated with the HATHOR tool [35] using the MSTW2008 NNLO PDF set [36], yielding 238
+22−24pb. The W
+jets samples are generated with up to five additional partons, separately forW
+lightjets, Wb b ¯
+jets,Wc¯ c
+jets, andWc
+jets, and their fractions are normalised to measurements inW
+1 jetand W
+2 jets data control samples [37]. A similar heavy-quark overlap removal prescription as used for t¯ t
+jets is applied. TheZ
+jets background is normalised to the inclusive NNLO theoretical crosssection [38].
3mT = q
2p`TETmiss(1−cos∆φ), where p`T is the transverse momentum (energy) of the muon (electron) and∆φis the azimuthal angle separation between the lepton and the direction of the missing transverse momentum.
Samples of single top quark backgrounds corresponding to the s-channel and Wt production mecha- nisms are generated with MC@NLO v4.01 [39–41] using the CT10 PDF set [42]. In the case of t-channel single top quark production, the AcerMC v3.8 LO generator [43] with the MRST LO** PDF set is used.
Samples of t¯ tV (V
=W
,Z) are generated with the M
adgraph v5 LO generator [44] and the CTEQ6L1 PDF set. Samples of t¯ tH are generated with the P
ythia6.425 [45] LO generator and the MRST LO**
PDF set [46], assuming a Higgs boson mass of 125 GeV and considering the H
→b b, ¯ c¯ c,
gg, andW
+W
−decay modes. Parton shower and fragmentation are modelled with H
erwigv6.520 [33] in the case of MC@NLO, with P
ythia6.421 in the case of A
cerMC, and with P
ythia6.425 in the case of M
adgraph. These samples are generated assuming a top quark mass of 172.5 GeV. The single top quark samples are normalised to the approximate NNLO theoretical cross sections [47, 48] using the MSTW2008 NNLO PDF set, while the t¯ tV samples are normalised to the NLO cross section predictions [49, 50]. The t¯ tH sample is normalised using the NLO theoretical cross section and branching ratio predictions [51]. Fi- nally, the diboson backgrounds are modelled using H
erwigwith the MRST LO** PDF set, and are normalised to their NLO theoretical cross sections [52].
[GeV]
mt’
300 400 500 600 700 800 900 1000
Branching Ratio
0 0.1 0.2 0.3 0.4 0.5 0.6 0.7 0.8 0.9 1
Singlet Doublet
Wb t’ →
Zt
t’ → t’ → Zt
Ht
t’ → t’ → Ht
300 400 500 600 700 800 900 1000
) [pb]t’ t’→( pp σ
10-3
10-2
10-1
1 10 102
103
= 8 TeV s
= 7 TeV s
[GeV]
mt’
300 400 500 600 700 800 900 1000
(7 Tev)σ(8 Tev)σ
1.5 2 2.5 3
(a) (b)
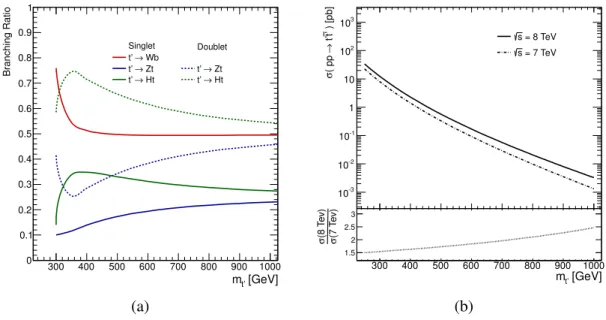
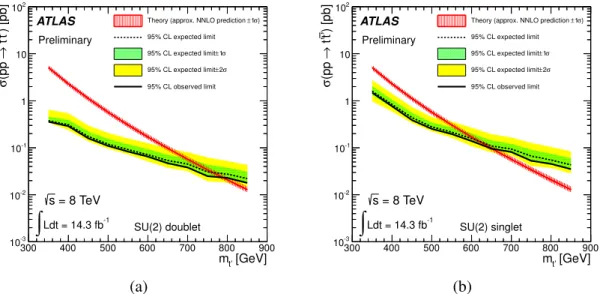
Figure 1:
(a) Branching ratios fort0 decay as a function ofmt0 as computed with Protos in the weak-isospin singlet and doublet scenarios. (b) Theoretical cross sections at NNLO fort0t¯0production in ppcollisions at two center-of-mass energies, √s=7 TeV and √
s=8 TeV, as a function ofmt0as computed by Hathor. Also shown is the ratio of production cross sections between both center-of-mass energies.
For vector-like t
0signals, samples corresponding to a singlet t
0quark decaying to Wb, Zt and Ht are generated with the Protos v2.2 LO generator [3, 53] using the CTEQ6L1 PDF set, and interfaced to P
ythiafor the parton shower and fragmentation. The predicted branching ratios in the weak-isospin singlet and doublet scenarios as a function of m
t0are shown in Fig. 1a. The m
t0values considered range from 350 GeV to 850 GeV in steps of 50 GeV, and the Higgs boson mass is assumed to be 125 GeV.
All Higgs boson decay modes are considered, with branching ratios as predicted by
hdecay[54]. Signal samples are normalized to the approximate NNLO theoretical cross sections [35] using the MSTW2008 NNLO PDF set. The theoretical cross sections as a function of m
t0are shown in Fig. 1b.
All event generators using H
erwigare also interfaced to J
immyv4.31 [55] to simulate the underlying event. All simulated samples utilise P
hotos2.15 [56] to simulate photon radiation and T
auola1.20 [57]
to simulate
τdecays. Finally, all simulated samples include multiple pp interactions and are processed
through a simulation [58] of the detector geometry and response using G
eant4 [59], with the exception of
the signal samples, for which a fast simulation of the calorimeter response is used. All simulated samples are processed through the same reconstruction software as the data. Simulated events are corrected so that the object identification efficiencies, energy scales and energy resolutions match those determined in data control samples.
6 Data-Driven Background Estimates
6.1 Multijet Background
Multijet events can enter the selected data sample through several production and mis-reconstruction mechanisms. In the electron channel, the multijet background consists of both non-prompt electrons and “fake” electrons, where the latter include both electrons from photon conversions and mis-identified jets with a high fraction of their energy deposited in the EM calorimeter. In the muon channel, the background contributed by multijet events is predominantly due to final states with non-prompt muons, such as those from semileptonic b- or c-hadron decays.
The multijet background normalisation and shape are estimated directly from data by using the “Ma- trix Method” (MM) technique [29]. The MM exploits di
fferences in lepton identification-related proper- ties between prompt, isolated leptons from W and Z boson decays (referred to as “real leptons” below) and those where the leptons are either non-isolated or result from the mis-identification of photons or jets.
For this purpose, two samples are defined after imposing the final kinematic selection criteria, di
ffering only in the lepton identification criteria: a “tight” sample and a “loose” sample, the former being a subset of the latter. The tight selection employs the final lepton identification criteria used in the analysis. For the loose selection the lepton isolation requirements are omitted. The method assumes that the number of selected events in each sample (N
looseand N
tight) can be expressed as a linear combination of the numbers of events with real and fake leptons, in such a way that the following system of equations can be defined:
N
loose =N
realloose+N
fakeloose,N
tight = realN
realloose+fakeN
fakeloose,(1) where
real(
fake) represents the probability for a real (fake) lepton that satisfies the loose criteria to also satisfy the tight ones, and both are measured in data control samples. To measure
realsamples enriched in real leptons from W bosons decays are selected by requiring high E
Tmissor m
T. The average
realis
∼0.75 (∼0.98) in the electron (muon) channel. To measurefake
samples enriched in multijet background are selected by requiring either low E
Tmiss(electron channel) or high impact parameter significance for the lepton track (muon channel). The average
fakevalue is
∼0.35 (∼0.20) in the electron (muon) channel.Dependences of
realand
fakeon quantities such as lepton p
Tand
η, ∆R between the lepton and the closest jet, or number of b-tagged jets, are parameterized in order to obtain a more accurate estimate.
6.2 W+ jets Background
The estimate of the W
+jets background is based on data for its overall normalisation and on the simula-tion for its shape. In proton-proton collisions W
+jets production is charge asymmetric. The total number of W
+jets events in data, N
W =N
W++N
W−, can be estimated based on the measured di
fference between the number of positively- and negatively-charged W bosons, (N
W+ −N
W−)
meas, and the ratio of W
+- to W
−-boson production, r
MC, determined from the simulation:
N
W =r
MC+1 r
MC−1
!
(N
W+−N
W−)
meas.(2)
It has been shown that the simulation overestimates the number of W
+jets events compared to thedata-driven determination by up to
∼20%, depending on the jet multiplicity. Corresponding scale factorsto correct the prediction from the simulation have been derived [60] for W
+≥4 jets events and are used in this analysis to calibrate the W
+jets background to data beforeb tagging. The W
+jets predictionis scaled by a factor of 0.83
±0.10 (0.94
±0.10) in the electron (muon) channel. The fractions of Wb b ¯
+jets,Wc¯ c
+jets andWc
+jets are determined from data [60]. As a result, the fractions ofWb b ¯
+jetsand Wc c ¯
+jets events in the simulation are scaled by a factor of 1.41±0.35 (1.24
±0.34) in the electron (muon) channel. The fraction of Wc
+jets events in the simulation is scaled by a factor of 0.73
±0.37 (0.98
±0.34) in the electron (muon) channel. The fraction of W
+light jets events is scaled accordingly inorder to preserve the overall normalisation of the W
+jets background beforeb tagging, which is obtained from data using Eq. (2).
7 Final Event Selection
This search is focused on t
0t ¯
0production where at least one of the t
0quarks decays into a top quark and a Higgs boson. The resulting possible final states are t
0t ¯
0 →HtH t, ¯ ZtHt and WbHt. For the dominant H
→b b ¯ decay mode, the resulting final state is characterized by high jet and b-tag multiplicities, which provide a powerful experimental handle to suppress the backgrounds. Similarly, this search is also sensitive to t
0t ¯
0 →ZtZ¯ t and WbZt, with Z
→b b. Therefore, after preselection, the final selection requirements are ¯
≥
6 jets of which
≥2 jets are b tagged, leaving a sample completely dominated by t¯ t
+jets background.In order to optimize the sensitivity of the search, the selected events are split in three di
fferent chan- nels depending on the number of b-tagged jets: 2, 3 and
≥4. The channel with
≥4 b-tagged jets has the largest signal-to-background ratio and therefore drives the sensitivity of the search. The channels with 2 and 3 b-tagged jets are depleted in signal but they are particularly useful to calibrate the t¯ t
+jets background prediction and constrain the related systematic uncertainties, which in the
≥4 b-tags channel are dominated by b tagging, jet energy calibration and physics modelling, including the t¯ t
+heavy-flavourcontent. A detailed discussion of the systematic uncertainties considered is given in Sect. 8. In the case of the channel with exactly 2 b-tagged jets, an additional requirement of H
T <700 GeV is made, with H
Tdefined as the scalar sum of the p
Tof the charged lepton, E
missTand the p
Tof the jets . This ensures the orthogonality of this search with another search for vector-like quarks dominantly decaying into Wb with which it will be combined.
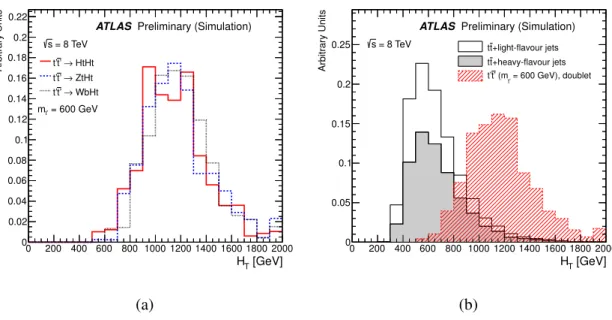
To further improve the separation between signal and background, the distinct kinematic features of the signal are exploited. In particular, the large t
0quark mass results in energetic leptons and jets in the final state and H
Tprovides a suitable discriminating variable between signal and background which is rather independent of the signal decay mode (see Fig. 2a). The H
Tdistribution typically peaks at 2m
t0for signal events and at lower values for t¯ t background, as illustrated in Fig. 2b.
7.1 Control Regions
Dedicated samples (“control regions”) are used to improve or validate the background modelling. These samples are selected by making requirements that suppress potentially large signal contributions, includ- ing those from t
0decay modes different than the ones targeted by this analysis.
By making a requirement of H
T <700 GeV in the 2, 3 and
≥4 b-tag channels, signal-depleted
samples are obtained which are dominated by the t¯ t
+jets background. In addition, the heavy-flavour
content of the t¯ t
+jets sample varies strongly as a function of theb-tagged jet multiplicity. This fact
is exploited to simultaneously fit to data scaling factors for the t¯ t
+light jets and t¯ t
+heavy-flavour jets
components of the background prediction.
[GeV]
HT 0 200 400 600 800 1000 1200 1400 1600 1800 2000
Arbitrary Units
0 0.02 0.04 0.06 0.08 0.1 0.12 0.14 0.16 0.18 0.2 0.22
HtHt t’→ t’
ZtHt t’→ t’
WbHt t’→ t’
= 8 TeV s
= 600 GeV mt’
ATLAS
Preliminary (Simulation)
[GeV]
HT 0 200 400 600 800 1000 1200 1400 1600 1800 2000
Arbitrary Units
0 0.05 0.1 0.15
0.2
0.25 tt+light-flavour jets
+heavy-flavour jets t
t
= 600 GeV), doublet (mt’
t’
t’
= 8 TeV s
ATLAS
Preliminary (Simulation)
(a) (b)
Figure 2:
Comparison of the shape of theHTdistribution in simulation for (a) differentt0t¯0decay modes, assuming mt0 =600 GeV, and (b) betweentt¯+jets background (withtt¯+light jets andtt¯+heavy-flavour jets shown stacked) andt0t¯0signal (mt0 =600 GeV) in thet0doublet scenario. The selection used corresponds to the combinede+jets andµ+jets channels with≥6 jets and≥4btags. The last bin in all figures contains the overflow.The H
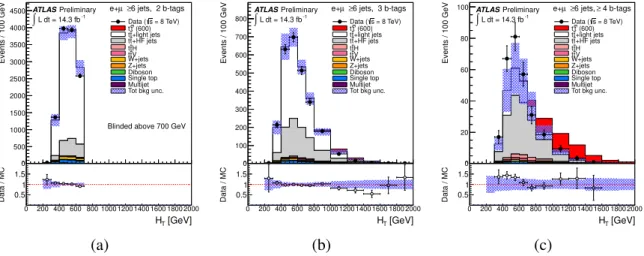
Tdistributions in the 2, 3 and
≥4 b-tag channels corresponding to the nominal A
lpgenpredic- tion are shown in Fig. 3. Although reasonable agreement is found within the large assigned systematic uncertainties, in the
≥4 b-tag channel the prediction appears systematically below the data. In order to improve the t¯ t
+jets background prediction, a simultaneous fit to the three H
Tdistributions in data is performed where two scaling factors, one for t¯ t
+light jets and another fort¯ t
+heavy-flavour jets, aredetermined. The measured scaling factors are 0.87
±0.02 (stat.) and 1.35
±0.11 (stat.) for t¯ t
+light jetsand t¯ t
+heavy-flavour jets, respectively.
An additional control region is defined by selecting events with at most two jets with p
T >60 GeV and H
T <1.2 TeV, a requirement that effectively suppresses signal, allowing the scrutiny of the H
Tdis- tribution into the signal region. This control region is only studied in the 2 b-tags and 3 b-tags channels, as the large signal content and low statistics of the
≥4 b-tags channel preclude a useful cross-check. Data are found to be in reasonable agreement with the prediction within the assigned systematic uncertainties.
7.2 Signal Region
After validation of the background modelling within the assigned systematics uncertainties, the signal is searched for by analyzing the H
Tspectra in the 2, 3 and
≥4 b-tag channels after final selection (“signal region”). The fit to the two scaling factors for t¯ t
+light jets andt¯ t
+heavy-flavour jets is redone,this time considering the full H
Tspectrum. The measured scaling factors are 0.88
±0.02 (stat.) and 1.21
±0.08 (stat.) for t¯ t
+light jets and t¯ t
+heavy-flavour jets, respectively.
Figure 4 displays the H
Tdistribution in each of the search channels considered, showing the large
signal-to-background ratio and good discrimination expected in the sample with
≥4 b-tagged jets. This
figure displays exactly the same data as in Fig. 3, except that the blinding cut of H
T <700 GeV has
been removed in the 3 and
≥4 b-tag channels. The data is found to be consistent with the background
prediction and no indications of a signal-like excess is observed. Table 1 summarizes the corresponding
event yields in each of the analyzed channels.
Events / 100 GeV
0 1000 2000 3000 4000 5000
6000 e+µ ≥6 jets, 2 b-tags = 8 TeV) s Data (
(600) t’
t’
+light jets t t
+HF jets t t H t t V t tW+jets Z+jets Diboson Single top Multijet Tot bkg unc.
L dt = 14.3 fb-1
∫ Preliminary ATLAS
Blinded above 700 GeV
[GeV]
HT 0 200 400 600 800 1000 1200 1400 1600 1800 2000
Data / MC
0.5 1 1.5 0
Events / 100 GeV
0 200 400 600 800 1000
6 jets, 3 b-tags ≥
e+µ
= 8 TeV) s Data (
(600) t’
t’
+light jets t t
+HF jets t t H t t V t tW+jets Z+jets Diboson Single top Multijet Tot bkg unc.
L dt = 14.3 fb-1
∫ Preliminary ATLAS
Blinded above 700 GeV
[GeV]
HT 0 200 400 600 800 1000 1200 1400 1600 1800 2000
Data / MC
0.5 1 1.5 0
Events / 100 GeV
0 20 40 60 80
100 e+µ ≥6 jets, ≥ 4 b-tags = 8 TeV) s Data (
(600) t’
t’
+light jets t t
+HF jets t t H t t V t tW+jets Z+jets Diboson Single top Multijet Tot bkg unc.
L dt = 14.3 fb-1
∫ Preliminary ATLAS
Blinded above 700 GeV
[GeV]
HT 0 200 400 600 800 1000 1200 1400 1600 1800 2000
Data / MC
0.5 1 1.5 0
(a) (b) (c)
Figure 3:
Comparison ofHTbetween data and simulation in the combinede+jets andµ+jets channels with≥6 jets and (a) 2btags, (b) 3btags, and (c)≥4btags. A requirement ofHT<700 GeV is made in order to suppress a possible signal contribution. Thett¯+jets background is the nominal Alpgenprediction before the fit to data (see text for details). Also shown is the expectedt0t¯0signal corresponding tomt0 =600 GeV in thet0doublet scenario.The bottom panel displays the ratio between data and the background prediction. The shaded area represents the total background uncertainty.
Events / 100 GeV
0 500 1000 1500 2000 2500 3000 3500 4000
4500 e+µ ≥6 jets, 2 b-tags = 8 TeV) s Data (
(600) t’
t’
+light jets t t
+HF jets t t H t t V t tW+jets Z+jets Diboson Single top Multijet Tot bkg unc.
L dt = 14.3 fb-1
∫ Preliminary ATLAS
Blinded above 700 GeV
[GeV]
HT 0 200 400 600 800 1000 1200 1400 1600 1800 2000
Data / MC
0.5 1 1.5 0
Events / 100 GeV
0 100 200 300 400 500 600 700 800
6 jets, 3 b-tags ≥
e+µ
= 8 TeV) s Data (
(600) t’
t’
+light jets t t
+HF jets t t H t t V t tW+jets Z+jets Diboson Single top Multijet Tot bkg unc.
L dt = 14.3 fb-1
∫ Preliminary ATLAS
[GeV]
HT 0 200 400 600 800 1000 1200 1400 1600 1800 2000
Data / MC
0.5 1 1.5 0
Events / 100 GeV
0 20 40 60 80
100 e+µ ≥6 jets, ≥ 4 b-tags = 8 TeV) s Data (
(600) t’
t’
+light jets t t
+HF jets t t H t t V t tW+jets Z+jets Diboson Single top Multijet Tot bkg unc.
L dt = 14.3 fb-1
∫ Preliminary ATLAS
[GeV]
HT 0 200 400 600 800 1000 1200 1400 1600 1800 2000
Data / MC
0.5 1 1.5 0
(a) (b) (c)
Figure 4:
Comparison between data and simulation forHTin the combinede+jets andµ+jets channels with≥6 jets and (a) 2btags, (b) 3btags, and (c)≥4btags. Thet¯tbackground prediction is after fitting to data using the fullHT spectrum (see text for details). Also shown is the expectedt0t¯0signal corresponding tomt0 =600 GeV in thet0doublet scenario. The last bin in all figures contains the overflow. The bottom panel displays the ratio between data and background prediction. The shaded area represents the total post-fit background uncertainty.8 Systematic Uncertainties
Several sources of systematic uncertainties are considered that can a
ffect the normalisation of signal and
background and
/or the shape of their corresponding final discriminant distributions. Individual sources
of systematic uncertainty are considered uncorrelated. Correlations of a given systematic uncertainty are
maintained across processes and channels. Table 2 presents a summary of the systematic uncertainties
considered in the analysis indicating whether they are taken to be normalisation-only, or to a
ffect both
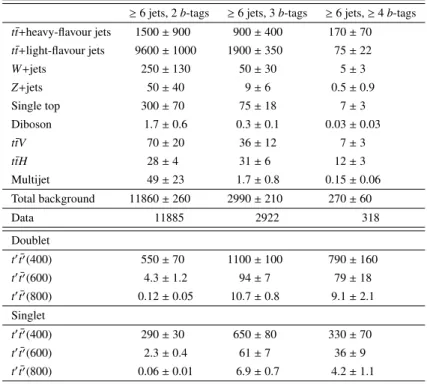
≥6 jets, 2b-tags ≥6 jets, 3b-tags ≥6 jets,≥4b-tags tt¯+heavy-flavour jets 1500±900 900±400 170±70 tt¯+light-flavour jets 9600±1000 1900±350 75±22 W+jets 250±130 50±30 5±3
Z+jets 50±40 9±6 0.5±0.9
Single top 300±70 75±18 7±3
Diboson 1.7±0.6 0.3±0.1 0.03±0.03
ttV¯ 70±20 36±12 7±3
ttH¯ 28±4 31±6 12±3
Multijet 49±23 1.7±0.8 0.15±0.06
Total background 11860±260 2990±210 270±60
Data 11885 2922 318
Doublet
t0t¯0(400) 550±70 1100±100 790±160
t0t¯0(600) 4.3±1.2 94±7 79±18
t0t¯0(800) 0.12±0.05 10.7±0.8 9.1±2.1 Singlet
t0t¯0(400) 290±30 650±80 330±70
t0t¯0(600) 2.3±0.4 61±7 36±9
t0t¯0(800) 0.06±0.01 6.9±0.7 4.2±1.1
Table 1: Predicted and observed yields in the combined e
+jets and
µ+jets channels with
≥6 jets as a function of b-tag multiplicity. The t¯ t background prediction is after fitting to data using the full H
Tspectrum (see text for details). Also shown is the expected t
0t ¯
0signal in both the doublet and singlet scenarios for m
t0 =400, 600 and 800 GeV. The uncertainties shown are post-fit and include the e
ffect of statistical and systematic uncertainties. The uncertainty on the total background is smaller than the sum in quadrature of the uncertainties on the individual background sources due to the anti-correlation between the t¯ t
+light jets and t¯ t
+heavy-flavour jets components resulting from the fit.
shape and normalisation. The total prior systematic uncertainty in the background normalisation in the
≥
4 b-tags channel is
∼42%, with the dominant uncertainties being fromb tagging efficiency (16%), c tagging e
fficiency (11%), jet energy scale (11%), t¯ t modelling (11%), t¯ t
+heavy-flavour fractions (32%) and t¯ t cross section (10%). As a result of the two-parameter fit, the total background uncertainty is reduced by about 80% in this channel. The total systematic uncertainty in the signal normalisation in the
≥
4 b-tags channel is
∼21%, completely dominated by the uncertainty in theb tagging e
fficiency. The following sections describe each of the systematic uncertainties considered in the analysis.
8.1 Luminosity
The luminosity estimate has an uncertainty of 3.6% [61]. This systematic uncertainty is applied to all processes except the multijet background.
8.2 Physics Objects
In this section uncertainties in the reconstruction of leptons, jets, and b-, c-, and light flavour-tagging are
considered.
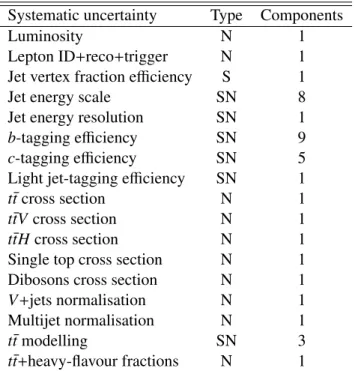
Systematic uncertainty Type Components
Luminosity N 1
Lepton ID
+reco
+trigger N 1 Jet vertex fraction e
fficiency S 1
Jet energy scale SN 8
Jet energy resolution SN 1
b-tagging e
fficiency SN 9
c-tagging efficiency SN 5
Light jet-tagging e
fficiency SN 1
t¯ t cross section N 1
t¯ tV cross section N 1
t¯ tH cross section N 1
Single top cross section N 1
Dibosons cross section N 1
V
+jets normalisation N 1
Multijet normalisation N 1
t¯ t modelling SN 3
t¯ t
+heavy-flavour fractions N 1
Table 2: List of systematic uncertainties considered. A “N” means that the uncertainty is taken as normalisation-only for all processes and channels affected. A “SN” means that the uncertainty is taken as both shape and normalisation, although for small backgrounds only the normalisation uncertainty is considered. Some of the systematic uncertainties are split into several di
fferent components for a more accurate treatment.
8.2.1 Lepton Reconstruction, Identification and Trigger
The reconstruction and identification efficiency of electrons and muons, as well as the efficiency of the triggers used to record the events, differ between data and simulation. Scale factors are derived using tag-and-probe techniques on Z
→ `+`−(`
=e, µ) data and simulated samples to correct the simulation for these discrepancies. Since this analysis combines the e
+jets andµ+jets channels, a single per-leptonuncertainty of 2.1% is estimated from the quadratic sum of all above contributions on the combined e
+jets and
µ+jets yields.
8.2.2 Lepton Momentum Scale and Resolution
The accuracy of lepton momentum scale and resolution in simulation is checked using reconstructed
distributions of the Z
→ `+`−and J/ψ
→ `+`−masses. In the case of electrons, E/p studies using
W
→eν events are also used. Small discrepancies are observed between data and simulation, and
corrections for the lepton energy scale and resolution in the latter are applied. In the case of electrons,
energy scale corrections need to be applied to data (all regions) and simulation (calorimeter transition
region), while energy resolution corrections are applied to the simulation only. In the case of muons,
momentum scale and resolution corrections are only applied to the simulation. Uncertainties on both
the momentum scale and resolution are considered, and varied separately. The resulting uncertainties
on the total yields predicted by the simulation are at the sub-percent level and therefore neglected in the
analysis.
8.2.3 Jet Vertex Fraction Efficiency
The per-jet e
fficiency to satisfy the
|JVF| >0.5 requirement is measured in Z(→
`+`−)
+1-jet events in data and simulation, selecting separately events enriched in hard-scatter jets and events enriched in jets from other proton interactions in the same bunch crossing (pileup). Dedicated data/simulation efficiency and ine
fficiency scale factors are measured separately for both types of jets. The e
fficiency scale factor for hard-scatter jets decreases from
∼1.03 at p
T =25 GeV to
∼1.01 for p
T>150 GeV. The scale factors for pileup jets are found to be consistent with 1. The product of all per-jet scale factors define a per-event weight used to calibrate the simulation to data. The propagation of the per-jet scale factor uncertainty results in an overall uncertainty on the signal and background acceptance of
∼2.2%.
8.2.4 Jet Energy Scale
The jet energy scale (JES) and its uncertainty have been derived combining information from test-beam data, LHC collision data and simulation [25, 62–65]. The jet energy scale uncertainty is split into 8 uncorrelated sources which can have different jet p
Tand
ηdependencies and are treated independently in this analysis. The missing transverse momentum is corrected according to the varied p
Tof the jets in each event.
8.2.5 Jet Energy Resolution
The jet energy resolution has been measured separately for data and simulation using two in-situ tech- niques [25]. The expected fractional p
Tresolution for a given jet was measured as a function of its p
Tand rapidity. A systematic uncertainty is defined as the quadratic difference between the jet energy resolutions for data and simulation. To estimate the corresponding systematic uncertainty in the anal- ysis, the energy of jets in the simulation is smeared by this residual di
fference, and the changes in the normalisation and shape of the final discriminant are compared to the default prediction. Since jets in the simulation cannot be under-smeared, by definition the resulting uncertainty on the normalisation and shape of the final discriminant is one-sided. This uncertainty is then symmetrised.
8.2.6 Heavy- and Light-Flavour Tagging
The e
ffects of uncertainties in e
fficiencies for the heavy flavour identification of jets by the b-tagging algorithm have been evaluated. These e
fficiencies are measured from data and depend on the jet flavour.
Efficiencies for b and c quarks in the simulation have to be corrected by p
T-dependent factors of 0.9–1.0 and 1.1–1.2, respectively, whereas the light jet efficiency has to be scaled up by a factor of
∼1.3.These scale factors have an uncertainty between 7% and 13% for b jets, between 15% and 39% for c jets, and
∼25% for light jets. The scale factors and their uncertainties are applied to each jet in the simulation depending on its flavour and p
Tand
η[66–68].
A total of nine and five independent sources of uncertainty are considered for the b-tagging and c- tagging efficiencies, respectively. Each of these uncertainties correspond to a resulting eigenvector after diagonalising the matrix containing the information of total uncertainty per p
Tbin and the bin-to-bin correlations. These systematic uncertainties are taken as uncorrelated between b, c jets, and light flavour jets. A per-jet weighting procedure is applied to simulated events to propagate the calibration of b tagging and the related uncertainties.
8.3 Normalisations of Data-Driven Backgrounds
In this section the uncertainties in data-driven background estimates are described.
8.3.1
W
/Z
+jets NormalisationThe W
/Z
+jets cross sections from A
lpgenare a
ffected by large uncertainties because they are a leading- order calculation. As discussed in Sect. 6.2, the overall W
+jets normalisation is obtained via data-drivenmethods separately for events with exactly 4 and
≥5 jets in order to ensure the best possible central value for the predicted W
+jets yield. An additional 24% uncertainty is assigned to the extrapolation of the data-driven estimate to events with
≥6 jets.
In addition, the following normalisation uncertainties are considered in determining the systematic uncertainty on the estimate of the W
+jets heavy-flavour content:
•
the fractions of Wb b, ¯ Wc¯ c and Wc are varied by
±20% in a correlated way; the fraction ofW
+light jets is recomputed to maintain the overall W
+jets normalisation before any b-tagging requirement;
•
the fractions of Wb b, ¯ Wc¯ c are varied by
±20% in a correlated way, while the fraction ofW
+light jets is left untouched; the fraction of Wc is recomputed to maintain the overall W
+jets normalisa- tion before any b-tagging requirement;
•
a theoretical systematic uncertainty on the Wb b, ¯ Wc c ¯ and Wc fractions from the extrapolation made from 2-jet events, where these fractions are measured in data, to higher jet multiplicity is assessed. This uncertainty is estimated from simulation studies where the W
+heavy-flavour fractions are studied as a function of variations in the Alpgen generator parameters. For each jet multiplicity above 2 jets, a 25% uncertainty on these fractions is added in quadrature, resulting in a total uncertainty of 35% for 4 jets, 43% for 5 jets, and 50% for
≥6 jets. These extrapolation uncertainties on Wb b ¯ and Wc¯ c are treated as fully correlated, and both are treated as uncorrelated with respect to the extrapolation uncertainty on Wc. The fraction of W
+light jets is recomputed tomaintain the overall W
+jets normalisation before any b-tagging requirement.
The sum in quadrature of the above contributions result in a total uncertainty of
∼50% on the es-timated W
+jets normalisation for events with
≥6 jets and
≥2 b tagged jets. This uncertainty is also assigned to the Z
+jets normalisation.8.3.2 Multijet Normalisation
Systematic uncertainties on the multijet background estimate via the Matrix Method receive contribu- tions from the limited data statistics, particularly at high jet and b-tag multiplicities, as well as from the uncertainty on the method, based on the difference between estimates obtained using different control regions and from the calibration of the method using simulated multijet events. The uncertainty due to the method is assessed to be 50%, which is taken as correlated across jet and b-tag multiplicity bins.
8.4 Signal and Background Modelling
The following sections describe uncertainties in the rates and shapes of the discriminating variables arising from estimates based on theoretical calculations.
8.4.1 Theoretical Cross-sections