arXiv:1108.6311v2 [hep-ex] 22 Nov 2011
Search for New Physics in the Dijet Mass Distribution using 1 fb −1 of pp Collision Data at √
s = 7 TeV collected by the ATLAS Detector
ATLAS Collaboration
Invariant mass distributions of jet pairs (dijets) produced in LHC proton-proton collisions at a centre-of-mass energy √ s = 7 TeV have been studied using a data set corresponding to an integrated luminosity of 1.0 fb
−1recorded in 2011 by ATLAS. Dijet masses up to ∼ 4 TeV are observed in the data, and no evidence of resonance production over background is found. Limits are set at 95%
CL for several new physics hypotheses: excited quarks are excluded for masses below 2.99 TeV, axigluons are excluded for masses below 3.32 TeV, and colour octet scalar resonances are excluded for masses below 1.92 TeV.
I. Introduction
The Standard Model (SM) description of high energy proton-proton (pp) collisions is based on the framework of quantum chromodynamics (QCD) in the perturbative regime, where the most energetic collisions result from the 2 → 2 scattering of a pair of partons (quarks or glu- ons). Partons emerging from the collision shower and hadronise, in the simplest case producing two jets of par- ticles, a “dijet”, that may be reconstructed to determine the dijet invariant mass, m jj , the mass of the two-parton system.
Previous studies of dijet mass distributions [1–6] have shown that these analyses are sensitive to the highest mass scales accessible with hadronic final states. In the present study, the dijet mass distribution is examined in a search for resonances due to new phenomena localised near a given mass, employing a data-driven background estimate that does not rely on detailed QCD calculations.
In addition to new physics benchmarks used in previ- ous ATLAS dijet analyses, namely excited quarks (q ∗ ) [7, 8], and axigluons [9–11], the present study includes a third hypothetical object: the colour octet scalar (s8), one of many possible exotic colour resonances [12]. Any of these objects could produce a peak in the dijet spec- trum in the vicinity of their mass.
The present study is based on pp collisions at a centre- of-mass (CM) energy of 7 TeV produced at the CERN Large Hadron Collider (LHC), measured by the AT- LAS detector. This data set corresponds to an inte- grated luminosity of 1.0 fb −1 recorded between March and June 2011. The most stringent limits set previously by the ATLAS Collaboration were based on the full 2010 data sample, corresponding an integrated luminosity of 36 pb − 1 [6]. Excited quarks were excluded below 2.15 TeV, and axigluons below 2.10 TeV. The CMS Collabo- ration has recently completed a dijet resonances analysis in 1.0 fb − 1 of 2011 data, excluding excited quarks below 2.49 TeV and axigluons below 2.47 TeV, along with other limits [13].
A detailed description of the ATLAS detector is avail- able in [14]. The detector is instrumented over almost the entire solid angle around the pp collision point with lay- ers of tracking detectors, calorimeters, and muon cham- bers. Jet measurements are made using a finely seg-
mented calorimeter system designed to detect the high energy jets that are the focus of this study with high efficiency and excellent energy resolution. ATLAS has a three-level trigger system, with the first level trigger (L1) being based on custom-built hardware and the two higher level triggers (HLT) being realised in software.
ATLAS uses a right-handed coordinate system with the z-axis along the beam pipe. The x-axis points to the centre of the LHC ring, and the y-axis points up- ward. Cylindrical coordinates (r,φ) are used in the trans- verse plane, φ being the azimuthal angle. The pseu- dorapidity is defined in terms of the polar angle θ as η ≡ − ln tan(θ/2). Transverse momentum and energy are defined as p T = p sinθ and E T = E sinθ, respectively.
The dijet mass, m jj , is derived from the vectorial sum of the four-momenta of the two highest p T jets in the event. Kinematic criteria based on momentum and an- gular variables are applied to increase the sensitivity to centrally produced high mass resonances.
The angular distribution for 2 → 2 parton scattering is predicted by QCD in the CM frame of the colliding partons, which moves along the beamline due to the dif- fering momentum fractions (Bjorken x) of the colliding partons. If E is the jet energy and p z is the z-component of the jet’s momentum, the rapidity of the jet is given by y ≡ 1 2 ln( E+p E
z− p
z). The rapidities of the two highest p T jets are denoted by y 1 and y 2 , and the corresponding rapidity of these partons in their mutual CM frame is y ∗ = 1 2 (y 1 − y 2 ).
II. Jet reconstruction and event selection Individual jets are reconstructed using the anti-k t jet clustering algorithm [15, 16] with the distance parameter R = 0.6. The inputs to this algorithm are clusters [17]
of calorimeter cells with energy depositions significantly above the measured noise. Jet four-momenta are con- structed as the vectorial sum of clusters of cells, treating each cluster as an (E, ~p) four-vector with zero mass, as- suming that the corresponding particle stems from the primary vertex.
The jet four-momenta are then corrected [18] as a
function of η and p T for various effects, the largest of
which are the hadronic shower response and detector
material distribution. This is done using a calibration
scheme based on Monte Carlo (MC) studies including full detector simulation, and validated with extensive test- beam [19] and collision data [20–22] studies. Measured dijet mass distributions are not corrected for detector res- olution, which, in terms of mass smearing, is σ m
mjjjj
≃ 5%
at m jj ≃ 1 TeV, drops to 4.5% at 2 TeV, and asymptoti- cally approaches 4% at m jj of 5 TeV and above.
The event selection starts with the first-level trigger, which selects events that have at least one large trans- verse energy deposition in the calorimeters, with the transverse energy threshold increasing over the period of the data-taking as the instantaneous luminosity of the LHC pp collisions increased.
To achieve the highest possible effective integrated lu- minosity, the current data set has been recorded using a jet trigger that was usually not prescaled. The chosen trigger has a nominal jet p T threshold of 180 GeV. Af- ter applying all other analysis cuts, m jj is required to be greater than 717 GeV in order to attain a trigger ef- ficiency of at least 99% over the full range of the dijet mass distribution.
Events are required to have a primary collision vertex defined by at least five charged-particle tracks. Events with a poorly measured jet [23] with p T greater than 30%
of the p T of the next-to-leading jet are vetoed, to avoid cases where such a jet would cause incorrect identification of the two leading jets. This rejects less than 0.002% of the events.
Additional kinematic criteria are applied, requiring that the two leading jets each satisfy | η j | < 2.8 and that the rapidity in the parton CM frame satisfies | y ∗ | < 0.6.
These criteria favour central collisions and have been shown, based on studies of expected signals and QCD background, to optimise the analysis sensitivity.
A final selection is made to avoid the calorimeter region from -0.1 to 1.5 in η and from -0.9 to -0.5 in φ, which was in large part affected by readout problems for most of the data used in these studies. Events with jets in this region are discarded. This requirement reduces the data set by 3.7%.
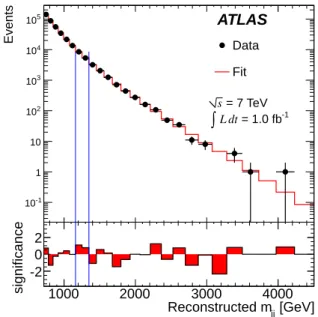
III. Comparing data to a smooth background The observed dijet mass distribution after all selection cuts is shown in Fig. 1. As in the previous ATLAS stud- ies, the m jj spectrum is fit to the smooth functional form f (x) = p 1 (1 − x) p
2x p
3+p
4ln x , (1) where x ≡ m jj / √
s and the p i are fit parameters. This ansatz has been shown empirically to accurately model the steeply falling QCD dijet mass spectrum [3–6]. The m jj bins are of variable width, increasing from ∼ 50 to
∼ 200 GeV for dijet masses from 0.85 to 4.5 TeV, re- spectively, to optimise the performance of the resonance search algorithm discussed in the next section.
The bottom plot of Fig.1 shows the significance, in standard deviations, of the difference between the data and the prediction in each bin. These are purely statis- tical, and based on Poisson distributions. The contents
of a given bin are used to determine the p-value - the probability of the background fluctuating higher than the observed excess, or lower than the observed deficit. The p-value is transformed to a significance, in terms of an equivalent number of standard deviations (the z-value).
Where there is an excess (deficit) in data in a given bin, the significance is plotted as positive (negative). In mass bins with small expected number of events, where the observed number of events is similar to the expectation, the Poisson probability of a fluctuation at least as high (low) as the observed excess (deficit) can be greater than 50%, as a result of the asymmetry of the Poisson distri- bution. Such bins present no statistical interest and, for simplicity, bars are not drawn for them.
To determine the degree of consistency between data and the fitted background, the p-value of the fit is ob- tained by calculating the χ 2 from the data, and com- paring this result to the χ 2 distribution obtained from pseudoexperiments. The resulting p-value is 0.96, show- ing that there is good agreement between the data and the functional form.
1000 2000 3000 4000
Events
10-1
1 10 102
103
104
105
Data Fit
[GeV]
Reconstructed m
jj1000 2000 3000 4000
significance
-2 0 2
ATLAS
= 1.0 fb
-1dt
L
∫ s = 7 TeV
FIG. 1. The reconstructed dijet mass distribution (filled points) fitted with a smooth functional form describing the QCD background. The bin-by-bin significance of the data- background difference is shown in the lower panel. Verti- cal lines show the most significant excess found by the Bum- pHunter algorithm (see text).
IV. Search for resonances
As a more sensitive test, the BumpHunter algo-
rithm [24, 25] is used to establish the presence or absence
of a resonance in the dijet mass spectrum. To optimise
the sensitivity of this algorithm, the m jj binning strat-
egy is to establish a minimum width for resonances to be
considered physical. To this end, the relatively narrow
q ∗ m jj template from full MC simulation [26], described
below for subsequent studies, has been used to establish
the binning. If the width of the resonance is defined as
± 1σ, the greatest sensitivity at the minimum width is achieved by setting the bin width to 1σ, half the reso- nance width. The final result of this procedure is that the variable bin sizes are typically 6.5% to 7.0% of m jj
in width, somewhat wider than detector resolution due to the finite natural width of q ∗ , which varies between about 3% and 3.5% of the q ∗ mass.
In the current implementation, the BumpHunter al- gorithm searches for the signal window with the most significant excess of events above background. Starting with a two-bin window, the algorithm increases the sig- nal window and shifts its location until all possible bin ranges, up to half the mass range spanned by the data, have been tested. The most significant departure from the smooth spectrum (“bump”) is defined by the set of bins that have the smallest probability of arising from a background fluctuation assuming Poisson statistics.
The BumpHunter algorithm accounts for the so- called “look elsewhere effect” (or “trials factor ef- fect”) [27] by performing a series of pseudoexperiments to determine the probability that random fluctuations in the background-only hypothesis would create an excess as significant as the one observed anywhere in the spec- trum. Variable width binning reduces the penalty due to this effect, while retaining sensitivity.
To prevent any new physics signal from biasing the background estimate, if the biggest local excess from the background fit has a p-value smaller than 0.01, this region is excluded and a new background fit is performed. No such exclusion is needed for this data set.
The most significant discrepancy identified by the BumpHunter algorithm in the observed dijet mass dis- tribution reported in Fig. 1 is a 2-bin excess in the inter- val 1.16 to 1.35 TeV. The probability of observing such an excess or larger somewhere in the mass spectrum for a background only hypothesis is 0.82. This test shows that there is no evidence for a resonance signal in the m jj spectrum.
V. New physics models
Exclusion limits are set on three new physics scenarios expected to give rise to resonant dijet production.
For the first of these, excited quarks, q ∗ , a qg → q ∗ production model [7, 8] is used, with the assumption of spin 1/2 and quark-like SM coupling constants. The compositeness scale (Λ) is set to the q ∗ mass. Signal events are produced using the Pythia event genera- tor [28], a leading-order parton-shower MC generator, with the MRST2007LO* [29] parton distribution func- tions (PDF’s), with settings established by the ATLAS default MC10 [30] Monte Carlo tune. The renormaliza- tion and factorization scales are set to the mean p T of the two leading partons for each event. Pythia is also used to decay the excited quarks to all possible SM final states, which are predominantly qg, but also qW , qZ , and qγ. The generated events are passed through the detailed simulation of the ATLAS detector [26], which
uses the Geant4 package [31] for simulation of parti- cle transport, interactions, and decays. The simulated events are then reconstructed in the same way as the data to produce predicted dijet mass distributions that can be compared with the observed distributions.
The second model is axigluon production [9–11] via an interaction given by the Lagrangian
L Aq¯ q = g QCD qA ¯ a µ λ a
2 γ µ γ 5 q, (2) where g 2 QCD = 4πα s is the QCD coupling constant and A a µ is the axigluon field representing a massive state with axial coupling to quarks. Parity conservation prevents the axigluon from coupling to two gluons. Parton-level events are generated, at leading-order approximation, us- ing the CalcHEP Monte Carlo package [32], for chosen masses, m, of the axigluon. The MRST2007LO* PDF set was used. The axigluon dijet mass has longer tails at high and low masses than the q ∗ distribution, but these two shapes are interchangeable within the range 0.7m to 1.3m for all masses of interest. Since the axigluon tails outside this range are well below the SM background, the predicted signal may be analyzed by cutting events beyond this range and accounting for the reduced accep- tance. The axigluon MC prediction for σ × A , the pro- duction cross section within the acceptance, is defined to include these cuts by applying them at the level of CalcHEP generation, along with the kinematic cuts in p T and rapidity. In the limit setting analysis, these ax- igluon results are compared to the observed σ × A limits from the q ∗ analysis. This method is discussed in more detail in Section VI.
The third resonant hypothesis, the colour octet scalar (s8) model, is a prototype for many possible exotic coloured resonances [12]. Colour octet resonances can couple to gluons, which have large parton luminosity at the LHC. One possible interaction is
L gg8 = g QCD d ABC κ s
Λ s
S 8 A F µν B F C,µν , (3) where S 8 A is the colour octet scalar field, κ s is the scalar coupling (assumed to be unity), and d ABC is the SU(3) isoscalar factor; Λ s is the new physics scale which is set to the resonance mass, M s
8. This model leads to a very simple event topology, with two gluons in the initial and final states, yielding high p T dijets. MadGraph 5 [33] is used to generate parton level events at leading-order ap- proximation. Pythia with CTEQ6L1 PDF’s is used in this generation, with the ATLAS MC09’ tune [34]. These samples are processed through the full ATLAS detector simulation.
The observed limits on s8 are less strict than the corre-
sponding q ∗ limits, in part because the s8 signal is much
wider than q ∗ . Much of this width increase is due to fi-
nal state radiation, which is larger for gluon-jets than for
quark-jets. In addition, the initial state for s8 production
contains gluons, which have small parton density at high
mass. Thus, s8 are much more likely to be off-mass-shell
than q ∗ .
VI. Model dependent limit setting
In the absence of any observed significant discrepancy from the zero-signal hypothesis, the Bayesian method documented in [6] is used to set 95% credibility-level (CL) upper limits.
Bayesian credibility intervals are set by defining a pos- terior probability density from the Poisson likelihood function for the observed mass spectrum, obtained by a fit to the background functional form and a signal shape derived from MC simulations. A prior probability den- sity constant in all positive values of signal cross section, and zero at negative values, is used. The posterior prob- ability is then integrated to determine the 95% CL for a given range of models, usually parameterised by the mass of the resonance.
Limits are determined on σ × A for a hypothetical new particle decaying into dijets. The acceptance includes all reconstruction steps and analysis cuts described above, and assumes that the trigger is fully efficient. (The effi- ciency is greater than 99% for all analyses.)
The effects of systematic uncertainties due to the knowledge of the luminosity and of the jet energy scale (JES) are included. The luminosity uncertainty for the 2011 data is 3.7% [35]. The systematic uncertainty on the JES is taken from the 2010 data [18] analysis, and is adapted to the 2011 analysis taking into account in particular the new event pileup conditions (described be- low). The JES uncertainty shifts resonance peaks by less than 4%. The background parameterization uncertainty is taken from the fit results, as described in [6]. The effect of the jet energy resolution (JER) uncertainty is found to be negligible. All of these uncertainties are incorporated into the fit by varying all sources according to Gaussian probability distributions and convolving them with the Bayesian posterior probability distribution. Credibility intervals are then calculated numerically from the result- ing convolutions. No uncertainties are associated with the theoretical model of new physics, as in each case the model is a benchmark that incorporates a specific choice of model parameters, of PDF set, and of MC tune. Pre- vious ATLAS studies have already explored the impact of different MC tunes and PDF sets on the q ∗ theoretical prediction [4].
In 2011, the instantaneous luminosity has risen to a level where corrections must be made for multiple pp col- lisions occurring in the same bunch crossing (“pileup”), whose presence affects the measurement of calorimeter energy depositions associated with the hard-scattering event under study. All simulated samples used in this analysis include a Poisson distributed number of MC minimum bias events added to the hard interaction to account for “in-time” pileup caused by additional colli- sions in the same bunch crossing. Further account must be taken of “out-of-time” pileup originating from colli- sions in bunches preceding or following the one of inter- est, due to the long response time of the liquid argon calorimeters. With the 50 ns bunch spacing in the LHC for these data, up to 12 preceding bunches and 1-2 follow-
ing bunches contribute to out-of-time pileup. Although the conditions modelled in MC are realistic, they may not perfectly match the data due to bunch train struc- ture and instantaneous luminosity variations in the LHC.
The MC events are therefore reweighted to remove these residual differences. Following this procedure the pileup description in MC is sufficiently good that no additional uncertainty on the JES is required for jets with p T > 100 GeV.
The resulting limits are shown in Fig. 2. For excited quarks, the acceptance A ranges from 37 to 51% for m q
∗varying from 0.8 to 5.0 TeV, and is never lower than 47%
above masses of 1.1 TeV. The main impact on the accep- tance comes from the rapidity requirements. Using the theoretical prediction for q ∗ production described above, the expected mass limit at 95% CL is 2.81 TeV, and the observed limit is 2.99 TeV.
The axigluon results are obtained from the σ × A lim- its determined from the q ∗ analysis. The axigluon the- oretical prediction is derived from the cross section pro- vided by CalcHEP at each simulated mass, m, within the restricted mass range 0.7m to 1.3m, after applying the kinematic selections. Using the axigluon theoretical σ × A thus defined, the expected axigluon mass limit at 95% CL is 3.07 TeV, and the observed limit is 3.32 TeV.
This method has been confirmed by full simulation of axigluon samples at three mass points, showing that the differences between parton level and full simulation are negligible compared to the effects of other uncertainties.
Figure 2(b) shows the limits on the accepted cross sec- tion σ ×A for colour octet resonances. The expected mass limit at 95% CL is 1.77 TeV, and the observed limit is 1.92 TeV. Since the colour octet scalar cross section de- creases much more rapidly with m than those for excited quark and axigluon production, the resulting limits are considerably lower.
For all three models used in these studies, if systematic uncertainties had not been included the exclusion limits would be approximately 60 GeV higher.
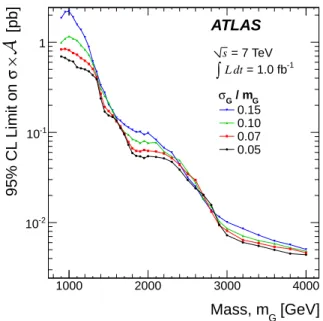
VII. Model independent limit setting In addition to specific theoretical models, limits are set to a collection of hypothetical signals that are assumed to be Gaussian-distributed in m jj with mean (m G ) ranging from 0.9 to 4.0 TeV and standard deviation (σ G ) from 5% to 15% of the mean.
Systematic uncertainties are treated using the same methods as applied in model dependent limit setting.
The only difference for the Gaussian analysis arises from the decay of the dijet final state not being simulated. In place of this, it is assumed that the dijet signal distri- bution is Gaussian in shape, and the JES is adjusted by modelling it as an uncertainty of 4% in the central value of the Gaussian signal.
The resulting limits on σ ×A for the Gaussian template model are shown in Fig. 3. Relative to previous studies [6]
they are substantially improved in the region above 900
GeV. These results may be utilised to set limits on new
Mass [GeV]
1000 2000 3000 4000
[pb] xA × σ
10 -2
10 -1
1 10 10 2
10 3 q* A
Observed 95% CL upper limit Expected 95% CL upper limit 68% and 95% bands
ATLAS
= 1.0 fb
-1dt
L
∫
= 7 TeV s
(a)Excited-quark and axigluon models.
Mass [GeV]
1000 2000 3000 4000
[pb] xA × σ
10 -2
10 -1
1 10 10 2
10 3 s8 Observed 95% CL upper limit Expected 95% CL upper limit 68% and 95% bands
ATLAS
= 1.0 fb
-1dt
L
∫
= 7 TeV s
(b)Colour octet scalar model.
FIG. 2. The 95% CL upper limits on σ × A as a function of particle mass (black filled circles). The black dotted curve shows the 95% CL upper limit expected from Monte Carlo and the light and dark yellow shaded bands represent the 68% and 95%
contours of the expected limit, respectively. Theoretical predictions for σ × A are shown in (a) for excited quarks (blue dashed) and axigluons (green dot-dashed), and in (b) for colour octet scalar resonances (blue dashed). For a given new physics model, the observed (expected) limit occurs at the crossing of its σ × A curve with the observed (expected) 95% CL upper limit curve.
[GeV]
Mass, m G
1000 2000 3000 4000
[pb] xA × σ 9 5 % C L L im it o n
10
-210
-11
/ m
Gσ
G0.15 0.10 0.07 0.05
ATLAS
= 1.0 fb
-1dt
![TABLE II. The 95% CL upper limit on σ × A [pb] for the Gaussian “model-independent” scenario](https://thumb-eu.123doks.com/thumbv2/1library_info/4025181.1542049/6.918.554.763.177.935/table-ii-upper-limit-gaussian-model-independent-scenario.webp)
