CERN-PH-EP-2011-131
Search for displaced vertices arising from decays of new heavy particles in 7 TeV pp collisions at ATLAS
The ATLAS Collaboration
Abstract
We present the results of a search for new, heavy particles that decay at a significant distance from their production point into a final state containing charged hadrons in association with a high-momentum muon. The search is conducted in app-collision data sample with a center-of-mass energy of 7 TeV and an integrated luminosity of 33 pb−1collected in 2010 by the ATLAS detector operating at the Large Hadron Collider. Production of such particles is expected in various scenarios of physics beyond the standard model. We observe no signal and place limits on the production cross-section of supersymmetric particles in an R-parity-violating scenario as a function of the neutralino lifetime. Limits are presented for different squark and neutralino masses, enabling extension of the limits to a variety of other models.
1. Introduction
Various scenarios of physics beyond the standard model predict the production at the Large Hadron Collider (LHC) of heavy particles with lifetimes that may be of order picoseconds to about a nanosecond. An exam- ple of such a scenario is gravity-mediated supersymmetry (SUGRA) with R-parity violation (RPV), where current limits on RPV couplings [1] allow for the decay vertex of the lightest supersymmetric particle to be within the range accessible to collider-based particle detectors. In gauge- mediated supersymmetry models, the next-to-lightest su- persymmetric particle may be long lived due to suppres- sion of its decay by the large supersymmetry-breaking scale [2]. Additional scenarios allowing for such a sig- nature include split-supersymmetry [3], hidden-valley [4], dark-sector gauge bosons [5], stealth supersymmetry [6], or a meta-stable supersymmetry-breaking sector [7].
Searches for related signatures have been performed at the Tevatron with √
s= 1.96 TeV p¯pcollisions. The D0 collaboration has searched for a long-lived neutral particle decaying into a final state containing two muons [8] or ab¯b pair [9]. No signal was observed, and limits were computed in the context of RPV and hidden-valley model scenarios.
In this letter, we report the results of a search for a heavy particle decaying into several charged particles at a distance of order millimeters to tens of centimeters from theppinteraction point, in events containing a muon with high transverse momentum (pT). We report the results of the search in terms of limits within the SUGRA sce- nario, where this signature corresponds to the decay of the lightest supersymmetric particle due to non-zero RPV couplings λ02ij, via a diagram such as the one shown in Fig. 1. However, it may also be the result of other mod- els with heavy, long-lived particles that decay into or are
produced in association with a high-pTmuon.
µ~
~0
χ λ
qj
qi
‘
µ χ~
ij
λ‘2 qi
Figure 1: Example of a diagram of a new massive particle ˜χ0(such as the lightest neutralino) decaying into a muon and two jets via a virtual smuon, with lepton-number andR-parity violating coupling λ02ij.
2. The ATLAS detector
The ATLAS detector [10] comprises a tracking inner de- tector (ID) system, a calorimeter system, and an extensive muon spectrometer (MS).
The ID operates in a 2 T magnetic field and provides tracking and vertex information for charged particles in the pseudorapidity range |η| < 2.5, where η ≡ −ln tan(θ/2) andθis the polar angle, defined with respect to the cylin- drical symmetry axis (thezaxis) of the detector. At small radii, high-resolution pattern recognition capability is ob- tained using silicon pixel layers and stereo pairs of silicon microstrip layers. The pixel system comprises three barrel layers, and three forward disks on each side of the interac- tion point. Of particular significance to this analysis are the barrel pixel layers, which are positioned at radii of 50.5, 88.5, and 122.5 mm. The silicon microstrip tracker (SCT) has four barrel layers, and nine forward disks on each side.
Preprint submitted to Physics Letters B December 28, 2011
arXiv:1109.2242v2 [hep-ex] 28 Dec 2011
At larger radii, a transition-radiation tracker (TRT) com- posed of straw-tube elements interleaved with transition- radiation material contributes to track reconstruction up to |η|= 2.0 and improves electron identification.
The calorimeter system covers the pseudorapidity range
|η| < 4.9. It includes a lead/liquid-argon electromag- netic calorimeter and a hadronic calorimeter comprising a steel/scintillating-tile barrel system and a liquid-argon endcap system with copper and tungsten absorbers.
The MS provides muon identification and momentum measurement in the pseudorapidity range |η|<2.7 using a 3-layer system of gas-filled precision-tracking chambers.
The |η| <2.4 range is covered by separate trigger cham- bers, which are used for the level-1 hardware trigger. The MS operates in a toroidal magnetic field generated by a barrel toroid and two endcap toroids.
A three-level trigger system is used for online event selection. It comprises a hardware-based level-1 trigger, which uses information from the MS trigger chambers and the calorimeters, followed by two software-based trigger levels.
3. Data and simulation
The data used in this analysis were collected between June and October 2010. Basic requirements on stable beam, detector, and trigger conditions are applied, result- ing in a total integrated luminosity of 33 pb−1.
Monte Carlo (MC) simulated event samples are used to study possible sources of background, evaluate accep- tance and signal efficiency, and for systematic-uncertainty studies. For this purpose, we use minimum-bias, QCD- dijet, W+ jets, and Z+ jets samples produced with the PYTHIA [11] MC generator, and tt¯samples generated with MC@NLO [12].
We use PYTHIA to generate signal events, where a pair of primary squarks or a squark-antisquark pair is produced in the pp collision, and each squark (antisquark) decays into a neutralino and a quark (antiquark). The signal events are generated with a gluino mass of 5 TeV, so that the cross-section for gluino-pair production is small, and this process is not considered.
The parameters of the different signal MC samples are shown in Table 1. The generated values of squark and neu- tralino masses are chosen so as to provide a broad range of neutralino velocities and daughter-particle multiplici- ties, which are the quantities that have the greatest im- pact on the signal efficiency (see discussion in Section 5)1. The signal MC samples are labeled in Table 1 according to the squark mass and neutralino mass, respectively: MH (medium-mass squark, heavy neutralino), ML (medium- mass squark, light neutralino), LL (light squark and light neutralino), and HH (heavy squark and heavy neutralino).
1The final neutralino mass values are the result of Higgsino- gaugino mixing.
Sample mq˜ σ mχ˜0
1 hγβiχ˜0
1 cτMC
[GeV] [fb] [GeV] [mm]
MH 700 66.4 494 1.0 78
ML 700 66.4 108 3.1 101
LL 150 539×103 108 1.5 196
HH 1500 0.2 494 1.9 82
Table 1: Parameters of the four signal MC samples used in the analysis: the squark mass, production cross-section from PROSPINO [13], neutralino mass, average neutralino boost factor from PYTHIA [11], and average proper flight distance.
The RPV couplingλ0211is set to a non-zero value, so that each neutralino decays to µ−ud¯(or the charge-conjugate state). The value of λ0211 for each sample is chosen so that a significant fraction of neutralino decays takes place throughout the pixel region, and the resulting average neu- tralino proper flight distances (cτMC, whereτMCis the gen- erated neutralino lifetime) are given in Table 1. We note that while the MC distributions shown in Figs. 3, 4, and 7 depend on cτMC, the results of the analysis, presented in Section 8, are independent of the values ofλ0211andcτMC with which the signal MC samples are generated.
The signal cross-section values listed in Table 1 are obtained from PROSPINO [13], which performs a next- to-leading-order calculation. We observe that the cross- sections for ˜q˜qand ˜q¯˜qevents are significantly different be- tween PYTHIA and PROSPINO, and that the neutralino- velocity distributions generated by PYTHIA for these two types of events are different, especially in the 150-GeV squark case. To take this into account, ˜q˜q and ˜q¯˜q events signal samples are generated separately with PYTHIA, and reweighted according to the relative cross-sections of the two event types in PROSPINO.
The background and signal MC samples are generated with an average of hµi= 2.2 interactions per event, cor- responding to hµi for data taken in 2010. An additional sample, otherwise identical to the MH sample in Table 1, is produced withhµi= 5. Each simulated event is passed through the GEANT4-based [14] ATLAS detector simula- tion [15] and processed in the same way as the data.
4. Vertex reconstruction and event selection
We select events that pass an MS level-1 single-muon trigger, where the muon candidate has transverse momen- tumpT>40 GeV, as determined in the MS. We require the primary vertex (PV) originating from theppcollision to have at least five tracks and a z position in the range
|zPV|<200 mm. In events with multiple interactions, the PV with the highest scalar sum of the pT of its tracks is used.
Reconstruction of a displaced vertex (DV) begins with the selection of tracks with pT >1 GeV formed with at least two SCT hits. For each track we require|d0|>2 mm,
where |d0| is the impact parameter of the track with re- spect to the transverse position of the PV, (xPV, yPV). In the MC, this requirement rejects 98% of all tracks origi- nating from the primaryppinteraction.
The selected tracks are used to search for displaced vertices using an algorithm based on the incompatibility- graph approach, similar to that used in Ref. [16]. The algo- rithm begins by reconstructing 2-track seed vertices from all track pairs, and keeping those that have a vertex-fitχ2 less than 5. A seed vertex is rejected if one of its tracks has hits between the vertex and the PV. Seed vertices are combined into multi-track vertices in an iterative process, as follows. If a track is used in two different vertices, the action taken depends on the distance D between the ver- tices: if D <3σD, whereσD is the estimated uncertainty on D, then the tracks of the two vertices are combined and refitted to a single vertex; otherwise, the track is as- sociated with only the vertex relative to which it has the smaller χ2. If the χ2 of a track relative to the resulting vertex is greater than 6, the track is removed from the ver- tex, and the vertex is refitted. The process continues until no tracks are shared among different vertices. Finally, ver- tices that are separated by less than 1 mm are combined and refitted. Events containing at least one such displaced vertex are said to satisfy the event selection criteria.
The typical position resolution of the DV in the sig- nal MC samples is tens of microns for rDV and about 200 microns for zDV near the interaction point. For vertices beyond the outermost pixel layer, which is located at a ra- dius of 122.5 mm, the typical resolution is several hundred microns for both coordinates.
To ensure the quality of the DV fit, we require the χ2 per degree of freedom (DOF) of the fit to be less than 5. The DV position is required to be within the bar- rel pixel fiducial region, defined by the longitudinal and transverse ranges |zDV| < 300 mm, rDV < 180 mm, re- spectively. To suppress background from tracks that orig- inate from the PV, we require the transverse distance p(xDV−xPV)2+ (yDV−yPV)2between the primary and the displaced vertices to be at least 4 mm. We require the number of tracksNDVtrkin the DV to be at least four, to sup- press background from random combinations of tracks and from material interactions. Background due to particle in- teractions with material is further suppressed by requiring mDV > 10 GeV, where mDV is the invariant mass of the tracks originating from the DV. We refer to vertex candi- dates that satisfy (fail) the mDV >10 GeV requirment as high-mDV (low-mDV) vertices.
Low-mDV vertices from particle-material interactions are abundant in regions of high-density detector material.
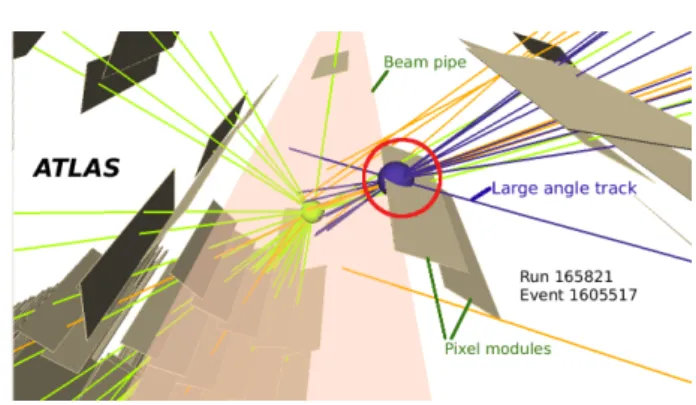
High-mDV background may arise from random spatial co- incidence of such a vertex with a high-pTtrack, especially when this track and the particle that created the material- interaction vertex originate from different primary inter- actions, which may result in a large angle between their momentum vectors. An example of such a random com- bination of a material-interaction vertex with a high-pT
track is shown in Fig. 2.
Figure 2: An event from a jet-trigger data sample, where a high- mass vertex (circled) is the result of an apparently random, large- angle intersection between a track (labeled as “Large angle track”) and a low-mDVhadronic-interaction vertex produced in a pixel mod- ule. Tracks originating from this vertex are shown in blue, those from the primary vertex are green, and other tracks are orange. The beampipe and pixel modules with track hits are shown.
To suppress this type of background, we veto vertices that are reconstructed within regions of high-density ma- terial, mapped using low-mDV material-interaction candi- date vertices in data and true material-interaction vertices in minimum-bias MC events. We use thezDV andrDVpo- sitions of these vertices to form a 2-dimensional material- density map with a bin size of 4 mm inzDV and 1 mm in rDV. Studies have shown [16] that the positions of pixel layers and associated material are well simulated in the MC detector model, while the simulated beampipe posi- tion is shifted with respect to the actual position. Thus, the use of data events to construct the material map en- sures the correct mapping of the beampipe material, while MC events make possible the high granularity of the map at the outer pixel layers, where material-interaction ver- tices in the data are relatively rare due to the low density of primary particles. Material-map bins with vertex den- sity greater than anrDV- andzDV-dependent density crite- rion are designated as high-density-material regions, which constitute 34.4% of the fiducial volume |zDV| <300 mm, 4 < rDV < 180 mm. High-mDV vertices reconstructed within these bins are rejected. We refer to the combina- tion of all the requirements above as the vertex-selection criteria.
In addition to the vertex-selection criteria, events are re- quired to contain a muon candidate reconstructed in both the MS and the ID withpT>45 GeV, which is well into the efficiency plateau of the 40 GeV level-1 trigger. The muon candidate must satisfy p
∆φ2+ ∆η2 < 0.1, where
∆φ (∆η) is the difference between the azimuthal angle (pseudorapidity) of the reconstructed muon candidate and that of the muon identified by the trigger. The ID track associated with the muon candidate is required to have at least six SCT hits, with at most one SCT hit that is ex- pected but not found, and must satisfy an |η|-dependent requirement on the number of TRT hits. No pixel-hit re- 3
quirements are applied to the muon track. The muon track is not required to originate from a DV, in order to maintain high signal efficiency and sensitivity to scenarios where the muon may originate from the PV rather than from the DV, such as supersymmetry with longer decay chains involving prompt smuons. The combination of requirements above is referred to as the muon-selection criteria.
5. Signal efficiency
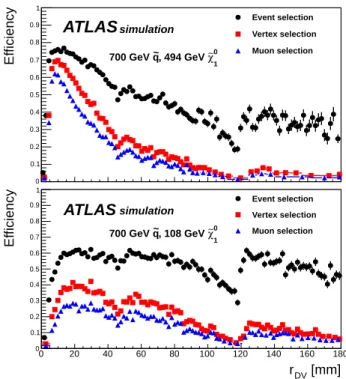
The efficiency for signal MC vertices is shown in Fig. 3 as a function ofrDVfor the different selection criteria and two representative signal MC samples – sample MH of Table 1, where the neutralino is heavy and slow moving, and sam- ple ML, where it is light and highly boosted. The efficiency presented in Fig. 3 depends strongly on the efficiencies for track reconstruction and track selection, which are affected by several factors: (1) The number of tracks originating from the DV and their total invariant mass increase with the neutralino mass. (2) More tracks fail the|d0|>2 mm requirement for small rDV or if the neutralino is highly boosted. (3) Track-finding algorithms used in track recon- struction are not optimized for tracks with large values of
|d0|, resulting in decreased efficiency for large rDV. (4) One of the track-quality requirements applied by standard ID tracking is that tracks share no more than one hit in the pixel and SCT layers. As a result, the efficiency is low whenrDV is slightly smaller than the radial positionrpixel
of a pixel layer and increases again forrDV > rpixel. We observe in MC studies that the vertex-efficiency de- pendence onzDVis, to a good accuracy, uncorrelated with its rDV dependence. Therefore, we parametrize the effi- ciency function (rDV, zDV) as a histogram in rDV and a fourth-order polynomial inzDV, with parameters obtained from a fit to the MC. An example of the resulting efficiency function, after including the effect of the material veto, is shown in Fig. 4.
Fig. 5 shows comparisons between data and background MC distributions of mDV and NDVtrk for selected events in the control region, mDV <10 GeV and before applying the material veto. Overall, good agreement between data and MC is observed. As we show in Section 6, the level of background contamination in our sample is estimated to be very small. Therefore, small discrepancies between the data and MC distributions do not have significant impact on the final results. Additional studies comparing MC and control-sample data are described in Section 7.
6. Background estimation
As we show later in this section, the probability for background events to satisfy all the selection criteria is ex- tremely low. Therefore, in order to obtain enough events for background estimation, we study the efficiency of the
[mm]
rDV
0 20 40 60 80 100 120 140 160 180
Efficiency
0 0.1 0.2 0.3 0.4 0.5 0.6 0.7 0.8 0.9 1
Event selection Vertex selection Muon selection
ATLASsimulation
0
χ∼1
, 494 GeV q~ 700 GeV
[mm]
rDV
0 20 40 60 80 100 120 140 160 180
Efficiency
0 0.1 0.2 0.3 0.4 0.5 0.6 0.7 0.8 0.9 1
Event selection Vertex selection Muon selection
ATLASsimulation
0
χ∼1
, 108 GeV q~ 700 GeV
Figure 3: The efficiency as a function ofrDVfor vertices in the sig- nal MC samples MH (top) and ML (bottom) of Table 1. In each plot, the top histogram (circles) is the efficiency for the event selection cri- teria, the middle histogram (squares) shows the efficiency when also requiring one vertex to satisfy the vertex-selection criteria, and the bottom histogram (triangles) includes the muon-selection criteria.
The material veto is not applied when making these plots.
| [mm]
|zDV
0 50 100 150 200 250 300
[mm]DVr
0 20 40 60 80 100 120 140 160 180
0 0.05 0.1 0.15 0.2
ATLAS simulation 0.25
Figure 4: The efficiency as a function ofrDVandzDVfor vertices in the signal MC sample ML of Table 1. High-density material regions that are vetoed are shown in white. The four major vetoed regions surround the beampipe wall, at radii of about 25−37 mm, and the three barrel pixel layers.
Vertex mass [GeV]
0 1 2 3 4 5 6 7 8 9 10
Vertices / 0.1 GeV
10-1
1 10 102
103
data 2010 Dijet MC W,Z MC ttbar MC
ATLAS
Ldt = 33 pb-1
∫
Number of tracks in vertex
2 4 6 8 10 12
Number of vertices
10-1
1 10 102
data 2010 Dijet MC W,Z MC ttbar MC
ATLAS
Ldt = 33 pb-1
∫
[mm]
Vertex rDV
0 20 40 60 80 100 120 140 160 180
Vertices / 2 mm
10-1
1 10 102
103 data 2010
Dijet MC W,Z MC ttbar MC
ATLAS
Ldt = 33 pb-1
∫
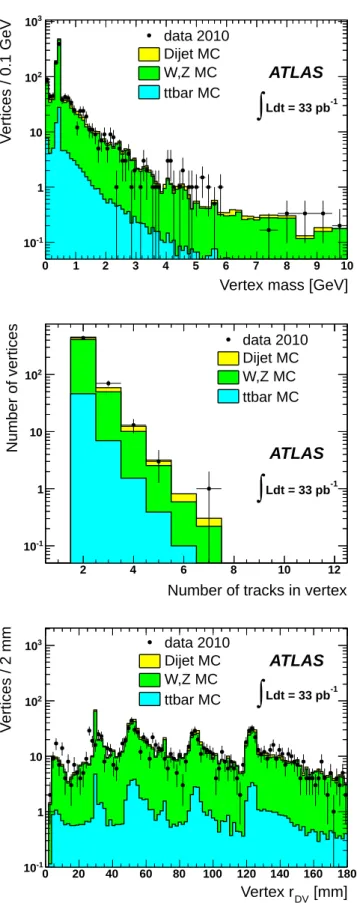
Figure 5: Comparison of themDV (top),NDVtrk (center), andrDV
(bottom) distributions of data and MC events in the control region mDV<10 GeV. Other than the material veto and theNDVtrk ≥4 andmDV>10 GeV requirements, all selection criteria are applied.
In addition, the NDVtrk and rDV distributions include a veto onKS0 decays. The MC histograms are normalized to the integrated lumi- nosity of the data, with the MC cross-section given by PYTHIA [11].
background to satisfy the muon-selection criteria sepa- rately from the efficiency to satisfy the other selection cri- teria. We then combine the results assuming that the two efficiencies are uncorrelated.
We use the background MC samples (see Section 3) to estimate the number of data events of each background type that are expected to satisfy the selection criteria, without applying any trigger requirements or the muon- selection criteria. Multiplying this number by the proba- bility for each MC event type to satisfy the muon-trigger and the offline muon-selection criteria yields the expected background for each sample. The W− → µ−¯νµ sample yields no selected vertices, but has high efficiency for sat- isfying the muon requirements. As a result, for this back- ground we find the highest upper limit of all the other samples. Given 0 observed W− → µ−ν¯µ MC events and the luminosities of the data and of the MC sample, we find the expected W− → µ−ν¯µ background yield to be Nbgd<0.03 events at 90% confidence level. The expected background yield from Z, t¯t, and dijet events is at least an order of magnitude smaller.
We validate the use of MC to estimate the background by comparing displaced-vertex yields in a sample of non- diffractive MC events and data collected with minimum- bias triggers. For this study, we select vertices with mDV <10 GeV and reject vertices withmDVcorrespond- ing to KS0 or Λ0 decays or to photon conversions, in or- der to increase the purity of material-interaction vertices with high position resolution. From MC, we determine Rint(rDV), the radius-dependent fraction of vertices that are due to particle interactions with material. This frac- tion is close to unity in detector material and much smaller than unity in gap regions between material layers, which are filled with N2gas. UsingRint(rDV) and the number of 2-track vertices in a pixel layer and in the adjacent gap, we determine an effective pixel-layer-to-gas mass-density ratioρ. From ρ, Rint(rDV), and the number ofNDVtrk >2 vertices seen in each pixel layer, we predict the expected number of such vertices in the adjacent gap. Comparing this with the number of vertices actually observed, we find the prediction to be accurate within expected statistical variations in both MC and data.
As a further cross-check of the estimated background level in the muon-trigger sample, we study a control sam- ple of events selected with jet-based triggers and which fail the pT > 45 GeV muon trigger. These events are required to satisfy all the selection criteria, except the muon-selection and mDV > 10 GeV requirements. We denote with Npassjet the number of control-sample events containing a vertex that satisfies the mDV >10 GeV re- quirement. Then an estimate for the mDV > 10 GeV background yield in the muon-trigger sample is Nbgd = Npassjet Nfailµ /Nfailjet = 0.003±0.002 events, where Nfailµ = 3 (Nfailjet = 4170) is the number of selected muon-trigger (control-sample) events with no vertices that pass the mDV >10 GeV requirement, andNpassjet = 4. We perform 5
variations of this estimate to account for some differences in the track-momentum spectrum and inNDVtrkbetween the muon-trigger and control-sample events, and obtain con- sistent results.
We observe that the data-driven background-yield es- timate is consistent with the MC-based upper limit of Nbgd < 0.03 events. In Section 8 we conservatively use the MC-based upper limit when calculating upper limits on the signal yield.
7. Systematic uncertainties
We study several sources of systematic uncertainties on the signal reconstruction efficiency. These include uncer- tainties due to the trigger efficiency, the|d0|dependence of muon- and hadron-reconstruction efficiencies, the perfor- mance of the vertex-reconstruction algorithm, the uncer- tainty on the integrated luminosity, and the effect of multi- pleppinteractions per LHC bunch crossing. These studies and the resulting systematic uncertainties are briefly de- scribed below. We estimate that systematic uncertainties associated with the background estimate have a negligible impact on the limits obtained in Section 8, since the con- servatively estimated background yield is far less than one event.
The efficiency of the trigger used in this analysis has been studied using Z0 → µ+µ− events. Based on that study, we correct the MC-evaluated efficiency by an overall factor of 0.91, and assign to it a relative uncertainty of 0.043. AlthoughZ0bosons are produced at the interaction point, the trigger uses only MS hits, so it is not strongly dependent on the true|d0|value. We find good agreement between MC and data in terms of the dependence of the efficiency on the|d0|measured by the MS.
We test the MC simulation of the |d0| dependence of the offline muon-reconstruction efficiency using cosmic-ray muons found in pp-collision events. A downward-going cosmic-ray muon is reconstructed by the tracking algo- rithm as two separate tracks, one above the interaction point and one below. To identify cosmic-ray muons, we se- lect muon-candidate pairs that are back-to-back to within 0.03 in φand 0.01 inη, and reject beam-produced muons by requiring |d0| > 2 mm for both candidates. The dif- ference ∆pT between the pT of the upper candidate and that of the lower candidate peaks at around 6 GeV, due to muon energy loss in the calorimeters, and the fact that for high-pT muons the pT measurement is dominated by the MS. From the distribution of ∆pTwe find that the purity of the cosmic-ray sample is greater than 95%.
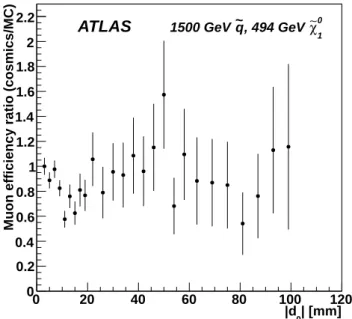
Since the true-|d0|distribution for cosmic-ray muons is flat over the small |d0|range used in the analysis, as veri- fied by cosmic-ray simulation, the measured|d0|distribu- tion of cosmic-ray muons yields the|d0|dependence of the efficiency. Fig. 6 shows the ratio between the number of cosmic muons and the MC muon efficiency as a function of|d0|, normalized to unity in the range 2<|d0|<4 mm.
The ratio shown is for sample HH of Table 1, but is sim- ilar for the other MC samples. All deviations from unity appearing in Fig. 6 (and in the corresponding distribu- tions for the other signal samples) are taken into account in the calculation of the signal efficiency in each d0 bin, and are reflected in Figs. 3 and 4. The statistical uncer- tainties shown in Fig. 6 are propagated to uncertainties of between 3.5% and 8% on the signal reconstruction effi- ciency, depending on the signal sample.
| [mm]
|d0
0 20 40 60 80 100 120
Muon efficiency ratio (cosmics/MC)
0 0.2 0.4 0.6 0.8 1 1.2 1.4 1.6 1.8 2
2.2 ATLAS
1
χ∼0
, 494 GeV
~q 1500 GeV
Figure 6: The ratio between the |d0| distribution of cosmic-ray muons and the|d0|-dependence of the signal MC muon reconstruc- tion efficiency, shown as an example for sample HH of Table 1. The ratio is normalized to unity in the range 2<|d0|<4 mm.
We estimate a systematic uncertainty on the inner- detector track reconstruction efficiency as a function of the radial position of the vertex by comparing the rDV
distributions of KS0 mesons in minimum-bias MC and in data events collected with a minimum-bias trigger. We find that theKS0momentum distributions in data and MC are in good agreement, and hence expect the rDV distri- butions to agree as well. To test this, we compute the ratio RK0
S ≡κdata(rDV)/κMC(rDV), where κi(rDV) is the ratio between the number of KS0 mesons reconstructed in sampleiin a radial range aroundrDV and the number re- constructed inside the beampipe. Based on the largest de- viation ofRK0
S from unity, we determine a systematic un- certainty of 3% for tracks with|η|<1 and 4.3% for tracks with |η| > 1. This track-reconstruction uncertainty is propagated to an uncertainty on the vertex-reconstruction efficiency by random removal of tracks from the signal MC samples prior to vertex reconstruction and generation of alternative versions of the efficiency function(rDV, zDV).
A data-MC difference in the vertex-reconstruction ef-
ficiency is difficult to distinguish from an effect due to tracking-reconstruction efficiency. A vertex-reconstruction efficiency difference is likely to lead to differences in the vertex-fitχ2/DOF. Comparing the fraction of vertices for which theχ2/DOF is below 2.5 in data and MC, we esti- mate a systematic uncertainty of 0.7%.
We take the systematic uncertainty on the luminosity to be 3.4% [17].
The impact of multipleppinteractions per bunch cross- ing on the level of background is studied with jet-trigger events with multiple primary vertices, and is determined to be negligible. The impact on signal efficiency, studied with the hµi= 5 signal MC sample, is negligible as well.
Therefore, no systematic uncertainties are assigned due to multiple interactions.
Propagation of the systematic uncertainties to the final results of the analysis is described in the following section.
8. Results
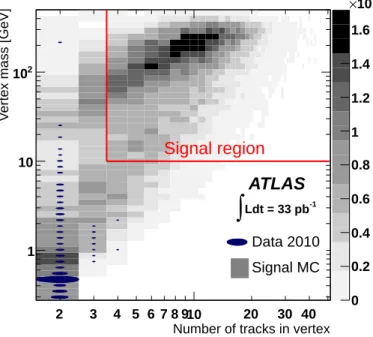
Figure 7 shows the distribution of mDV vs. NDVtrk for vertices in the selected data events, including vertices that fail the requirements onmDV andNDVtrk, overlaid with the signal distribution for the MH sample. We observe no events that satisfy all the selection criteria.
Number of tracks in vertex 2 3 4 5 6 7 8 910 20 30 40
Vertex mass [GeV]
1 10 102
0 0.2 0.4 0.6 0.8 1 1.2 1.4 1.6 10-3
×
ATLAS
Ldt = 33 pb-1
∫
Signal region
Data 2010 Signal MC
Figure 7: Vertex mass (mDV) vs. vertex track multiplicity (NDVtrk) for displaced vertices in events that pass the selection requirements except the mDV and NDVtrk requirements, which are not applied.
Shaded bins show the distribution for the signal MC MH sample (see Table 1), and data are shown as filled ellipses, with the area of the ellipse proportional to the number of vertices in the correspond- ing bin. The figure contains 487 data vertices, of which 251 are in the bin corresponding toKS0decays.
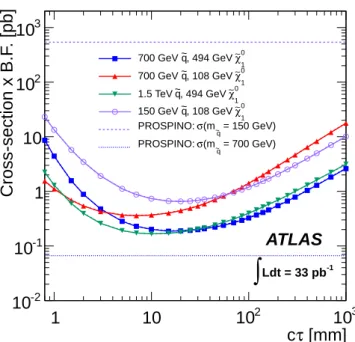
Based on this null observation, we set upper limits on the supersymmetry production cross-section σ times the branching fractionBof the complete simulated signal de- cay chain for different combinations of squark and neu- tralino masses and for different values of cτ, where τ is the neutralino lifetime.
The limits are determined in the following way. For each value ofcτ, we use the two-dimensional rapidity-vs.- velocity distribution of the generated neutralinos in each signal MC sample to produce a distribution of DV posi- tions with respect to the PV. This distribution is convolved with a Gaussian representing thezdistribution of the PV, and then multiplied by the 2-dimensional efficiency map for vertices in that signal MC sample, obtaining the ex- pected distribution of rDV vs. zDV. This distribution is generated separately for two cases. In the first case the reconstructed DV and muon originate from the same neu- tralino, and in the second they originate from different neutralinos. This allows us to correctly account for the muon-reconstruction efficiency for the desired value ofcτ, despite the fact that the signal MC is produced with a dif- ferent lifetime,cτMC. Integrating over therDVvs. zDVdis- tributions, we obtain the total efficiency for reconstructing at least one vertex and one muon in the event given our se- lection criteria and the value ofcτ. From the efficiency and luminosity, we obtain the expected average signal-event yield for any value of the signal production cross-section.
The expected background yield is taken to be zero with a conservative uncertainty of 0.03 events, which is the 90% CL upper limit on the background (see Section 6).
The upper limit on σB is then calculated using the CLs method [18], where signal-only and signal-plus-background p-values are evaluated using pseudo-experiments generated from distributions based on counting statistics. The un- certainties on luminosity, efficiency, and background are treated as nuisance parameters.
The systematic uncertainty on the track-reconstruction efficiency is taken into account in the limit calculation by use of the alternative efficiency functions described in Sec- tion 7. All other efficiency systematic uncertainties are used when converting the limit on the number of signal events to the limit onσB.
The resulting limits are shown in Figure 8, with the PROSPINO-calculated cross-sections for squark masses of 150 GeV and 700 GeV. Since no background is expected, the expected and observed limits are indistinguishable. In addition, based on the observation of no signal events in a data sample of 33 pb−1, we set a 95% confidence-level upper limit of 0.09 pb on the cross-section times the detec- tor acceptance times the reconstruction efficiency for any signal vertex.
9. Summary and conclusions
We have searched for new, heavy particles with life- times and velocities such that they decay at radial dis- tances between 4 mm and 180 mm from theppinteraction 7
[mm]
τ c
1 10 102 103
Cross-section x B.F. [pb]
10-2
10-1
1 10 102
103
0
χ∼1
, 494 GeV
~q 700 GeV
0
χ∼1
, 108 GeV
~q 700 GeV
0
χ∼1
, 494 GeV q~ 1.5 TeV
0
χ∼1
, 108 GeV
~q 150 GeV
= 150 GeV)
q~
σ(m PROSPINO:
= 700 GeV)
q~
σ(m PROSPINO:
ATLAS
Ldt = 33 pb-1
∫
Figure 8: Upper limits at 95% CL on the production cross-section times branching fraction vs. the neutralino lifetime times the speed of light for different combinations of squark and neutralino masses, based on the observation of zero events satisfying all criteria in a 33 pb−1 data sample. The horizontal lines show the cross-sections calculated from PROSPINO for squark masses of 700 GeV and 150 GeV.
point, in association with a high-transverse-momentum muon. Fewer than 0.03 background events are expected in the data sample of 33 pb−1, and no events are observed.
We present limits on the product of di-squark produc- tion cross-section and decay-chain branching fraction in a SUGRA scenario where the lightest neutralino produced in the primary-squark decay undergoes R-parity-violating decay into a muon and two quarks. Limits are reported as a function of the neutralino lifetime and for a range of neutralino masses and velocities, which are the factors with greatest impact on the limit. Limits for a variety of other models can thus be approximated from our results, based on the neutralino mass and velocity distribution in a given model.
10. Acknowledgements
We thank CERN for the very successful operation of the LHC, as well as the support staff from our institutions without whom ATLAS could not be operated efficiently.
We acknowledge the support of ANPCyT, Argentina;
YerPhI, Armenia; ARC, Australia; BMWF, Austria;
ANAS, Azerbaijan; SSTC, Belarus; CNPq and FAPESP, Brazil; NSERC, NRC and CFI, Canada; CERN; CON- ICYT, Chile; CAS, MOST and NSFC, China; COL- CIENCIAS, Colombia; MSMT CR, MPO CR and VSC CR, Czech Republic; DNRF, DNSRC and Lundbeck
Foundation, Denmark; ARTEMIS, European Union;
IN2P3-CNRS, CEA-DSM/IRFU, France; GNAS, Georgia;
BMBF, DFG, HGF, MPG and AvH Foundation, Ger- many; GSRT, Greece; ISF, MINERVA, GIF, DIP and Benoziyo Center, Israel; INFN, Italy; MEXT and JSPS, Japan; CNRST, Morocco; FOM and NWO, Netherlands;
RCN, Norway; MNiSW, Poland; GRICES and FCT, Por- tugal; MERYS (MECTS), Romania; MES of Russia and ROSATOM, Russian Federation; JINR; MSTD, Serbia;
MSSR, Slovakia; ARRS and MVZT, Slovenia; DST/NRF, South Africa; MICINN, Spain; SRC and Wallenberg Foundation, Sweden; SER, SNSF and Cantons of Bern and Geneva, Switzerland; NSC, Taiwan; TAEK, Turkey;
STFC, the Royal Society and Leverhulme Trust, United Kingdom; DOE and NSF, United States of America.
The crucial computing support from all WLCG part- ners is acknowledged gratefully, in particular from CERN and the ATLAS Tier-1 facilities at TRIUMF (Canada), NDGF (Denmark, Norway, Sweden), CC-IN2P3 (France), KIT/GridKA (Germany), INFN-CNAF (Italy), NL-T1 (Netherlands), PIC (Spain), ASGC (Taiwan), RAL (UK) and BNL (USA) and in the Tier-2 facilities worldwide.
References
[1] B. C. Allanachet al., Phys. Rev. D75, 035002 (2007) [arXiv:hep-ph/0609263].
[2] S. Dimopoulos, M. Dine, S. Raby and S. D. Thomas, Phys.
Rev. Lett.76, 3494 (1996) [arXiv:hep-ph/9601367].
[3] J. L. Hewett, B. Lillie, M. Masip and T. G. Rizzo, JHEP 0409, 070 (2004) [arXiv:hep-ph/0408248].
[4] M. J. Strassler and K. M. Zurek, Phys. Lett. B651, 374 (2007) [arXiv:hep-ph/0604261].
[5] P. Schuster, N. Toro and I. Yavin, Phys. Rev. D81, 016002 (2010) [arXiv:0910.1602 [hep-ph]].
[6] J. Fan, M. Reece, J. T. Ruderman, [arXiv:1105.5135 [hep-ph]].
[7] B. K. Zur, L. Mazzucato and Y. Oz, JHEP0810(2008) 099 [arXiv:0807.4543 [hep-ph]].
[8] The D0 Collaboration, V. M. Abazovet al., Phys. Rev. Lett.
97, 161802 (2006) [arXiv:hep-ex/0607028].
[9] The D0 Collaboration, V. M. Abazovet al., Phys. Rev. Lett.
103, 071801 (2009) [arXiv:0906.1787 [hep-ex]].
[10] The ATLAS Collaboration, JINST3, S08003 (2008).
[11] T. Sj¨ostrand, S. Mrenna, and P. Z. Skands, JHEP0605, 026 (2006) [hep-ph/0603175].
[12] S. Frixione and B. R. Webber, JHEP06029 (2002).
[13] W. Beenakker, R. Hopker, M. Spira, [hep-ph/9611232].
[14] The GEANT4 Collaboration, S. Agostinelliet al., Nucl.
Instrum. Meth. A506(2003).
[15] The ATLAS Collaboration, Eur. Phys. J.C70, 823-874 (2010). [arXiv:1005.4568 [physics.ins-det]].
[16] The ATLAS Collaboration, [arXiv:1110.6191 [hep-ex]].
[17] G. Aadet al.[ ATLAS Collaboration ], Eur. Phys. J.C71, 1630 (2011). [arXiv:1101.2185 [hep-ex]].
[18] A. L. Read, J. Phys.G28, 2693-2704 (2002).
![Table 1: Parameters of the four signal MC samples used in the analysis: the squark mass, production cross-section from PROSPINO [13], neutralino mass, average neutralino boost factor from PYTHIA [11], and average proper flight distance.](https://thumb-eu.123doks.com/thumbv2/1library_info/4025082.1542047/2.892.462.834.121.244/parameters-samples-analysis-production-prospino-neutralino-neutralino-distance.webp)