arXiv:1304.6386v3 [hep-ex] 16 Dec 2013
(Dated: October 9, 2018)
Using a sample of dilepton top-quark pair (t ¯t) candidate events, a study is performed of the production of top-quark pairs together with heavy-flavor (HF) quarks, t ¯t+ b + X or t ¯t + c + X , collectively referred to as t ¯t + HF. The dataset used corresponds to an integrated luminosity of 4.7 fb
−1of proton–proton collisions at a center- of-mass energy of 7 TeV recorded by the ATLAS detector at the CERN Large Hadron Collider. The presence of additional HF quarks in the t ¯t sample is inferred by looking for events with at least three b-tagged jets, where two are attributed to the b-quarks from the t ¯t decays and the third to additional HF production. The dominant background to t ¯t + HF in this sample is t ¯t + jet events in which a light-flavor jet is misidentified as a heavy- flavor jet. To determine the heavy- and light-flavor content of the additional b-tagged jets, a fit to the vertex mass distribution of b-tagged jets in the sample is performed. The result of the fit shows that 79 ± 14 (stat.) ± 22 (syst.) of the 105 selected extra b-tagged jets originate from HF quarks, three standard deviations away from the hypothesis of zero t ¯t + HF production. The result for extra HF production is quoted as a ratio (R
HF) of the cross section for t ¯t + HF production to the cross section for t ¯t production with at least one additional jet. Both cross sections are measured in a fiducial kinematic region within the ATLAS acceptance. R
HFis measured to be [6.2 ± 1.1(stat.) ± 1.8(syst.)]% for jets with p
T> 25 GeV and |η| < 2.5, in agreement with the expectations from Monte Carlo generators.
PACS numbers: 14.65.Ha, 14.65.Fy, 14.65.Dw, 14.80.Bn, 13.85.Qk
I. INTRODUCTION
In order to characterize the recently observed Higgs- like particle (H) [1, 2], quantities such as the Yukawa coupling of the top quark and the Higgs boson need to be measured with precision. For a Standard Model (SM) Higgs boson with a mass of 125 GeV, the de- cay mode with the largest branching ratio is H → b ¯b.
Thus, the channel with the largest yields for studying t ¯t+H production is t ¯t+ H, H → b ¯b. Production of top- quark pair (t ¯t) events featuring additional heavy-flavor (HF) b- and c-quarks, t ¯t + b + X and t ¯t + c + X , re- ferred to as t ¯t + HF, is the main irreducible background to t ¯t + H, H → b ¯b. A study of t ¯t + HF production is useful to constrain models of heavy-flavor quark pro- duction at the scale of the top-quark mass. This anal- ysis is also of interest because of the many potential phenomena beyond the SM, such as composite Higgs models [3] and processes leading to final states with four top quarks [4–9], that could produce additional heavy-flavor quarks in the t ¯t candidate sample.
This paper describes a study of t ¯t + HF production.
Within the SM, heavy-flavor quark pairs, c ¯ c and b ¯b, are expected to be produced in association with t ¯t mainly via gluon splitting from initial- and final-state radia- tion [10]. In addition, the heavy-flavor content of the proton could lead to t ¯t final states with at least one ad- ditional HF quark, t ¯t+ c and t ¯t + b. The data analyzed correspond to an integrated luminosity of 4.7 fb − 1 at a center-of-mass energy of √ s = 7 TeV produced at the Large Hadron Collider (LHC) and recorded in 2011 with the ATLAS detector.
This analysis is performed on t ¯t dilepton candidate events in which each top quark decays to a b-quark and a W boson, which subsequently decays to a neutrino and an isolated, charged lepton. The dilepton signature
is selected for this measurement because it is relatively background free and precludes a third b-tagged jet from a hadronically decaying W boson, predominantly via W → s ¯ c. The t ¯t + HF signal region is the subset of these events with three or more jets identified as containing HF quarks (b-tagged jets, or b-tags). However, jets without HF quarks may also be b-tagged, so that care must be taken to properly identify the flavor composi- tion of the b-tagged jets in the sample. Two b-tagged jets from each event are presumed to originate from the b-quarks from top-quark decays, t ¯t → W + bW − ¯b.
Therefore, all events in the signal region have at least one additional b-tag either from a b- or c-quark jet, or from a light-quark or gluon jet that was misidentified.
The latter are referred to as light-flavor or LF jets.
Due to limited data statistics and discrimination be- tween b- and c-jets, the sum of b-quark and c-quark jet rates is measured. Information about the composition of t ¯t+b +X and t ¯t+c +X in t ¯t+ HF is nevertheless re- quired for the total correction due to acceptance, which is different for b- and c-quark jets. The composition is estimated with Monte Carlo simulation and tested in the data.
From the measurement of the fraction of jets with heavy flavor content, the cross section for t ¯t produc- tion with at least one additional HF jet can be extracted.
To reduce some systematic uncertainties, the result is quoted as a ratio, termed R HF , of the cross section for t ¯t production with at least one additional HF jet to the cross section for t ¯t production with at least one addi- tional jet (t ¯t + j), regardless of flavor. The measure- ment of t ¯t+ j production is performed in dilepton t ¯t candidate events with at least three jets, at least two of which are b-tagged and assumed to come from top- quark decays.
The paper is organized as follows. The ATLAS
detector is briefly described in Sec. II. The data and Monte Carlo samples used in the analysis are described in Sec. III, followed by a description of the event se- lection in Sec. IV. The definition of the fiducial phase space used in the measurement of R HF , and the cal- culation of acceptances and efficiencies are presented in Sec. V. In Sec. VI, observed and expected num- bers of events with ≥ 3 b-tagged jets are shown. Sec- tion VII describes a fit to the vertex mass distribution of b-tagged jets in these data events to extract the fraction of HF jets produced in association with t ¯t. A discus- sion of the systematic uncertainties of the measurement is presented in Sec. VIII. Section IX shows the result of the measurements, followed by conclusions in Sec. X.
II. THE ATLAS DETECTOR
A detailed description of the ATLAS detector can be found elsewhere [11]. The innermost part of the detec- tor is a tracking system that is immersed in a 2 T ax- ial magnetic field and that measures the momentum of charged particles. The inner detector comprises a sili- con pixel detector, a silicon microstrip detector, and a transition radiation tracker, providing tracking capabil- ity within the pseudorapidity range | η | < 2.5 [12]. The tracking system is also used to identify the displaced secondary vertex that is formed by hadrons containing a b- or c-quark. Calorimeter systems, which measure the electron, photon, and hadron energies, reside out- side the inner detector and cover the region | η | < 4.9.
Outside the calorimeters there is a muon spectrome- ter that is used to identify and measure the momentum of muons in an azimuthal magnetic field in the region
| η | < 2.7. To reduce the data rate, a three-level trigger system selects the potentially interesting events that are recorded for offline analysis.
III. DATA AND MONTE CARLO SAMPLES The total integrated luminosity for the analyzed data sample is 4.7 fb − 1 at a center-of-mass energy of
√ s = 7 TeV. During the 2011 data-taking period the instantaneous luminosity of the LHC increased, caus- ing the average number of simultaneous inelastic pp in- teractions per beam crossing (pile-up) at the beginning of a pp fill to increase from about 6 to 17. Multiple pp interactions can occur either in the same bunch cross- ing as the primary vertex (termed ‘in-time pile-up’) or in an adjacent bunch crossing (termed ‘out-of-time pile-up’). To account for these effects, all Monte Carlo simulated events are overlaid with additional inelastic events generated with the P YTHIA AMBT1 tune [13], and the distribution of the number of vertices in the simulation is reweighted to match the distribution of
the number of additional interactions per bunch cross- ing measured in the data.
Monte Carlo simulation is used to study signal and background processes. Inclusive t ¯t production and dedicated t ¯t + HF samples are simulated us- ing the multi-leg matrix-element generator A LPGEN
v2.13 [14] with the CTEQ6L1 [15] parton distribution function (PDF) set. Parton showering and hadroniza- tion are performed by H ERWIG v6.520 [16]. Effects due to the mass of the heavy-flavor quarks are included by default in A LPGEN . In these samples, additional jets (including heavy-flavor) can also be produced in the parton shower. The MLM [14] parton–jet match- ing scheme is applied to avoid double counting of con- figurations generated by both the parton shower and the leading-order (LO) matrix-element (ME) calcula- tion. In addition, overlap between t ¯t events with HF quarks that originate from ME production and those that originate from the parton shower is removed. This heavy flavor overlap removal (HFOR) is based on the
∆R qq [17] between simulated HF quarks. The event is taken from the ME calculation if it contains two well separated HF quarks (∆R qq > 0.4). The event is taken from the parton shower calculation if it contains two collinear HF quarks (∆R qq < 0.4).
To study the effect of different fixed-order calcula- tions and matching schemes, samples of top-quark pair events are also generated using P OWHEG v1.01 and showered with H ERWIG . In this sample the t ¯t pro- cess is described at next-to-leading order (NLO), while the extra jets are described at LO. For each sample showered with H ERWIG , J IMMY v4.31 [18] and the AUET1 tune [19] are used to simulate the underlying event and to model various soft interactions. To assess the effect of different parton shower models, a sam- ple is generated using A LPGEN v2.14 with the P YTHIA
v6.425 [20] parton shower and hadronization, using the CTEQ5L PDF set [21]. The uncertainty associated with the CTEQ6L1 PDF set is evaluated with an enve- lope calculated using the uncertainty set from the NLO PDF MTSW2008nlo68cl [22], and an additional term to account for the difference between the central values of the LO and NLO calculations.
Initial- and final-state radiation (ISR/FSR) varia- tions are studied using samples generated with A C -
ER MC v2.0 [23] interfaced with P YTHIA v6.2. In these samples the parameters that control the amount of ISR/FSR are set to points consistent with the PE- RUGIA Hard/Soft tune [24] in a range constrained by current experimental data [25].
In all samples the top-quark mass is set to m t = 172.5 GeV. The cross section for Standard Model t ¯t production at this mass is calculated using the approxi- mate next-to-next-to-leading-order (NNLO) QCD cal- culation described in [26].
Background samples from the production of W and
Z bosons are generated using the CTEQ6L1 PDFs with
A LPGEN , which is interfaced to H ERWIG for parton showering and hadronization; the A LPGEN matrix ele- ments include diagrams with up to five additional par- tons. Separate samples of W +b ¯b and Z +b ¯b events are generated. The overlap between jets from the parton- shower and the matrix-element in the n and n + 1 jet multiplicity samples is removed for the W +jets and Z+jets samples in the same manner as for the t ¯t sam- ples. Single top-quark production is modeled using A CER MC in the t-channel and MC@NLO v3.41 [27]
for the W t- and s-channels. Diboson (WW , W Z, and ZZ) production is modeled using A LPGEN interfaced with H ERWIG . Less than 0.5% of the expected yield in the t ¯t + HF sample comes from the associated produc- tion of t ¯t +W /Z and t ¯t + H, and these processes are thus neglected in this analysis.
The resulting generated samples are passed through a G EANT 4 simulation [28] of the ATLAS detector [29].
Events are then reconstructed in the same manner as the data.
IV. EVENT SELECTION
Events for the analysis are selected by at least one of the high-p T [12] single-electron or single-muon trig- gers, as described in Refs. [30] and [31]. The single- electron triggers are based on calorimeter energy de- posits, shower shape, and matching track quality con- straints, while the single-muon triggers are based on a reconstructed track in the muon spectrometer that matches a track found in the inner detector. To ensure a final trigger rate that is compatible with the ATLAS data acquisition system, a minimum p T threshold for the electron and muon triggers is used. The p T thresh- old for the muon trigger is 18 GeV. For the electron trigger, the threshold is 20 GeV or 22 GeV, depending on the data-taking period due to varying LHC luminos- ity conditions.
The selected events are required to contain a recon- structed primary vertex with at least five associated tracks with p T > 0.4 GeV. Event reconstruction makes use of electrons (e), muons ( µ ), jets, and missing trans- verse momentum (E T miss ). Electrons are reconstructed by matching energy deposits in the electromagnetic calorimeter with tracks in the inner detector, and are required to have p T > 25 GeV and | η | < 2.47, exclud- ing the transition region between the barrel and end- cap calorimeters at 1.37< | η | <1.52 [32]. Muons are reconstructed by matching tracks in the inner detector with tracks measured in the muon spectrometer, and are required to have p T > 20 GeV and | η | < 2.5.
Tight isolation cuts are applied to both the electron and muon candidates to reduce the number of identified leptons (e, µ ) that come from non-prompt (non-W/Z) sources and from misidentified hadrons. For electrons, the E T deposited in the calorimeter cells in a cone in η -
φ space of radius ∆R = 0.2 around the electron position is summed, and the E T due to the electron is subtracted.
The scalar sum of track transverse momenta in a cone of ∆R = 0.3, excluding the electron, is also measured.
Cuts parametrized by the electron η and E T are made on these two isolation variables to ensure a constant efficiency over the entire ( η , E T ) range. For muons, the corresponding calorimeter isolation energy in a cone of ∆R = 0.2 is required to be less than 4 GeV, and the scalar sum of track transverse momenta in a cone of ∆R = 0.3 is required to be less than 2.5 GeV after subtraction of the muon p T .
Jets are reconstructed from clustered energy deposits in the calorimeters with the anti-k t [33] algorithm with a radius parameter R = 0.4 [34]. Jets selected for the analysis are required to have p T > 25 GeV and
| η | < 2.5. In order to reduce the background from jets originating from pile-up interactions, additional selec- tion criteria are applied to the fraction of the jet’s p T (JV F) carried by tracks originating from the primary vertex, JV F > 0.75.
The transverse momentum of neutrinos produced in the top-quark decays, measured as E T miss , is inferred by balancing the vector sum of all visible transverse mo- menta. Specifically, the E T miss is constructed from the vector sum of all calorimeter cell energies contained in topological clusters [34] with | η | < 4.5, projected onto the transverse plane. Contributions to the E T miss from the calorimeter cells associated with jets are taken at the corrected energy scale that is used for jets, while the contribution from cells associated with electrons is substituted by the calibrated transverse momentum of the electron. The contribution to the E T miss from the p T of muons passing the selection requirements is also in- cluded.
The b-tagging algorithm [35, 36] employed for this analysis uses impact parameter and vertex position measurements from tracks in the inner detector as in- puts to a neural network. The b-tagging efficiency was calibrated in a multi-jet data sample where at least one jet contains a muon [36]. The c-tagging efficiency was calibrated in a data sample with reconstructed D ∗ mesons [37]. For this analysis, b-tagged jets are re- quired to satisfy a selection that is 75% efficient for b-quark jets, approximately 30% efficient for c-quark jets, and rejects light-flavor jets by a factor of approxi- mately 35 in simulated t ¯t events. In this paper, a ‘b-tag’
(or a ‘b-tagged jet’) refers to any jet passing this selec- tion, regardless of flavor. A ‘b-jet’, by contrast, refers to a jet (which may or may not be b-tagged) which con- tains a b-quark. Similarly, ‘c-jet’ and ‘HF jet’ are state- ments of the flavor composition of the jet, not whether the jet is b-tagged. Three distinct subsets of the se- lected b-tagged jets with different b-jet purity are used in the measurement of σ fid (t ¯t + HF), as described in Sec. VII.
Dilepton t ¯t candidate events are selected by requir-
Jet multiplicity
2 3 4 5 6 7 8
Events
10-1
1 10 102
103
104
105
106
Data tt with no HF Single top Z+jets WW/WZ/ZZ Fake leptons tt + HF Syst. unc.
L dt = 4.7 fb-1
∫
ATLAS = 7 TeV sJet multiplicity
2 3 4 5 6 7 8
Data/MC 00.51 1.52
(a)Zero b-tagged jets
Jet multiplicity
2 3 4 5 6 7 8
Events
10-1
1 10 102
103
104
105
106 Data
tt with no HF Single top Z+jets WW/WZ/ZZ Fake leptons tt + HF Syst. unc.
L dt = 4.7 fb-1
∫
ATLAS = 7 TeV sJet multiplicity
2 3 4 5 6 7 8
Data/MC 00.51 1.52
(b)One b-tagged jet
Jet multiplicity
2 3 4 5 6 7 8
Events
10-1
1 10 102
103
104
105
106 Data
tt with no HF Single top Z+jets WW/WZ/ZZ Fake leptons tt + HF Syst. unc.
L dt = 4.7 fb-1
∫
ATLAS = 7 TeV sJet multiplicity
2 3 4 5 6 7 8
Data/MC 00.51 1.52
(c)Two b-tagged jets
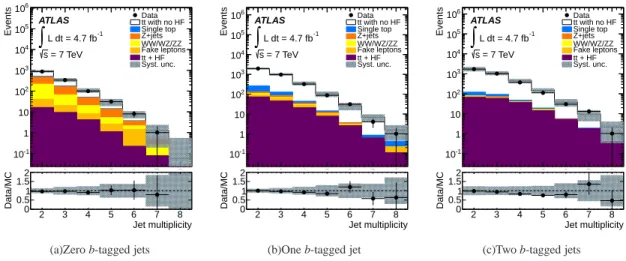
FIG. 1: Jet multiplicity distributions in dilepton t ¯t candidate events with (a) zero, (b) one, or (c) two b-tagged jets for the sum of ee, µµ and e µ channels. The lower plots show the ratio between the data and the Monte Carlo predictions in each bin.
Uncertainties are statistical and systematic. The last bin contains any overflow.
ing exactly two opposite-sign leptons and at least two jets. To reduce the background from Z/ γ ∗ processes, events with like-flavor leptons are required to have E T miss above 60 GeV and a dilepton invariant mass sat- isfying | m ℓ
+ℓ
−− m Z | > 10 GeV. For events with one electron and one muon, the scalar sum of the lepton and jet transverse momenta is required to be above 130 GeV to reduce the backgrounds from Z/ γ ∗ → τ + τ − , as well as WW , W Z, and ZZ processes. This set of selection criteria is termed the ‘nominal’ t ¯t selec- tion criteria. The measurement of t ¯t + HF production is carried out in the subset of these events that contain three or more b-tagged jets, whereas the measurement of t ¯t production with at least one additional jet is per- formed in the subset with at least three jets, at least two of which are b-tagged.
Using the nominal selection criteria described above, data and Monte Carlo events are compared in three control regions: dilepton t ¯t candidate events with zero, one, or two b-tagged jets. Data-to-simulation normal- ization corrections are applied to Monte Carlo simula- tion samples when calculating acceptances to account for observed differences in predicted and observed trig- ger and lepton reconstruction efficiencies, jet flavor tagging efficiencies and mistag rates, as well as jet and lepton energy scales and resolutions. In Fig. 1, the jet multiplicity distributions in the three regions are com- pared to Monte Carlo predictions. Agreement is ob- served within uncertainties.
V. DEFINITION OF THE FIDUCIAL PHASE SPACE AND CALCULATION OF CORRECTION FACTORS
To allow comparison of the analysis results to the- oretical predictions, the measurement is made within
a fiducial phase space. The fiducial volume is de- fined in Monte Carlo simulation by requiring two lep- tons (e, µ ) from the t → W b → ℓ ν b decays (includ- ing electrons and muons coming from τ → ℓ νν τ ) with p T > 25 (20) GeV for e ( µ ), and | η | < 2.5 as well as three or more jets with p T > 25 GeV and | η | < 2.5.
In the simulation, jets are formed by considering all particles with a lifetime longer than 10 ps, excluding muons and neutrinos. Particles arising from pile-up in- teractions are not considered. For the determination of the t ¯t + HF fiducial cross section, σ fid (t ¯t+ HF), three or more jets are required to match a b- or c-quark, two of which must match a b-quark from top-quark decay.
All simulated b- and c-quarks that were generated with p T > 5 GeV are considered for the matching, and are required to satisfy ∆R(quark, jet) < 0.25. Jets that match both a b- and a c-quark are considered as b-jets.
For the calculation of σ fid (t ¯t+ j) three or more jets are required, two of which must contain a b-quark from top-quark decay.
Each fiducial cross section is determined using mea- sured quantities from the data, and a correction factor derived from the Monte Carlo simulation. The ratio of cross sections is defined as:
R HF = σ fid (t ¯t+HF) σ fid (t ¯t+ j)
The fiducial cross section for t ¯t + HF production is de- termined from:
σ fid (t ¯t+ HF) = N HF R L dt · ε HF
; (1)
where N HF is the number, after background subtraction,
of b-tags from HF jets observed in the data, in addition
to the two b-jets from top-quark decays. The integrated luminosity of the sample is denoted as R L dt, and ε HF
is a correction factor taken from Monte Carlo simula- tion that converts the number of observed b-tags from additional HF jets to the number of events in the signal fiducial volume. This correction factor includes the ac- ceptance within the fiducial region, the reconstruction efficiency, and a factor to account for the multiplicity of extra b-tagged HF jets per t ¯t+HF event in the signal region. This correction factor is different for t ¯t + b + X ( ε b ) and t ¯t + c+ X ( ε c ), and thus ε HF is determined as a weighted sum of these two contributions. The weight used to form the sum is the fraction of t ¯t + HF events in the fiducial volume which contain additional b-jets as opposed to c-jets. This fraction is termed F b/HF . The total correction factor ( ε HF ) is calculated as:
ε HF = F b/HF · ε b + (1 − F b/HF ) · ε c
The denominator for R HF , σ fid (t ¯t+ j), is computed us- ing a similar prescription:
σ fid (t ¯t+ j) = N j R L dt · ε j
; (2)
where N j is the yield of dilepton events in data with at least three jets, at least two of which are b-tagged, and ε j is the t ¯t + j acceptance factor calculated from the Monte Carlo simulation. The acceptance calculation for each fiducial cross section assumes that all b-tagged jets are from real HF quarks. Events with b-tagged jets from LF quarks are treated as a background, and sub- tracted when computing both N HF and N j .
The A LPGEN + H ERWIG Monte Carlo sample pre- dicts ε b = 0.19, ε c = 0.06, and F b/HF = 0.31. The total correction factor is thus predicted to be ε HF = 0.106 ± 0.005 (stat.) for σ fid (t ¯t+ HF). For σ fid (t ¯t + j) the ac- ceptance factor is calculated to be ε j = 0.129 ± 0.001 (stat.).
The prediction for R HF from the A LPGEN + H ER -
WIG Monte Carlo sample is 3.4%. The value ob- tained from the P OWHEG v1.01 [38] generator show- ered with H ERWIG [16] is R HF = 5.2%, with F b/HF = 0.34. While this R HF value is different to that from A LPGEN + H ERWIG , the predicted F b/HF values are similar. Furthermore, a parton-level study using M AD - G RAPH 5 v1.47 [39] gives F b/HF = 0.29. The value of F b/HF is also stable when different showering algo- rithms are used: the A LPGEN + P YTHIA Monte Carlo sample predicts a value of F b/HF = 0.32, in good agree- ment with the prediction when H ERWIG is used. Based on comparison of these predictions for F b/HF , a sym- metric 10% Monte Carlo systematic uncertainty is as- signed, F b/HF = 0.31 ± 0.03. The prediction of F b/HF is also tested in data (see Sec. IX).
VI. EXPECTED SIGNAL AND BACKGROUND YIELDS
Table I shows the number of events with ≥ 3 b- tagged jets expected in the Monte Carlo simulation from dilepton t ¯t production and from various back- ground sources. At this point, no distinction is made between events with a true additional HF jet and those containing a mistagged LF jet. The number of observed events is also shown. While Monte Carlo simulation is used to estimate t ¯t + HF event rates and kinematic fea- tures, data-driven methods and Monte Carlo simulation are both used to estimate background processes, as de- tailed below.
Background processes containing real b-jets and lep- tons, such as single top-quark, Z / γ ∗ + jets, and diboson (WW , W Z, and ZZ) production, are estimated using Monte Carlo simulation. Contributions from diboson production are found to be negligible.
A major source of background comes from t ¯t events in which one or more of the b-tagged jets is from a mistagged LF jet. This background is estimated us- ing Monte Carlo simulation for the measurement of σ fid (t ¯t + j). However, in the measurement of σ fid (t ¯t + HF), the final t ¯t + LF background is determined by a fit to the vertex mass distribution of b-tagged jets in data, as explained in Sec. VII.
Background from events in which at least one of the leptons is either non-prompt (originating from e.g. a photon conversion or b-quark decay) or is a misiden- tified hadron, is estimated using data and Monte Carlo simulation. For instance, W + jets, multi-jet, and t ¯t events with one hadronically decaying W boson can contribute in this way. This contribution is deter- mined by scaling the yield of events in the data with a pair of same-sign leptons by the ratio of opposite- sign to same-sign yields (R OS/SS ) obtained in Monte Carlo simulation. The opposite-sign to same-sign ratio is determined separately for the three dilepton chan- nels, and found to be 1.3 ± 0.1 (stat.) +1.8 − 1.3 (syst.) for e + e − events, 1.2 ± 0.1 (stat.) ± 0.7 (syst.) for µ + µ − events, and 1.2 ± 0.1 (stat.) ± 0.5 (syst.) for events with one electron and one muon. The system- atic uncertainty takes into account the unknown relative mixture of fake-lepton sources (photon conversions, b- and c-hadron decays, or misidentified hadrons) in the R OS/SS calculation. Since the central value of the pre- diction for this background is zero events, only varia- tions in R OS/SS that lead to larger background predic- tions are considered in the systematic uncertainty cal- culation. This method for estimating the background due to events with fake leptons is validated in a control sample of dilepton events with less restrictive lepton identification requirements and no isolation criteria.
The dominant uncertainties on the total yield in Ta-
ble I come from the jet energy scale, b-tagging effi-
ciency, parton showering model, and initial- and final-
TABLE I: Observed and expected number of events in the signal region (i.e. with ≥ 3 b-tagged jets). Uncertainties on individual components are statistical only. For the total ex- pectation, systematic uncertainties are included.
Process Number of events
t ¯t 106.7 ± 3.4
Single top 2.2 ± 0.5
Z + jets 0.2 ± 0.1
Fake leptons 0
+5−0Total expectation 109
+6−3(stat.) ± 35 (syst.)
Data 106
state radiation.
VII. TEMPLATE FIT
For the measurement of σ fid (t ¯t + HF), the fraction of heavy-flavor jets produced in association with t ¯t is extracted by performing a binned maximum-likelihood fit on the displaced-vertex mass distribution using all b-tagged jets in the events with ≥ 3 b-tagged jets. Al- though the final result is for both flavors combined, the fit includes separate b- and c-quark components to improve the determination of the LF fraction, and to test the Monte Carlo prediction for F b/HF , which is used for the calculation of the correction factor de- scribed in Sec. V. This displaced-vertex mass is con- structed from the inner detector tracks associated with the secondary vertex using the algorithm described in Ref. [40]. While the presence of a displaced vertex is an indication that a jet contains a b-quark, a jet may be b-tagged even if no vertex is reconstructed. In this case, the vertex mass is undefined. These jets are assigned a mass value of ‘ − 1 GeV’ and they are included in the fit to the displaced-vertex mass distribution. Keeping the events without a reconstructed vertex improves the dis- crimination between heavy-flavor and light-flavor jets.
While the vertex mass is a powerful discriminant, Monte Carlo studies indicate that the sensitivity on the fitted fraction of LF jets increases when the jet p T is used as an additional discriminant. Considering only the statistical uncertainty, it is seen that a fit with both jet p T and vertex mass is approximately half a standard deviation more sensitive than a fit with only the vertex mass. It was thus decided to define a two-dimensional probability density function, termed a ‘template,’ for the fit using the vertex mass and jet p T .
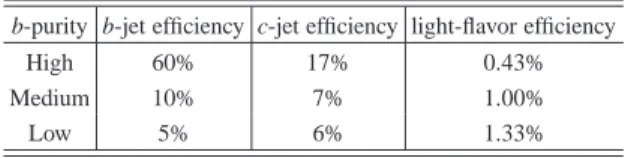
The fit is performed simultaneously in three mutu- ally exclusive bins of b-jet purity, defined by different ranges of the b-tagging neural network output value.
Certain values of the neural network output, termed
‘operating points’, are defined by the average b-jet se- lection efficiency resulting from the applied selection.
TABLE II: Summary of the b-tagging efficiencies for b-jets, c-jets, and light-flavor jets for the three mutually exclusive b-tagging selections used in the vertex mass template fit.
b-purity b-jet efficiency c-jet efficiency light-flavor efficiency
High 60% 17% 0.43%
Medium 10% 7% 1.00%
Low 5% 6% 1.33%
In this analysis, operating points of 60%, 70% and 75%
efficiency are used to define the boundaries of the b-jet purity bins.
The first bin uses only the tightest calibrated oper- ating point (60%), contains the highest-purity sample of b-jets (referred to as ‘high purity’), and has a b- tagging efficiency of 60% for b-jets. The second bin (referred to as ‘medium purity’) requires a b-tag selec- tion between the tightest and second tightest (70%) op- erating points, and contains a larger fraction of LF jets and c-jets. The efficiency for this bin is 10% for b-jets, i.e. the difference between the 70% and 60% operat- ing points. The final bin (‘low purity’) requires a b-tag selection between the second (70%) and third operat- ing point (75%), and contains the largest fraction of LF jets. The efficiency for this bin is 5% for b-jets. The b-tagging efficiencies for b-jets, c-jets, and light-flavor jets for each selection are given in Table II.
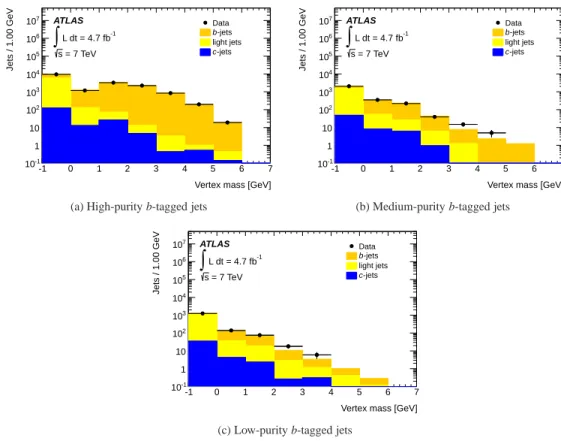
All three classes of b-tag purity are used in the anal- ysis so that a jet is considered ‘b-tagged’ if it satisfies any of these criteria. The discrimination power be- tween LF and c-jets is greatly improved by using three (as opposed to one) classes of b-purity. The vertex mass distributions for all b-tagged jets in events pass- ing the nominal t ¯t selection criteria are shown in Fig. 2 to confirm that (a) the data are well described by the Monte Carlo simulation, (b) and the b-jet, c-jet and LF- jet fractions are different in the three purity selections.
For the purpose of illustration, the normalization of the b-jet, c-jet, and LF-jet components is taken from Monte Carlo simulation.
The template fit has five components: b-jets from
top-quark decays, non-t ¯t background, extra b-tagged
jets from b-quarks, extra b-tagged jets from c-quarks,
and light-flavor b-tagged jets. The template for b-jets
from top-quark decays is obtained from the data in t ¯t
dilepton events with exactly two b-tags. Monte Carlo
simulation indicates that 97% of b-tagged jets in t ¯t
dilepton events with exactly two b-tags come from the
decay of the top quark. To account for this in the shape
of the data template, a template for b-tags not from the
top-quark decays is derived from the t ¯t Monte Carlo
simulation, and subtracted with a 3% relative normal-
ization from the data template. In the fit, the normal-
ization for the template for b-jets from the top-quark
decays is fixed assuming it contributes two of the three
or more b-tags per observed event.
Vertex mass [GeV]
-1 0 1 2 3 4 5 6 7
Jets / 1.00 GeV
10-1
1 10 102
103
104
105
106
107 Data
-jets b light jets
-jets c L dt = 4.7 fb-1
∫
ATLAS = 7 TeV s(a) High-purity b-tagged jets
Vertex mass [GeV]
-1 0 1 2 3 4 5 6 7
Jets / 1.00 GeV
10-1
1 10 102
103
104
105
106
107 Data
-jets b light jets
-jets c L dt = 4.7 fb-1
∫
ATLAS = 7 TeV s(b) Medium-purity b-tagged jets
Vertex mass [GeV]
-1 0 1 2 3 4 5 6 7
Jets / 1.00 GeV
10-1
1 10 102
103
104
105
106
107 Data
-jets b light jets
-jets c L dt = 4.7 fb-1
∫
ATLAS = 7 TeV s(c) Low-purity b-tagged jets
FIG. 2: Vertex mass distributions for all b-tagged jets in data events satisfying the nominal dilepton t ¯t event selection, with no requirement on b-tagged jet multiplicity, compared to Monte Carlo predictions. By definition, jets with no reconstructed secondary decay vertex are assigned to the ‘ − 1 GeV’ bin.
Background events from non-dilepton t ¯t processes are included using Monte Carlo simulation, and enter the fit with a fixed normalization. Monte Carlo simu- lation is used to obtain templates for additional (non- t → W b) b-jets, c-jets, and LF jets.
In the fit to determine the number of b-tags from HF jets in addition to the two b-jets from top-quark decay, N HF , separate templates for each category of jet in each of the three purity classes (high, medium, and low) are used. The b-tagging efficiencies (Table II) for each fla- vor of jet are used to relate the number of jets in each purity bin. After the application of all constraints, the fit has two floating parameters: the fraction of LF jets and the fraction of additional b-jets. The fraction of additional c-jets makes up the remainder.
Monte Carlo pseudo-experiments show that the fit- ting method is unbiased in both best-fit values and es- timated uncertainties. The fit strategy (including esti- mates of statistical and systematic uncertainties) was verified using 10% of the full data sample as well as with Monte Carlo pseudo-experiments before the fit was performed on the full data sample. These studies indicated that the fit could achieve only a 1 σ separation of b- vs. c- jets based on the expected statistical uncer- tainty alone. Inclusion of the systematic uncertainty would further reduce the sensitivity. However, the LF-
jet fraction is expected to be measured with sufficient precision to give a statistically significant measurement of the total HF content, defined as the fraction of addi- tional b-tagged jets not coming from LF jets. In the fit, the individual fractions are not constrained to be posi- tive or below unity.
VIII. SYSTEMATIC UNCERTAINTIES Systematic uncertainties may affect the shape of the vertex mass and p T templates as well as the acceptance calculations. For the systematic uncertainties on the template shapes, the fit to the data is re-evaluated using new templates, derived by varying the relevant param- eters by their systematic uncertainties, and a new fit to the data is performed. Major uncertainties that af- fect the fit are the jet energy scale and resolution, the tagging efficiencies for b-, c- and LF jets, the parton- shower and hadronization models, and the Monte Carlo event generators.
The template for b-jets from top-quark decays is
nominally taken from the data with exactly two b-
tags. To account for kinematic biases due to additional
heavy-flavor jets in the event, a systematic uncertainty
on the shape of this template is assessed using b-jets
from top-quark decays from Monte Carlo inclusive t ¯t events with three or more b-tagged jets.
The vertex mass of additional b- and c-jets is sen- sitive to the number of HF quarks contained in a jet (for instance, for b ¯b or c ¯ c produced via gluon splitting).
The dominant uncertainty from this effect would mani- fest itself as a difference in the shape of the template for additional b-jets. To assess this uncertainty, the tem- plate for additional b-jets is replaced by the template for b-jets from top-quark decays.
By default, the normalization of the template for b-jets from top-quark decays is fixed to two per event. A systematic uncertainty on this normalization is assessed by using the predicted normalization from Monte Carlo simulation, which includes events with less than two b-tags from top-quark decays, due to b- tagging inefficiency. The total uncertainty due to spe- cific template shape variations is referred to as ‘addi- tional fit uncertainties’ for the rest of this paper.
Systematic uncertainties also affect the overall event reconstruction efficiency. Dominant sources of uncer- tainty for this category are: the tagging effiencies for b-, c- and LF jets, the jet energy scale and resolution, and the Monte Carlo event generator. Uncertainties on the lepton identification efficiency, E T miss reconstruc- tion, and fragmentation modeling are negligible. In general, systematic uncertainties are evaluated on the full data sample, with each uncertainty being taken as the difference between the nominal and the varied re- sulting values of R HF .
An important uncertainty in this analysis comes from the flavor composition in the fiducial volume, namely in the value of F b/HF , the fraction of t ¯t + HF events in the fiducial volume which contain b-jets, used to calculate the correction factor ε HF . As described in Sec. V, an uncertainty of 10% on F b/HF is estimated using different Monte Carlo generators. It is possible to evaluate F b/HF using the data, but with the present data set, significant discrimination between b- and c- jets is not possible, making such a comparison of lim- ited use. Nonetheless, the result of this study is pre- sented as a point of comparison to the result obtained from the Monte Carlo.
IX. RESULTS
In the 106 events in the signal sample (with ≥ 3 b- tagged jets), there are 325 b-tagged jets. After subtract- ing the non-t ¯t background component, and the contri- bution from the tagged jets from the t → W b decay, the number of additional b-tags is found to be 105. As de- scribed in Sec. VII, a template fit to all b-tagged jets is performed to determine the flavor composition of these additional b-tagged jets. The result of the fit to all 325 b-tagged jets is shown in Fig. 3. The weighted sums of all fit templates are shown, with contributions for extra
Tagged jet vertex mass category
No sec. vertexLow massHigh massNo sec. vertexLow massHigh massNo sec. vertexLow massHigh mass
Jets / bin
10-1
1 10 102
103
104
105
Data Combined fit Heavy flavor Light flavor L dt = 4.7 fb-1
∫
ATLAS = 7 TeV sHigh purity Medium purity Low purity
FIG. 3: The result of the template fit (solid line) to the ver- tex mass distribution in data (points). Data are divided into three groups depending on the purity of b-jets passing each selection, as described in the text. The first three bins are the vertex mass distributions for the high-purity b-tags, the middle three bins for the medium-purity b-tags, and the last three bins for the low-purity b-tags. Within each purity cat- egory, the first bin contains jets with no reconstructed sec- ondary vertex. The middle bin contains jets with ‘low’ mass:
less than 2 GeV. The third bin contains jets with ‘high’ mass:
greater than 2 GeV. The best fit is shown as a sum (labeled as ‘Combined fit’, which includes the b-jets from top-quark decay) with separate contributions from additional b- and c- jets (labeled as ‘Heavy flavor’), and LF jets (labeled as ‘Light flavor’).
TABLE III: Relative composition of b-tagged jets in the sig- nal region, fitted in data and compared to the expectation from Monte Carlo (MC) simulation. In data, the fractions of LF and additional b-jets are determined by the fit. The fraction of b-jets from top-quark decays is fixed in the fit to two b-tags in each event. The contributions from t ¯t events with a fake lepton, or non-t ¯t events are fixed in the fit using the Monte Carlo simulation (those are labeled as ‘b-jets from other sources’ in the table). The fraction of c-jets is inferred from unitarity. All quoted errors are statistical.
Type of b-tag, fractions Data fit MC expectation Additional LF jets, % 8 ± 4 20
Additional b-jets, % − 2 ± 7 9 Additional c-jets, % 26 ± 8 3.5
b-jets from t → W b, % 65 –
b-jets from other sources, % 2.5 –
HF and mistagged LF jets shown separately. The fitted fractions of b-tags from LF jets and additional b-jets are given in Table III. Of the 105 additional b-tags, 79
± 14 (stat.) ± 22 (syst.) are attributed to HF jets. A detailed breakdown of the systematic uncertainties on the total number of HF jets is shown in Table IV.
Using Eq. 1, the number of HF jets observed in
data, and the quoted correction factor ε HF derived from
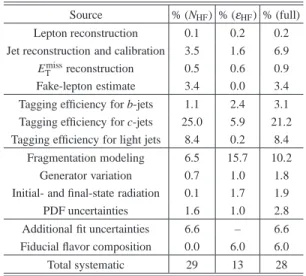
TABLE IV: Summary of systematic uncertainties (in %) on the measurement of the ratio of fiducial cross sections, R
HF. Uncertainties are quoted separately for the number of HF jets measured in the fit (N
HF), the portion of the calculation af- fecting only the correction factors (ε
HF), and the full calcu- lation. As the fit prefers 100% charm for additional heavy- flavor jets, it is sensitive to differences in the extra b-tagged jets from the c-quark template shape.
Source % (N
HF) % ( ε
HF) % (full) Lepton reconstruction 0.1 0.2 0.2 Jet reconstruction and calibration 3.5 1.6 6.9 E
Tmissreconstruction 0.5 0.6 0.9 Fake-lepton estimate 3.4 0.0 3.4 Tagging efficiency for b-jets 1.1 2.4 3.1 Tagging efficiency for c-jets 25.0 5.9 21.2 Tagging efficiency for light jets 8.4 0.2 8.4
Fragmentation modeling 6.5 15.7 10.2 Generator variation 0.7 1.0 1.8 Initial- and final-state radiation 0.1 1.7 1.9 PDF uncertainties 1.6 1.0 2.8 Additional fit uncertainties 6.6 – 6.6 Fiducial flavor composition 0.0 6.0 6.0
Total systematic 29 13 28
the Monte Carlo simulation for t ¯t + HF production, σ fid (t ¯t + HF) is found to be 0.16 ± 0.03 (stat.) pb.
A LPGEN interfaced with H ERWIG predicts a value of 0.10 pb.
The uncertainty on the fitted fraction of light-flavor jets is significantly smaller than the uncertainty on the fitted fraction of additional b-jets. This is understood as an effect of fitting in multiple b-purity bins: the low- purity bin is dominated by light-flavor jets and thus gives improved discrimination. The data resolve the total observed HF production rate with a significance of about 3 σ .
In the data, 1656 t ¯t dilepton candidate events are ob- served with at least three jets, at least two of which are b-tagged. The total background estimate, which is dominated by LF jets misidentified as b-jets from top- quark decay, is found to be 112 ± 4 (stat.), leading to a background subtracted yield of 1544 ± 41 (stat.).
Using Eq. 2, and the quoted acceptance factor for t ¯t+ j production, σ fid (t ¯t+ j) is found to be 2.55 ± 0.07 (stat.) pb, compared to 2.83 pb predicted by A LPGEN and H ERWIG . Taking into account the total uncertainty, it is found that R HF = [6.2 ± 1.1 (stat.) ± 1.8 (syst.)]%.
A full breakdown of the systematic uncertainties con- tributing to R HF is given in Table IV.
The extracted value of σ fid (t ¯t + HF) is very sensi- tive to the value of F b/HF . As indicated in Sec. V, the efficiency for t ¯t + b + X events is approximately a fac- tor of three higher than the corresponding efficiency for t ¯t+c +X events, implying a potential change in σ fid (t ¯t + HF) by a factor of three if F b/HF is allowed to vary
/HF
Fb
0 0.2 0.4 0.6 0.8 1
HFR
0.04 0.06 0.08 0.1 0.12 0.14 0.16 0.18 0.2
RHF (ALPGEN) /HF Fb
(ALPGEN), 1 sigma /HF
Fb
(data) /HF Fitted Fb
, 1 sigma /HF Fitted Fb
, 2 sigma /HF Fitted Fb
L dt = 4.7 fb-1