arXiv:1305.4192v2 [hep-ex] 22 May 2013
EUROPEAN ORGANISATION FOR NUCLEAR RESEARCH (CERN)
CERN-PH-EP-2012-064
Submitted to: PLB
Measurement of the high-mass Drell–Yan differential cross-section in
pp
collisions at√
s = 7
TeV with the ATLAS detectorThe ATLAS Collaboration
Abstract
This Letter reports a measurement of the high-mass Drell–Yan differential cross-section in proton- proton collisions at a centre-of-mass energy of 7 TeV at the LHC. Based on an integrated luminosity of 4.9 fb−1, the differential cross-section in the Z/γ∗ → e+e− channel is measured with the ATLAS detector as a function of the invariant mass,mee, in the range116 < mee < 1500 GeV, for a fiducial region in which both the electron and the positron have transverse momentum pT > 25 GeV and pseudorapidity|η|<2.5. A comparison is made to various event generators and to the predictions of perturbative QCD calculations at next-to-next-to-leading order.
Measurement of the high-mass Drell–Yan differential cross-section in pp collisions at
√s = 7 TeV with the ATLAS detector
The ATLAS collaboration
Abstract
This Letter reports a measurement of the high-mass Drell–Yan differential cross-section in proton-proton collisions at a centre-of-mass energy of 7 TeV at the LHC. Based on an integrated luminosity of 4.9 fb−1, the differential cross-section in theZ/γ∗→e+e− channel is measured with the ATLAS detector as a function of the invariant mass,mee, in the range 116< mee <1500 GeV, for a fiducial region in which both the electron and the positron have transverse momentum pT>25 GeV and pseudorapidity|η|<2.5. A comparison is made to various event generators and to the predictions of perturbative QCD calculations at next-to-next-to-leading order.
Keywords:
1. Introduction
At hadron colliders, the Drell–Yan (DY) process [1], proceeding at tree level via the s-channel exchange of a virtual photon or Z boson, can produce e+e− pairs over a wide range of invariant mass, mee. The differ- ential cross-section dσ/dmee is described by perturbative QCD (pQCD) calculations at next-to-next-to-leading or- der (NNLO). Given the simple experimental signature and the low backgrounds, a small experimental uncertainty can be achieved on the measuredmee distribution that allows for a precision test of pQCD. The mass spectrum is also sensitive to the parton distribution functions (PDFs), in particular to the poorly known distribution of antiquarks at large x[2], where x can be interpreted, at leading or- der, as the fraction of the proton momentum carried by the interacting parton. Additionally, the production of DY e+e− pairs is a source of background for other Stan- dard Model (SM) measurements, and the mass spectrum may be modified by new physics phenomena.
The differential cross-section for DYe+e− pair produc- tion in the high-mass range has been reported previously by the CMS [3], CDF [4] and D0 [5] collaborations. With the ATLAS detector, total and differential cross-sections in a mass window of 66< mee<116 GeV have been mea- sured using the 2010 dataset [6]. In addition, searches for new physics in the high-mass range of the mee distribu- tion have been performed [7, 8, 9] and no deviations from the SM expectation were observed. This Letter reports an extension of these previous analyses by providing a mea- surement of the DY cross-section, fully corrected for detec- tor effects, as a function of the e+e−invariant mass up to 1500 GeV. The cross-section is reported in a phase space slightly extended with respect to the fiducial acceptance of thee+ande−. The results are compared to NNLO pQCD
calculations with next-to-leading-order (NLO) electroweak corrections from theFEWZ 3.1[10, 11] framework and to the predictions from three event generators.
2. The ATLAS detector
The ATLAS detector is described in detail in Ref. [12].
The two systems most relevant to this analysis are the inner tracking detector, surrounded by a superconduct- ing solenoid providing a 2 T axial magnetic field, and the calorimeter. Charged-particle tracks and vertices are re- constructed with silicon pixel and microstrip detectors cov- ering the pseudorapidity1range|η|<2.5 and a straw-tube transition-radiation tracker covering|η|<2.0. Within the region |η| < 3.2, electromagnetic calorimetry is provided by barrel and endcap detectors consisting of lead absorbers and liquid argon (LAr) as the active material, with fine lat- eral and longitudinal segmentation within|η| <2.5. The hadronic calorimeter is based on steel/scintillator tiles in the central region (|η| < 1.7) while the hadronic endcap calorimeters (1.5<|η|<3.2) use copper/LAr.
A three-level trigger system is used to select events. The first level is implemented in custom electronics and is fol- lowed by two software-based trigger levels. In 2011 the total output rate of events recorded for physics analysis was 200–300 Hz.
1ATLAS uses a right-handed coordinate system with its origin at the nominal interaction point in the centre of the detector and thez-axis coinciding with the axis of the beam pipe. The x-axis points from the interaction point to the centre of the LHC ring, and they-axis points upward. The pseudorapidity is defined in terms of the polar angleθ as η =−ln tan(θ/2), and φis the azimuthal angle around the beam pipe with respect to thex-axis. The angular distance is defined as ∆R=p
(∆η)2+ (∆φ)2. Transverse momen- tum and energy are defined aspT=p×sinθandET=E×sinθ, respectively.
3. Simulated samples
Simulated data samples were generated in order to esti- mate backgrounds and correct the signal for the detec- tor resolution, efficiency and acceptance. The PYTHIA 6.426[13] andMC@NLO 4.02[14] Monte Carlo (MC) gen- erators were used to model the DY signal. In addition, SHERPA 1.3.1 [15] was used to produce signal samples with up to three additional partons, and the final result of the analysis is compared to the generator-level predictions from all three programs. MC@NLO was also used to simu- late the t¯tbackground, whileHERWIG 6.520[16] was used for the diboson (W W,W Z or ZZ) backgrounds. MC@NLO was interfaced to HERWIG to model parton showers and fragmentation processes, and to JIMMY 4.31[17] for un- derlying event simulation. All event generators were in- terfaced to PHOTOS 3.0 [18] to simulate QED final-state radiation (FSR), except forSHERPAwhich uses the method of Ref. [19].
The PYTHIA andHERWIG samples were generated using the modified leading-order (LO**) PDF setMRSTMCal[20]
following the recommendations of Ref. [21], while the MC@NLO samples used the NLOCT10[22] set. TheSHERPA samples used the defaultCTEQ6L1[23] PDF set of the gen- erator.
All MC events were generated at √
s = 7 TeV and in- clude the full ATLAS detector simulation [24] based on GEANT4 [25]. Settings of MC parameters that describe properties of minimum bias events and the underlying event were chosen based on results from previous AT- LAS measurements [26]. The effects of having on average nine interactions per bunch crossing (“pile-up”) were ac- counted for by overlaying simulated minimum bias events.
To match the measured instantaneous luminosity profile of the LHC, MC events were reweighted to yield the same distribution of the mean number of interactions per bunch crossing as measured in data.
Several corrections were applied to the simulated sam- ples. The electron2 energy resolution was corrected to match that observed in data, following Ref. [27]. In addi- tion, the efficiencies for electrons to pass requirements on the trigger, the reconstruction, and the particle identifica- tion in the MC simulation were corrected byscale factors, defined as the ratio of the measured efficiency in data to that in the simulation. ThePYTHIAsignal MC sample was reweighted at generator-level to a version that used an AT- LAS tune found to yield a good agreement with the trans- verse momentum distribution of the Z boson observed in data [28]. This procedure gives an adequate description of the transverse momentum distribution for the highmeere- gion studied in this analysis.
The PYTHIA and MC@NLO signal predictions were reweighted to a NNLO pQCD calculation with mee- dependent K-factors obtained from a modified version
2In the following electron can mean either electron or positron.
of PHOZPR [29]. Additionally, NLO electroweak correc- tions, calculated using HORACE 3.1 [30], were applied to the PYTHIA MC sample. The t¯t sample was rescaled to its inclusive near-NNLO cross-section prediction [31, 32]
and the diboson samples were normalised to NLO cross- sections calculated usingMCFM[33].
4. Event selection
The analysis is based on the full 2011 data sample col- lected at√
s= 7 TeV. The data were selected online by a trigger that required two electromagnetic (EM) energy de- posits each with a transverse energy greater than 20 GeV.
Applying trigger and data-quality requirements yields an integrated luminosity of 4.9±0.1 fb−1. Events from these pp collisions are selected by requiring a collision vertex with at least three associated tracks, each with transverse momentum greater than 400 MeV. Events are then re- quired to have at least two electron candidates as defined below.
Electron candidates are reconstructed from the energy deposits in the calorimeter matched to inner-detector tracks. An energy scale correction obtained from an in situcalibration, usingW/Z boson andJ/ψ meson decays, following the recipe of Ref. [27], is applied to the data.
The electron candidates are required to have a transverse energy ET >25 GeV and pseudorapidity |η| <2.47, ex- cluding the transition regions between the barrel and end- cap calorimeters at 1.37 < |η| < 1.52. They must sat- isfy the “medium” identification criteria based on shower shape and track-quality variables [27] to provide rejection against jets, and have a hit in the innermost pixel layer to suppress background from photon conversions.
If an event contains more than two electron candidates passing the above selection, the two with highest ETare chosen. To further reduce the background from jet pro- duction, the leading (highestET) electron is required to be isolated by demanding that the sum of the transverse en- ergy in the calorimeter cells in a cone of ∆R= 0.2 around the electron direction is less than 7 GeV. This sum ex- cludes the core of the electron energy deposition and is corrected for theET-dependent transverse shower leakage from the core, as well as for pile-up contributions.
After all selection requirements, a total of 26 844 candi- date events are found in the mee range considered. The dominant background contributions (6–16% depending on mee) are from dijet andW+jets production, in which one or more jets pass the electron selection criteria. The former includes multi-jet, heavy-flavour quark andγ+ jet produc- tion. The latter includes pair-produced top quarks and single-top-quark production, where at least one electron comes from the misidentification of a jet or a heavy quark.
A data-driven method is used to evaluate the sum of these backgrounds. The probability of a jet to be misidenti- fied as an electron (the fake rate) is determined in an ET- andη-dependent way from background-enriched sam- ples recorded by nine different inclusive jet triggers, with
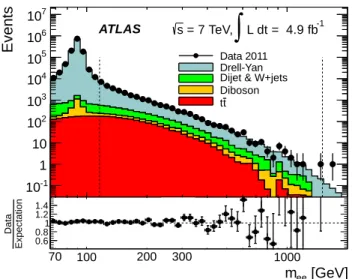
70 200 300 400 2000
Events
10-1
1 10 102
103
104
105
106
107
Data 2011 Drell-Yan Dijet & W+jets Diboson
t t
L dt = 4.9 fb-1
∫
= 7 TeV, ATLAS s
[GeV]
mee
70 100 200 300 1000
ExpectationData
0.6 0.81 1.2 1.4
Figure 1: Distribution of mee in data compared to the summed signal and background predictions, where the bin width is constant in log(mee). The Drell-Yan signal is predicted fromPYTHIAsimulation and the combined dijet andW+jets contribution is estimated from data as described in the text. The dashed vertical lines indicate the mass range used for the differential cross-section measurement.
ET thresholds in the range 20–240 GeV. In each of these jet-triggered samples, the fake rate is calculated as the fraction of electron candidates passing the “loose” identi- fication requirement that also pass the “medium” require- ment. Events containing electron candidates fromW orZ boson decays are first removed by dedicated cuts in order to avoid bias from real electron contamination: W can- didates are rejected by requiring low missing transverse energy and low transverse mass; and Z candidates are re- jected if they contain two “medium” electrons. A weighted average of the fake rates obtained from the nine jet samples is then calculated. To estimate the total dijet plusW+jets background, a factor derived from the averaged fake rate is applied to events that pass the signal selection but with one or both electron candidates passing the “loose” iden- tification requirement and failing the “medium” require- ment.
The only other significant backgrounds arise from the dileptonic decays of pair-produced top quarks (t¯t) and from diboson production processes. These contributions account for up to 5% and 9% of the selected events, respec- tively, and are estimated from MC simulation. The overall level of agreement between data and the sum of the MC signal and background predictions (scaled to 4.9 fb−1) and the data-driven background component is shown in Fig. 1.
5. Cross-section measurement
The differential cross-section, dσ/dmee, is measured in 13 bins of mee from 116 GeV to 1500 GeV in a fiducial region in which both electrons have transverse momentum pT >25 GeV and lie within|η| <2.5. The cross-section
and fiducial region are determined for two conventions re- garding QED FSR corrections. For the Born-level result, the true (meaning without detector simulation) mee and electron kinematics are defined by the electrons originat- ing from theZ/γ∗ decay before FSR. At thedressedlevel, true final-state electrons after FSR are recombined with radiated photons within a cone of ∆R= 0.1.
The cross-section is calculated from dσ
dmee
= Ndata−Nbkg
CDYLint
1 Γbin
, (1)
where Ndata is the number of candidate events observed in a given bin of mee (of width Γbin), Nbkg is the total background in that bin and Lint is the integrated lumi- nosity. The correction factor, CDY, takes into account the efficiency of the signal selection and bin migration ef- fects. It also includes the small extrapolation (about 10%
to 13%) over the small region in |η| that is excluded for reconstructed electron candidates (1.37 <|η| <1.52 and 2.47 < |η| < 2.5). The correction factor is defined as the number of MC-generated events that pass the signal selection in a bin of reconstructed mee, divided by the total number of generated events within the fiducial re- gion, at the Born or dressed level, in the corresponding bin of truemee. It is obtained from thePYTHIAMC signal sample and corrected for differences in the reconstruction, identification and trigger efficiencies between data and MC simulation. The value of CDY varies from 0.55 (0.57) in the lowest bin to 0.70 (0.73) in the highest bin at the Born (dressed) level.
Themeeresolution varies from approximately 3% at low meeto 1% at highmee. The purity, defined as the fraction of simulated events reconstructed in a givenmee bin that have truemee in the same bin, ranges from 79% (82%) to 98% (98%) at the Born (dressed) level.
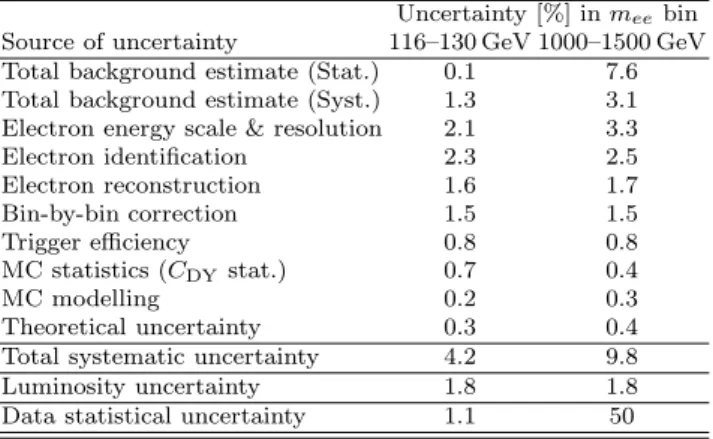
6. Systematic uncertainties
The main contributions to the systematic uncertainties are given in Table 1 and described below.
Background estimation. In the estimation of the dominant dijet andW+jets background, a systematic uncertainty of 11% is assigned to theET- andη-dependent fake rate, cor- responding to the spread of this quantity as measured in the nine independent jet samples, in order to cover any possible bias introduced in the triggering of these back- ground events. A further uncertainty on the fake rate of up to 11% arises due to the presence of remaining signal contamination in the background-enriched sample.
The total systematic uncertainty on the fake rate com- bines with a smaller effect (around 5%) from signal con- tamination in the sample where the fake rate is applied, to give a total uncertainty on the resulting background estimate of up to 16%. An additional systematic uncer- tainty can arise if the fake rate differs for different sources
of fake electrons and the relative contribution of the differ- ent sources is not the same in the data sample where the fake rate is measured and the sample of events to which it is applied. It is found that b-jets have a higher fake rate than jets initiated by gluons or light quarks, but that the fraction ofb-jets is small and similar in both samples.
Conservatively taking this additional source of uncertainty into account, the overall uncertainty on the background is enlarged to 20%.
This 20% is added in quadrature to the statistical un- certainty of the sample to which the fake rate is applied;
the latter uncertainty dominates in the highest two mee
bins. The resulting overall uncertainty on the cross-section varies between 1.3% and 7.9%, depending onmee.
Two alternative methods to estimate the dijet and W+jets background are considered as cross-checks. The first of these is similar to the baseline method but uses fake rates derived from loosely selected electrons collected by the EM signal trigger. Here the background-enriched sample is derived by employing a tag-and-probe technique selecting, among other requirements to suppress real elec- tron contamination, a jet-like tag and a probe with the same charge. This method, being correlated to the base- line method due to the overlap of electron candidates pass- ing the EM and jet triggers, yields very similar predictions with comparable systematic uncertainties. In the third method, the combined dijet plus W+jets background is estimated by performing a template fit to the isolation of the leading versus sub-leading electron. The background templates are obtained from data by reversing some of the identification requirements on one or both of the electrons, and the signal templates are made from the PYTHIA DY sample. No additional systematic uncertainty is assigned from the two cross-checks, as their results are in agreement with the baseline method.
The uncertainties on the diboson andt¯tbackground ex- pectations include the theoretical uncertainties on their cross-sections, 5% for the dibosons [31] and 10% fortt¯[32].
At highmee, the statistical uncertainties on the simulated samples dominate, exceeding 50% in the highest bin for both processes. The resulting uncertainty on the cross- section is small compared to the data-driven dijet and W+jets contributions, ranging from less than 0.3% at low mee to 2.0% in the highestmee bin. The uncertainty on the cross-section from the total background expectation is between 1.3% and 8.2%.
Electron reconstruction and identification. The recon- struction and identification efficiencies of electrons have been determined previously from data for electrons with ETup to 50 GeV, using tag-and-probe methods in vector- boson decays, following the prescription of Ref. [27]. To extend the measurement range of the identification effi- ciency in ET, a dedicated tag-and-probe measurement is made using Z → e+e− decays. It employs the isolation method, developed in Ref. [27] for W → eν final states, to estimate the background contamination. Here, η- and
Uncertainty [%] inmeebin Source of uncertainty 116–130 GeV 1000–1500 GeV Total background estimate (Stat.) 0.1 7.6 Total background estimate (Syst.) 1.3 3.1 Electron energy scale & resolution 2.1 3.3
Electron identification 2.3 2.5
Electron reconstruction 1.6 1.7
Bin-by-bin correction 1.5 1.5
Trigger efficiency 0.8 0.8
MC statistics (CDYstat.) 0.7 0.4
MC modelling 0.2 0.3
Theoretical uncertainty 0.3 0.4
Total systematic uncertainty 4.2 9.8
Luminosity uncertainty 1.8 1.8
Data statistical uncertainty 1.1 50
Table 1: Summary of systematic uncertainties on the cross-section measurement, shown for the lowest and highest bin inmee. For some sources the lowest or highest uncertainty may lie in an intermediate bin. The data statistical uncertainties are also given for comparison.
ET-dependent background template distributions of the isolation are obtained from data by reversing some of the requirements applied in the electron identification criteria.
The isolation quantity is defined in a similar way to that used in the selection of the leading electron in the signal sample. The background isolation templates are then nor- malised to data in the tail of the distributions where no contribution from signal is expected, both before and after applying the identification requirements, in order to esti- mate the background fraction in the probe sample. The identification efficiencies are found to be consistent with those obtained by the method of Ref. [27] in the common measurement range, and are stable for electrons withET
up to 500 GeV.
The differences between the measured reconstruction and identification efficiencies and their values in MC sim- ulation are taken as η- and ET-dependent scale factors with which the MC-derived CDY is corrected. An ad- ditional scale factor for the isolation requirement on the leading electron is also applied. Varying the scale factors for the electron reconstruction (identification) within their systematic uncertainties results in a change in the cross- section of up to 1.7% (2.6%).
Energy scale and resolution. Both the scale and resolution corrections, estimated fromZ →e+e− events, are varied in the simulation within their uncertainties. The overall effect on the cross-section is between 1.0% and 3.3%.
Bin-by-bin correction. The results obtained from the bin- by-bin correction are cross-checked using an iterative Bayesian approach [34] and found to be consistent. In addition, a consistency test is performed by correcting the MC@NLO signal sample using the PYTHIA-derivedCDY fac- tor. The discrepancy between the sample corrected in this way and the trueMC@NLOsample is about 1.5%. This is due to the slightly different shapes of themeedistribution from the two generators, considered to represent the possible
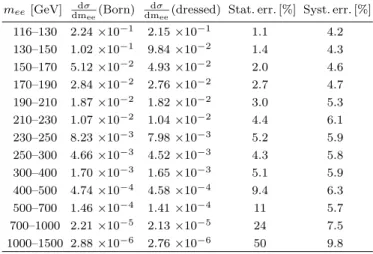
mee[GeV] dmdσ
ee(Born) dmdσ
ee(dressed) Stat. err. [%] Syst. err. [%]
116–130 2.24×10⁻¹ 2.15×10⁻¹ 1.1 4.2 130–150 1.02×10⁻¹ 9.84×10⁻² 1.4 4.3 150–170 5.12×10⁻² 4.93×10⁻² 2.0 4.6 170–190 2.84×10⁻² 2.76×10⁻² 2.7 4.7 190–210 1.87×10⁻² 1.82×10⁻² 3.0 5.3 210–230 1.07×10⁻² 1.04×10⁻² 4.4 6.1 230–250 8.23×10⁻³ 7.98×10⁻³ 5.2 5.9 250–300 4.66×10⁻³ 4.52×10⁻³ 4.3 5.8 300–400 1.70×10⁻³ 1.65×10⁻³ 5.1 5.9 400–500 4.74×10⁻⁴ 4.58×10⁻⁴ 9.4 6.3 500–700 1.46×10⁻⁴ 1.41×10⁻⁴ 11 5.7 700–1000 2.21×10⁻⁵ 2.13×10⁻⁵ 24 7.5 1000–1500 2.88×10⁻⁶ 2.76×10⁻⁶ 50 9.8
Table 2: Measured differential cross-sections dmdσ
ee (in pb/GeV) at the Born and dressed levels for DY production ofe+e−pairs in the fiducial region (electron pT >25 GeV and |η| <2.5) with statis- tical (stat.) and systematic (syst.) uncertainties in %. The 1.8%
luminosity uncertainty is not included.
shape difference between data and thePYTHIAsimulation.
This is conservatively added as a systematic uncertainty on the cross-section in all mee bins.
Trigger efficiency. Scale factors to account for the dif- ference in the EM signal-trigger efficiency between data and simulation are obtained by measuring the efficiency in data and MC events using a tag-and-probe method. The Z →e+e− events are tagged by selecting events passing a single-electron trigger, thus providing one electron probe free of trigger bias to test against the signal-trigger re- quirements. The scale factors are very close to unity, and the effect on the cross-section of varying them within their systematic uncertainties is approximately 1%.
MC statistics and MC modelling. The finite number of events in the MC samples from which the CDY factor is derived contribute an uncertainty of up to 2.4% on CDY
and the computed cross-section. Systematic uncertainties are associated with the use of the K-factors and with the reweighting of the PYTHIA signal MC events in order to better match the transverse momentum distribution of the Z bosons and the mean number of interactions per bunch crossing in the data. The effect of a further reweighting of the vertex position distribution in thez direction, not ap- plied by default when calculatingCDY, is also taken as an uncertainty. These uncertainties enter into the calculation of CDY and result in an overall uncertainty on the cross- section of less than 1%. Excellent agreement in the FSR predictions between PHOTOS and SANC [35, 36] has been shown [37] and uncertainties related to the modelling of the detector response to low-energy photons from FSR are negligible.
Theoretical uncertainties. Several theoretical uncertain- ties apply to the extrapolation of the cross-section in |η|
from the measured region to the fiducial region and thus contribute to an additional uncertainty onCDY. To evalu- ate the effect of the choice of PDF, the calculation ofCDY
using PYTHIA with its default PDF (MRSTMCal) is com- pared to that obtained after reweighting to CT10 (NLO) and HERAPDF1.5 [38] (NLO). The largest difference be- tween the reweighted results and the default is taken as the systematic uncertainty, and amounts to 0.2%. A fur- ther systematic uncertainty is calculated using theMC@NLO sample reweighted to the 52 CT10 eigenvector error sets, the result being 0.5% at most. Finally, comparisons are made between PYTHIA reweighted to the CT10 PDF and MC@NLO (which uses as default CT10), and cross-checked using FEWZ 2.1at NLO using the CT10PDF. The effect is at most 0.3%. These systematic uncertainties, which each have a different dependence on mee, are added in quadrature and together give a 0.2–0.5% uncertainty on the cross-section.
The contributions from the above sources of system- atic uncertainty to the uncertainty on the measured cross- section are summarised in Table 1 for the lowest and high- est bin in themee range considered. The overall system- atic uncertainty, excluding the luminosity uncertainty of 1.8% [39], rises from 4.2% in the lowestmee bin to 9.8%
in the highestmee bin. The data statistical uncertainties increase from 1.1% to 50%.
7. Results and comparison to theory
The cross-sections obtained in the fiducial region (elec- tronpT>25 GeV and|η|<2.5) at the Born and dressed levels are given in Table 2. The difference between the two results is at most 4%. The precision of the measurement is limited by the statistical uncertainty on the data for mee>400 GeV.
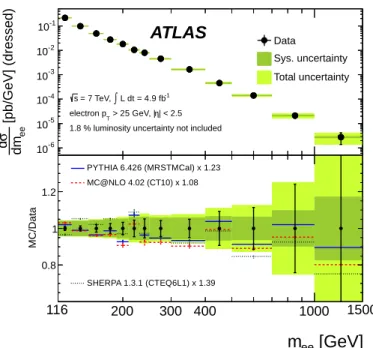
Fig. 2 shows the results at the dressed level, where they are compared to the predictions fromPYTHIA,MC@NLOand SHERPA. No corrections have been applied to the generator- level predictions; instead, the prediction of each genera- tor has been scaled globally to match the total number of events observed in data. The resulting scale factors are 1.23 forPYTHIA, 1.08 forMC@NLO and 1.39 forSHERPA. As expected, the only prediction at NLO in pQCD, from the MC@NLOgenerator, yields the scale factor closest to unity.
The overall shape of the mee distribution from all three generators is consistent with the data.
Fig. 3 shows the differential cross-section at the Born level compared to calculations in theFEWZ 3.1framework using various recent NNLO PDFs. TheFEWZ 3.1 frame- work allows the (N)NLO QCD corrections to lepton pair production to be combined with the NLO electroweak cor- rections. It has been verified at NLO in QCD that the choice of electroweak scheme,Gµ orα(mZ) as introduced in Ref. [40], has an effect of at most 0.4% on the calcu- lated cross-section after applying NLO electroweak cor- rections. The electroweak-corrected NNLO QCD predic-
103 [pb/GeV] (dressed) eedmσd -610
10-5
10-4
10-3
10-2
10-1
Data
Sys. uncertainty Total uncertainty
ATLAS
L dt = 4.9 fb-1
∫
= 7 TeV, s
| < 2.5 η > 25 GeV, | electron pT
1.8 % luminosity uncertainty not included
116 1500
[GeV]
mee
200 300 400 1000
MC/Data
0.8 1 1.2
PYTHIA 6.426 (MRSTMCal) x 1.23 MC@NLO 4.02 (CT10) x 1.08
SHERPA 1.3.1 (CTEQ6L1) x 1.39
Figure 2: Measured differential cross-section at the dressed level within the fiducial region (electronpT>25 GeV and|η|<2.5) with statistical, systematic, and combined statistical and systematic (to- tal) uncertainties, excluding the 1.8% uncertainty on the luminosity.
In the lower panel, the measurement is compared to the predictions of the PYTHIA, MC@NLO and SHERPA MC generators including their statistical uncertainties. No corrections have been applied to the cross-section predictions of the generators. Instead, the predictions of each generator have been scaled by a global factor as indicated on the ratio plots to match the total number of events observed in data.
tions shown are calculated using theGµscheme. The elec- troweak corrections include a positive contribution from the irreducible, non-resonant photon-induced background, i.e.,γγ→e+e−. This contribution is estimated at leading order (LO) using the MRST2004qed [41] PDF, currently the only set available that includes QED corrections to the proton PDF, by taking the average of the predic- tions obtained under the current and constituent quark mass schemes. The symmetric difference between the av- erage and either scheme is assigned as the correspond- ing uncertainty on this additive correction, being approx- imately 50% and representing a 3% uncertainty on the cross-section prediction in the highest mee bin. The elec- troweak and photon-induced corrections were verified by SANC[35, 36]. An additional small correction arises from single-boson production in which the final-state charged lepton radiates a real W or Z boson [42]. This is esti- mated using MADGRAPH 5 [43], following the prescription outlined in Ref. [42], to be at most 2%, in the highestmee
bin.
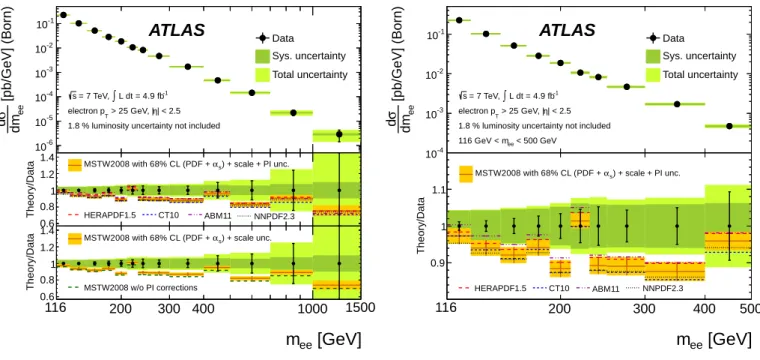
It can be seen in Fig. 3 that the deviations between theMSTW2008[2] and the CT10[22], HERAPDF1.5[38] and NNPDF2.3 [44] predictions are covered by the total uncer- tainty band assigned to the MSTW2008 prediction, which
is dominated by the combined 68% confidence level (CL) PDF andαs variation. At lowmeetheABM11[45] predic- tion lies above this theoretical uncertainty band, in part due to theABM11PDF set using a value ofαs outside of the 68% CL variation. The renormalisation and factori- sation scale uncertainties contribute at most 1% to the theoretical uncertainty band in the highestmee bin, hav- ing been evaluated by varying both scales up or down to- gether by a factor of two, usingVRAP[46]. The size of the photon-induced contribution is similar to the sum of the PDF,αsand scale uncertainties as can be seen in the lower panel of Fig. 3 (left), where the nominal calculation using theMSTW2008PDF set is compared to the case where this contribution is not taken into account.
In the region where the precision of the measurement is limited by systematic uncertainties, mee <400 GeV, the data generally lie above the FEWZcalculations. However, assuming that all systematic uncertainties, except those of statistical origin on the background and on CDY (Ta- ble 1), are fully correlated bin-to-bin, the comparison be- tween data and the different predictions over the full mass range yields chi-squared values of 13.9 forMSTW2008, 18.9 forCT10, 13.5 forHERAPDF1.5, 14.7 forABM11and 14.8 for NNPDF2.3, for the 13 data points, indicating compatibility between the theory and data.
8. Summary
Using 4.9 fb−1 of data fromppcollisions at a centre-of- mass energy of√
s= 7 TeV, the invariant mass distribu- tion ofe+e−pairs from DY production has been measured at ATLAS in the range 116< mee <1500 GeV, for elec- trons with pT > 25 GeV and |η| < 2.5. Comparisons have been made to the predictions of thePYTHIA,MC@NLO and SHERPA MC generators, after scaling them globally to match the total number of events observed in data.
The MC predictions are consistent with the shape of the measured mee distribution. The predictions of the FEWZ 3.1 framework using five PDF sets at NNLO have also been studied. The framework combines calculations at NNLO QCD with NLO electroweak corrections, to which LO photon-induced corrections and real W and Z boson emission in single-boson production have been added. The resulting predictions for all PDFs are consistent with the measured differential cross-section, although the data are systematically above the theory. The data have the po- tential to constrain PDFs, in particular for antiquarks at large x, in the context of a PDF fit involving the world data sensitive to the proton structure.
9. Acknowledgements
We thank CERN for the very successful operation of the LHC, as well as the support staff from our institutions without whom ATLAS could not be operated efficiently.
We acknowledge the support of ANPCyT, Argentina;
YerPhI, Armenia; ARC, Australia; BMWF and FWF,
103 [pb/GeV] (Born) eedmσd
10-6
10-5
10-4
10-3
10-2
10-1
Data
Sys. uncertainty Total uncertainty
ATLAS
L dt = 4.9 fb-1
∫
= 7 TeV, s
| < 2.5 η > 25 GeV, | electron pT
1.8 % luminosity uncertainty not included
116 1500
[GeV]
mee
200 300 400 1000
Theory/Data
0.6 0.8 1 1.2 1.4
[GeV]
mee
200 300 400 1000
Theory/Data
0.6 0.8 1 1.2 1.4
) + scale + PI unc.
αs
MSTW2008 with 68% CL (PDF +
MSTW2008 w/o PI corrections
) + scale unc.
αs
MSTW2008 with 68% CL (PDF +
HERAPDF1.5 CT10 ABM11 NNPDF2.3
[pb/GeV] (Born) eedmσd
10-4
10-3
10-2
10-1 Data
Sys. uncertainty Total uncertainty
ATLAS
L dt = 4.9 fb-1
∫
= 7 TeV, s
| < 2.5 η > 25 GeV, | electron pT
1.8 % luminosity uncertainty not included < 500 GeV
116 GeV < mee
116
[GeV]
mee
200 300 400 500
Theory/Data
0.9 1 1.1
) + scale + PI unc.
αs
MSTW2008 with 68% CL (PDF +
HERAPDF1.5 CT10 ABM11 NNPDF2.3
Figure 3: Measured differential cross-section at the Born level within the fiducial region (electronpT>25 GeV and|η|<2.5) with statistical, systematic, and combined statistical and systematic (total) uncertainties, excluding the 1.8% uncertainty on the luminosity. The measurement is compared toFEWZ 3.1calculations at NNLO QCD with NLO electroweak corrections using theGµ electroweak parameter scheme. The predictions include an additional small correction from single-boson production in which the final-state charged lepton radiates a realW or Z boson. On the left, in the upper ratio plot, the photon-induced (PI) corrections have been added to the predictions obtained from the MSTW2008,HERAPDF1.5,CT10,ABM11andNNPDF2.3NNLO PDFs, and for theMSTW2008prediction the total uncertainty band arising from the PDF,αs, renormalisation and factorisation scale, and photon-induced uncertainties is drawn. The lower ratio plot shows the influence of the photon-induced corrections on theMSTW2008 prediction, the uncertainty band including only the PDF,αs and scale uncertainties. On the right, the results are shown for a restricted range ofmee.
Austria; ANAS, Azerbaijan; SSTC, Belarus; CNPq and FAPESP, Brazil; NSERC, NRC and CFI, Canada; CERN;
CONICYT, Chile; CAS, MOST and NSFC, China; COL- CIENCIAS, Colombia; MSMT CR, MPO CR and VSC CR, Czech Republic; DNRF, DNSRC and Lundbeck Foun- dation, Denmark; EPLANET, ERC and NSRF, European Union; IN2P3-CNRS, CEA-DSM/IRFU, France; GNSF, Georgia; BMBF, DFG, HGF, MPG and AvH Founda- tion, Germany; GSRT and NSRF, Greece; ISF, MIN- ERVA, GIF, DIP and Benoziyo Center, Israel; INFN, Italy; MEXT and JSPS, Japan; CNRST, Morocco; FOM and NWO, Netherlands; BRF and RCN, Norway; MNiSW, Poland; GRICES and FCT, Portugal; MERYS (MECTS), Romania; MES of Russia and ROSATOM, Russian Fed- eration; JINR; MSTD, Serbia; MSSR, Slovakia; ARRS and MIZˇS, Slovenia; DST/NRF, South Africa; MICINN, Spain; SRC and Wallenberg Foundation, Sweden; SER, SNSF and Cantons of Bern and Geneva, Switzerland;
NSC, Taiwan; TAEK, Turkey; STFC, the Royal Society and Leverhulme Trust, United Kingdom; DOE and NSF, United States of America.
The crucial computing support from all WLCG part- ners is acknowledged gratefully, in particular from CERN and the ATLAS Tier-1 facilities at TRIUMF (Canada), NDGF (Denmark, Norway, Sweden), CC-IN2P3 (France),
KIT/GridKA (Germany), INFN-CNAF (Italy), NL-T1 (Netherlands), PIC (Spain), ASGC (Taiwan), RAL (UK) and BNL (USA) and in the Tier-2 facilities worldwide.
References
[1] S. D. Drell and T. M. Yan, Phys. Rev. Lett. 25 (1970) 316 [Erratum–ibid. 25 (1970) 902].
[2] A. D. Martin, W. J. Stirling, R. S. Thorne and G. Watt, Eur.
Phys. J. C 63 (2009) 189 [arXiv:0901.0002].
[3] CMS Collaboration, JHEP 1110 (2011) 007 [arXiv:1108.0566].
[4] CDF Collaboration, T. Affolder, et al., Phys. Rev. Lett. 87 (2001) 131802 [arXiv:hep–ex/0106047].
[5] D0 Collaboration, B. Abbott et al., Phys. Rev. Lett. 82 (1999) 4769 [arXiv:hep–ex/9812010].
[6] ATLAS Collaboration, Phys. Rev. D 85 (2012) 072004 [arXiv:1109.5141].
[7] ATLAS Collaboration, Phys. Rev. Lett. 107 (2011) 272002 [arXiv:1108.1582].
[8] ATLAS Collaboration, JHEP 1211 (2012) 138 [arXiv:1209.2535].
[9] ATLAS Collaboration, Phys. Rev. D 87 (2013) 015010 [arXiv:1211.1150].
[10] K. Melnikov and F. Petriello, Phys. Rev. D 74 (2006) 114017 [arXiv:hep–ph/0609070].
[11] Y. Li and F. Petriello, Phys. Rev. D 86 (2012) 094034 [arXiv:1208.5967].
[12] ATLAS Collaboration, JINST 3 (2008) S08003 [arXiv:0901.0512].
[13] T. Sj¨ostrand, S. Mrenna and P. Skands, JHEP 0605 (2006) 026 [arXiv:hep–ph/0603175].
[14] S. Frixione and B. R. Webber, JHEP 0206 (2002) 029 [arXiv:hep–ph/0204244].
[15] T. Gleisberg et al., JHEP 0902 (2009) 007 [arXiv:0811.4622].
[16] G. Corcella et al., JHEP 0101 (2001) 010 [arXiv:hep–
ph/0011363].
[17] J. M. Butterworth, J.R. Forshaw and M. H. Seymour, Z. Phys.
C 72 (1996) 637 [arXiv:hep–ph/9601371].
[18] P. Golonka and Z. Was, Eur. Phys. J. C 45 (2006) 97 [arXiv:hep–
ph/0506026].
[19] D. R. Yennie, S. C. Frautschi and H. Suura, Annals Phys. 13 (1961) 379.
[20] A. Sherstnev and R. S. Thorne, arXiv:0807.2132 [hep-ph]
(2008).
[21] A. Sherstnev and R. S. Thorne, Eur. Phys. J. C 55 (2008) 553 [arXiv:0711.2473].
[22] H. L. Lai et al., Phys. Rev. D 82 (2010) 074024 [arXiv:1007.2241].
[23] J. Pumplin et al., JHEP 0207 (2002) 012 [arXiv:hep–
ph/0201195].
[24] ATLAS Collaboration, Eur. Phys. J. C 70 (2010) 823 [arXiv:1005.4568].
[25] GEANT4 Collaboration, Nucl. Instrum. Meth. A 506 (2003) 250.
[26] ATLAS Collaboration, ATL-PHYS-PUB-2011-009, http://cdsweb.cern.ch/record/1363300 (2011).
[27] ATLAS Collaboration, Eur. Phys. J. C 72 (2012) 1909 [arXiv:1110.3174].
[28] ATLAS Collaboration, Phys. Lett. B 705 (2011) 415 [arXiv:1107.2381].
[29] R. Hamberg, W. L. van Neerven, and T. Matsuura, Nucl. Phys.
B359 (1991) 343 [Erratum–ibid. B 644 (2002) 403].
[30] C. M. Carloni Calame, G. Montagna, O. Nicrosini, A. Vicini, JHEP 0710 (2007) 109 [arXiv:0710.1722].
[31] S. Moch and P. Uwer, Phys. Rev. D 78 (2008) 034003 [arXiv:0804.1476].
[32] M. Aliev et al., Comput. Phys. Commun. 182 (2011) 1034 [arXiv:1007.1327].
[33] J. M. Campbell and R. K. Ellis, Phys. Rev. D 60 (1999) 113006 [arXiv:hep–ph/9905386].
[34] G. D’Agostini, Nucl. Instrum. Meth. A 362 (1995) 487.
[35] S. Bondarenko and A. Sapronov, arXiv:1301.3687 [hep-ph]
(2013).
[36] D. Bardin, S. Bondarenko, P. Christova, L. Kalinovskaya, L.
Rumyantsev, A. Sapronov and W. von Schlippe, JETP Lett. 96 (2012) 285 [arXiv:1207.4400].
[37] A. B. Arbuzov, R R. Sadykov, and Z. Was, arXiv:1212.6783 [hep-ph] (2012).
[38] H1 and ZEUS Collaborations, JHEP 1001 (2010) 109 [arXiv:0911.0884].
http://www.hepforge.org/archive/lhapdf/pdfsets/current/
HERAPDF15NNLO EIG.LHgrid.
[39] ATLAS Collaboration, submitted to Eur. Phys. J., arXiv:1302.4393 [hep-ex] (2013).
[40] S. Dittmaier and M. Huber, JHEP 1001 (2010) 060 [arXiv:0911.2329].
[41] A. D. Martin, R. G. Roberts, W. J. Stirling and R. S. Thorne, Eur. Phys. J. C 39 (2005) 155.
[42] U. Baur, Phys. Rev. D 75 (2007) 013005 [arXiv:hep–
ph/0611241].
[43] J. Alwall, M. Herquet, F. Maltoni, O. Mattelaer and T. Stelzer, JHEP 1106 (2011) 128 [arXiv:1106.0522].
[44] R. D. Ball, V. Bertone, S. Carrazza, C. S. Deans, L. Del Debbio, S. Forte, A. Guffanti and N. P. Hartland et al., Nucl. Phys. B 867 (2013) 244 [arXiv:1207.1303].
http://www.hepforge.org/archive/lhapdf/pdfsets/current/
NNPDF23 nnlo as0118.LHgrid.
[45] S. Alekhin, J. Blumlein and S. Moch, Phys. Rev. D 86 (2012) 054009 [arXiv:1202.2281].
[46] C. Anastasiou, L. J. Dixon, K. Melnikov, and F. Petriello, Phys.
Rev. D 69 (2004) 094008 [arXiv:hep–ph/0312266].