arXiv:1301.1583v1 [hep-ex] 8 Jan 2013
EUROPEAN ORGANISATION FOR NUCLEAR RESEARCH (CERN)
CERN-PH-EP-2012-344
Submitted to: Phys. Lett. B
Search for single b
∗-quark production with the ATLAS detector at √
s = 7 TeV
The ATLAS Collaboration
Abstract
The results of a search for an excited bottom-quarkb∗inppcollisions at √
s=7 TeV, using4.7fb−1 of data collected by the ATLAS detector at the LHC are presented. In the model studied, a singleb∗- quark is produced through a chromomagnetic interaction and subsequently decays to aWboson and a top quark. The search is performed in the dilepton and lepton+jets final states, which are combined to set limits on b∗-quark couplings for a range of b∗-quark masses. For a benchmark with unit size chromomagnetic and Standard Model-like electroweakb∗ couplings,b∗ quarks with masses less than 870 GeVare excluded at the 95% credibility level.
Search for single b
∗-quark production with the ATLAS detector at √
s = 7 TeV
The ATLAS Collaboration
Abstract
The results of a search for an excited bottom-quark b∗ in pp collisions at √
s = 7 TeV, using 4.7 fb−1 of data collected by the ATLAS detector at the LHC are presented. In the model studied, a single b∗-quark is produced through a chromomagnetic interaction and subsequently decays to a W boson and a top quark. The search is performed in the dilepton and lepton+jets final states, which are combined to set limits on b∗-quark couplings for a range of b∗- quark masses. For a benchmark with unit size chromomagnetic and Standard Model-like electroweak b∗couplings, b∗quarks with masses less than 870 GeV are excluded at the 95% credibility level.
Keywords: ATLAS, b∗, single top-quark, excited quark
1. Introduction
The single top-quark signature is sensitive to many models of new physics [1]. Single top-quark produc- tion in the Standard Model (SM) has been measured at the LHC in the t-channel [2, 3] and in association with a W boson (Wt-channel) [4, 5]. Searches for resonant production of a new particle which decays with a single top-quark have been carried out in the s-channel produc- tion of a top quark together with a b quark [6, 7]. This Letter presents the first search for a resonance decay- ing to a single top-quark and a W boson [8]. Here we consider the production of an excited quark b∗ which decays to a single top-quark and a W boson. This is the first search for excited-quarks coupling to the third generation of fermions.
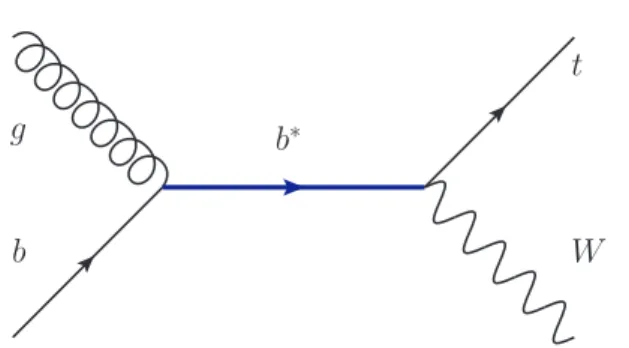
Previous searches for excited quarks have focused on their strong interactions [9, 10], as well as their electro- magnetic interactions [11, 12] with SM quarks. These searches exploit the coupling between the excited quark and up or down quarks in the proton. Here the produc- tion of excited-quarks coupling primarily to the third generation of SM quarks is investigated. This cou- pling occurs for example in Randall–Sundrum models that address the strong interaction sector [13, 14] or in models with a heavy gluon partner, such as composite Higgs models [15–17]. The b∗quark is produced singly through its coupling to a b quark and a gluon, as shown in Fig. 1.
The Lagrangian describing this interaction is given by
b∗ g
b
t
W
Figure 1: Leading-order Feynman diagram for single-b∗-quark pro- duction and decay to Wt.
[18, 19]
L= gs
2ΛGµνbσµν κbLPL+κbRPR
!
b∗+h.c. , (1) where gs is the strong coupling, Gµν the gauge field tensor of the gluon and Λ = mb∗ the scale of the new physics. PLand PR are the left- and right-handed pro- jection operators andκbLandκbR are the respective cou- pling strengths. This analysis is thus complementary to excited-quark searches focusing on the coupling to the first generation [9, 20, 21]. Single b∗-quark production can also reveal the chiral nature of the excited bottom- quark [8].
In addition to the chromomagnetic coupling, the b∗quark investigated here also has weak couplings, as in a general class of new physics models where new heavy particles stabilise the Higgs-boson mass at the electroweak scale [22–26]. In such models, the heavy
Preprint submitted to Phys. Lett. B October 9, 2018
quarks can have left-handed or right-handed couplings to the W boson or can be vector-like with equal strength for both couplings. The Lagrangian describing the elec- troweak decay of the b∗quark, shown in Fig. 1, is
L= g2
√2
Wµ+tγµ
gLPL+gRPR
b∗+h.c. , (2) where g2is the SU(2)Lweak coupling and gLand gRare the coupling strengths for left-handed and right-handed couplings, respectively.
While the search is general and considers any res- onance decaying into the Wt signature, three specific b∗-quark coupling scenarios are considered in order to extract b∗-quark coupling and mass limits: left-handed (κbL, gL non-zero and κbR = gR = 0), right-handed (κbL = gL = 0 and κbR, gR non-zero) and vector-like (κbL = κRb = κbL/R and gL = gR = gL/R non-zero) pro- duction and decay. Limits are derived as a function of the b∗-quark mass as well as the couplingsκbL,R and gL,R. These limits take into account both the change of the production cross-section and the b∗ → Wt decay branching ratio, which depend on the couplings and the b∗-quark mass. The branching ratio to Wt varies be- tween 20% at mb∗ = 300 GeV and 40% at higher val- ues, with decays to bg, bZ and bH also allowed. Con- tributions from non-Wt decay modes that may increase the b∗-quark acceptance of this analysis are not con- sidered, resulting in conservative limits. Signal event yields presented in the following tables are calculated withκbL=gL=1 andκbR =gR=0.
For a left-handed b∗at √
s=7 TeV withκbL=gL=1 andκbR =gR =0, the leading-order cross section times branching ratio to Wt is 0.80 pb for mb∗=900 GeV [8].
The uncertainties due to the choice of factorisation and renormalisation scales are evaluated by varying the scales between mb∗/2 and 2 ×mb∗, and those due to the choice of PDF by comparing results obtained us- ing the CT10 [27], MRST [28] and NNPDF [29] sets.
These uncertainties are added in quadrature to yield cross-section uncertainties ranging from 12% at mb∗ = 300 GeV to 25% at mb∗ =1200 GeV.
This channel proceeds via two W bosons from b∗- quark and top-quark decays. At least one W boson is required to decay to a lepton (electron or muon). The analysis is performed separately in the dilepton and lep- ton+jets final states. The lepton+jets channel has the advantage that the invariant mass of the b∗ quark can be reconstructed, whereas the dilepton channel benefits from smaller backgrounds. A discriminant that sepa- rates the b∗-quark signal from the backgrounds is de- fined in each final state. Limits on b∗-quark production are obtained from a combined Bayesian analysis of both
discriminant distributions.
2. The ATLAS detector
The ATLAS detector [30] is a general purpose de- tector with a precise tracking system, calorimeters and an outer muon spectrometer. The inner tracking sys- tem consists of a silicon pixel detector, a silicon mi- crostrip tracker, and a straw-tube transition radiation tracker. This system is immersed in a 2 T axial magnetic field produced by a solenoid and provides charged parti- cle tracking and identification in the pseudorapidity1re- gion|η|<2.5. The central calorimeter system consists of a liquid-argon electromagnetic sampling calorime- ter with high granularity and an iron/scintillator tile calorimeter providing hadronic energy measurements in the central pseudorapidity range (|η|<1.7). The endcap and forward regions are instrumented with liquid-argon calorimeters for both electromagnetic and hadronic en- ergy measurements up to|η|=4.9. The muon spectrom- eter is operated in a toroidal magnetic field provided by air-core superconducting magnets and includes tracking chambers for precise muon momentum measurements up to|η|=2.7 and trigger chambers covering the range
|η|<2.4.
3. Data and simulated samples
This analysis uses data collected with the ATLAS de- tector in 2011, corresponding to an integrated luminos- ity of 4.7±0.2 fb−1[31, 32] of 7 TeV proton–proton (pp) collisions delivered by the LHC. The data are selected using single-electron or single-muon triggers whose ef- ficiencies reach their plateau at 25 GeV and 20 GeV, re- spectively [33, 34]. The data must also pass stringent quality requirements [35]. Events are selected if they contain at least one primary vertex candidate with at least five associated tracks.
The signal is modelled using MadGraph5 [36]
and the CTEQ6L1 parton distribution functions (PDFs) [37]. Events with single top-quarks in the t- channel are generated with the AcerMC [38] genera- tor, using the MRST LO** PDF set [39]. MadGraph5
1ATLAS uses a right-handed coordinate system with its origin at the nominal interaction point (IP) in the centre of the detector and the z-axis along the beam pipe. The x-axis points from the IP to the centre of the LHC ring, and the y-axis points upwards. Cylindrical coordinates (r, φ) are used in the transverse plane,φis the azimuthal angle around the beam pipe. The pseudorapidityηis defined in terms of the polar angleθasη=−ln(tanθ/2).
and AcerMC are interfaced to Pythia [40] for par- ton showering and modelling of the underlying event.
Other processes producing single top-quarks and top- quark pairs (t¯t) are modelled with the next-to-leading- order(NLO) generator MC@NLO [41] using the CT10 PDF set [27], interfaced to Herwig [42] for parton showering and Jimmy [43] for the underlying event.
Alpgen [44] is used to model vector boson (W and Z) production in association with jets as well as dibo- son processes (WW, WZ and ZZ) using the CTEQ6L1 PDF set. It is interfaced to Herwigfor parton shower modelling. In the lepton+jets analysis the diboson pro- cesses are modelled with Herwigonly. Decays ofτlep- tons are handled by Tauola[45]. A top-quark mass of 172.5 GeV [46] is assumed. Approximate next-to-next- to-leading-order(NNLO) cross-section calculations are used to normalise the t¯t [47] (Hathor) and single top- quark samples [48–50], while the vector boson and di- boson samples are normalised using calculations with MCFM [51] at NNLO and NLO, respectively.
A variable number of additional pp interactions (pile- up) are overlaid on simulated events, which are then weighted to reproduce the distribution of the number of collisions per bunch crossing observed in data. All samples are passed through a GEANT4-based simula- tion [52] of the ATLAS detector [53] and are then re- constructed using the same procedure as for collision data.
4. Physics object selection
Electron candidates are reconstructed from clusters of energy deposits in the calorimeter [54]. The transverse energy ETof electron candidates is required to be larger than 25 GeV and their pseudorapidity is required to be
|η|<2.47. Electrons in the barrel–endcap transition re- gion of the calorimeter, corresponding to 1.37 <|η| <
1.52, are not considered. Selected electrons must pass a set of “tight” quality criteria [54] and the electons must be matched to a track reconstructed in the inner tracking system. Electrons must also be isolated from close-by tracks in a cone of∆R = p
(∆η)2+(∆φ)2 < 0.3 and from calorimeter energy deposits not belonging to the electron candidate in a cone of∆R < 0.2. The isola- tion requirements on the sum of transverse momenta of tracks in the cone and on the sum of energy deposits in the calorimeter in the cone are chosen as a function of pTandηsuch that an efficiency of 90% for electrons in the simulation is achieved.
Muon candidates are reconstructed from matching tracks in the muon spectrometer and inner tracking sys- tem. Muons are required to have transverse momentum
pT >25 GeV and|η|<2.5 and fulfil tight quality crite- ria [55]. Muons must be isolated from close-by tracks in a cone of∆R <0.3 and from energy deposits in the calorimeter in a cone of ∆R <0.2. The sum of trans- verse momenta of tracks in the cone must not exceed 2.5 GeV and the sum of energy deposits in the calorime- ter in the cone must be below 4 GeV.
In order to reject events in which a muon emitting a hard photon is also reconstructed as an electron, events are vetoed if a selected electron–muon pair shares the same track.
Jets are reconstructed from clusters of energy de- posits in the calorimeter [56] using the anti-kt algo- rithm [57] with a radius parameter R = 0.4. These jets are calibrated to the hadronic energy scale through pT- and η-dependent scale factors, which are derived from simulation. An additional uncertainty due to residual differences between simulation and data is ap- plied in the analysis [58]. Jets are required to have pT > 30 (25) GeV and|η| < 2.5 in the dilepton (lep- ton+jets) channel. The ratio of the scalar sum of the pT of tracks associated with the jet and the primary vertex to the scalar sum of the pT of all tracks asso- ciated with the jet must be at least 0.75 to reject jets from pile-up interactions. Muons overlapping with jets within∆R < 0.4 are removed and the jet is kept. The closest jet overlapping with electrons within∆R <0.2 is removed and the electron is kept. If electrons sub- sequently still overlap with any remaining jet within
∆R < 0.4, they are removed. Information about jets containing b quarks [59] is also used in the lepton+jets channel. A neural network combines lifetime-related in- formation reconstructed from the tracks associated with each jet. At the chosen working point, the b-tagging al- gorithm has an efficiency of 70% (20%/0.7%) for jets containing b quarks (c quarks/light quarks or gluons) in a simulated t¯t sample.
The missing transverse momentum ETmiss is calcu- lated using topological clusters of energy deposits in the calorimeter and corrected for the presence of muons [60].
5. Event selection in the dilepton channel
The event selection and background modelling in the dilepton channel is the same as in the ATLAS mea- surement of the single top-quark production in the Wt- channel [4]. Candidate events must contain exactly two leptons (ee,µµor eµ) with opposite electric charge and exactly one jet. At least one of the leptons in each event must match the corresponding trigger-level object. No 3
b-tagging requirement is made since the dominant back- ground from t¯t production also contains b quarks. The EmissT is required to be greater than 50 GeV. In the ee andµµchannels, the invariant mass of the lepton pair, mℓℓ, is required to be outside the Z boson mass win- dow: mℓℓ < 81 GeV or mℓℓ > 101 GeV. In all three channels, the Z→ττbackground is reduced by a dedi- cated veto, which requires the sum of the azimuthal an- gle differences between each lepton and the EmissT vector to be greater than 2.5 rad. After all cuts, the acceptance for signal events with mb∗ = 800 GeV in which both W bosons decay leptonically (to either e orµ) is 26%.
The main background, accounting for 63% of the to- tal, comes from t¯t events in which one of the two jets originating from b quarks is not detected. The second largest background is from SM Wt production, which has the same final state as the b∗-quark signal, and ac- counts for 13% of the total background. Diboson events produced in association with jets account for 12% of the total background. With the exception of single- and di- boson samples, these backgrounds are taken from NLO simulation and are normalised to their NNLO theoret- ical predictions. Drell–Yan (DY) events contribute a small background of 7.3% to the sum of ee andµµchan- nel events. The events are taken from the simulation and normalised to data using a two-dimensional side- band region with low EmissT and/or mℓℓ outside of the Z boson mass window [4]. The contribution fromττ final states, where bothτleptons decay leptonically, is estimated from simulated samples, with the normalisa- tion checked in an orthogonal data sample obtained by reversing the Z →τ+τ−veto cut described above. Z → τ+τ−events account for 0.7% of the total background.
The small background from jets that are misidentified as primary leptons and from non-prompt leptons (fake dileptons) is modelled and normalised using data [61].
It accounts for 4% of the background.
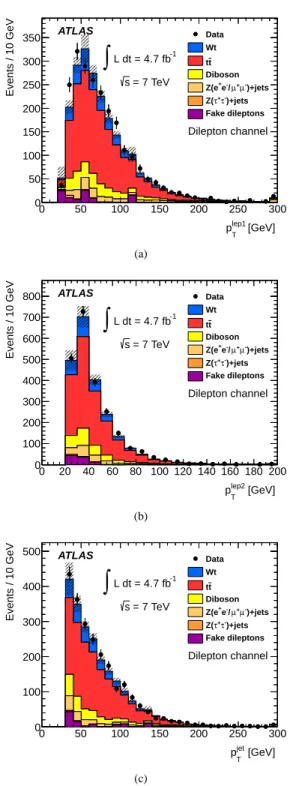
The predicted event yields for the backgrounds and signal at a few mass points are compared to data in Ta- ble 1. The pTdistributions of the two leptons and the jet are shown in Fig. 2.
A discriminating variable that separates the signal from the backgrounds is HT, the scalar sum of the trans- verse momenta of the leptons, jet and ETmiss. The HT
distribution is shown in Fig. 3.
6. Event selection in the lepton+jets channel The analysis in the lepton+jets channel follows the same background modelling strategy as the cross- section measurement for single top-quark production in
[GeV]
lep1
pT
0 50 100 150 200 250 300
Events / 10 GeV
0 50 100 150 200 250 300
350 Data
Wt t t Diboson
)+jets µ-
µ+ -/
+e Z(e
)+jets τ-
τ+
Z(
Fake dileptons L dt = 4.7 fb-1
∫
ATLAS
= 7 TeV s
Dilepton channel
(a)
[GeV]
lep2
pT
0 20 40 60 80 100 120 140 160 180 200
Events / 10 GeV
0 100 200 300 400 500 600 700
800 Data
Wt t t Diboson
)+jets µ-
µ+ -/
+e Z(e
)+jets τ-
τ+
Z(
Fake dileptons L dt = 4.7 fb-1
∫
ATLAS
= 7 TeV s
Dilepton channel
(b)
[GeV]
jet
pT
0 50 100 150 200 250 300
Events / 10 GeV
0 100 200 300 400
500 Data
Wt t t Diboson
)+jets µ-
µ+ -/
+e Z(e
)+jets τ-
τ+
Z(
Fake dileptons L dt = 4.7 fb-1
∫
ATLAS
= 7 TeV s
Dilepton channel
(c)
Figure 2: Kinematic distributions comparing data to predictions in the dilepton channel for (a) the leading lepton plep1T , (b) the sub-leading lepton plep2T and (c) the jet pjetT. The hatched band shows the uncer- tainty due to the background normalisation. The last bin includes overflows.
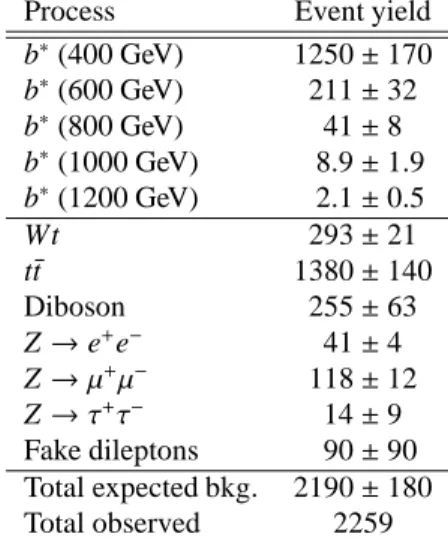
Table 1: Observed and predicted event yields in the dilepton channel with normalisation uncertainties. The signal yields are calculated with κbL=gL=1 andκbR=gR=0.
Process Event yield
b∗(400 GeV) 1250±170 b∗(600 GeV) 211±32 b∗(800 GeV) 41±8 b∗(1000 GeV) 8.9±1.9 b∗(1200 GeV) 2.1±0.5
Wt 293±21
t¯t 1380±140
Diboson 255±63
Z→e+e− 41±4
Z→µ+µ− 118±12
Z→τ+τ− 14±9
Fake dileptons 90±90 Total expected bkg. 2190±180 Total observed 2259
[GeV]
HT
0 500 1000 1500
Events / GeV
10-3
10-2
10-1
1 10
Data b* (800 GeV) Wt
t t Diboson
)+jets µ-
µ+ -/
+e Z(e
)+jets τ-
τ+
Z(
Fake dileptons L dt = 4.7 fb-1
∫
ATLAS
= 7 TeV s
Dilepton channel
Figure 3: HTdistribution for data and background expectation for the dilepton channel. The hatched band shows the uncertainty due to the background normalisation. The signal for a b∗-quark mass of 800 GeV is also shown.
the t-channel [2]. Events are required to have either ex- actly one muon and EmissT >25 GeV or exactly one elec- tron and EmissT > 30 GeV, as well as exactly three jets with pT > 25 GeV. Exactly one of the jets is required to be b-tagged to reduce backgrounds. The lepton must also match the corresponding trigger object. Additional requirements are made to reject multijet events, which tend to have low EmissT and a low transverse mass2of the lepton–ETmisssystem, mWT. In the muon channel events are required to have mWT +EmissT > 60 GeV, while in the electron channel a requirement of mWT > 30 GeV is made. The acceptance for signal events with mb∗ = 800 GeV in which one of the W bosons decays leptoni- cally (e orµ) and the other hadronically is 9%.
In this channel, one of the largest backgrounds is W+jets production for which the normalisation and flavour composition (the heavy-flavour fraction, HF, includes b quarks and c quarks) are derived from data [62]. The overall normalisation is determined from the charge asymmetry between W+and W−production in three-jet events without the b-tag requirement. The flavour composition is determined in two-jet events by comparing the predicted W+jets yields to data with and without a b-tag requirement. The resulting normali- sation and flavour scale factors are then applied to b- tagged W+3-jets events. About 37% of the total back- ground comes from W+jets events, including 28% from events with heavy flavour.
Backgrounds from t¯t yield 41% of the total back- ground and single top-quark production in the t-, s- and Wt-channel 9%. The multijet background is obtained using a data-based approach by comparing the num- bers of events passing loose and tight lepton identifi- cation criteria [63]. It accounts for 9% of the total back- ground. Smaller backgrounds from Z+jets and diboson processes are normalised to their theoretical predictions and contribute 4%.
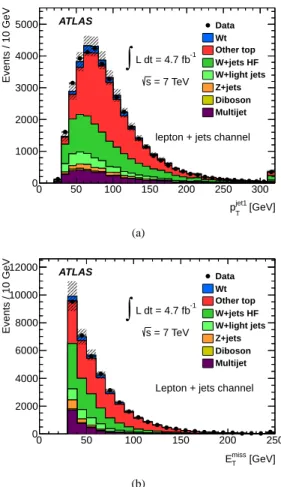
The predicted event yields are compared to data in Table 2. The distributions of the pTof the highest-pTjet and EmissT are shown in Fig. 4.
In the lepton+jets channel it is possible to reconstruct the candidate b∗-quark mass from the decay products.
The only missing information is the neutrino longitudi- nal momentum, which is set to zero. The resulting re- constructed mass provides good discrimination between background and signal, as shown in Fig. 5.
2The transverse mass, mWT, is calculated from the lepton transverse momentum plepT and the difference of the azimuthal angle, ∆φ, between the ETmiss and plepT vector as mWT = q
2EmissT plepT (1−cos(∆φ(EmissT ,plepT )))
5
[GeV]
jet1
pT
0 50 100 150 200 250 300
Events / 10 GeV
0 1000 2000 3000 4000
5000 ATLAS
= 7 TeV s L dt = 4.7 fb-1
∫
lepton + jets channel Data Wt Other top W+jets HF W+light jets Z+jets Diboson Multijet
(a)
[GeV]
miss
ET
0 50 100 150 200 250
Events / 10 GeV
0 2000 4000 6000 8000 10000
12000 ATLAS
= 7 TeV s L dt = 4.7 fb-1
∫
Lepton + jets channel Data Wt Other top W+jets HF W+light jets Z+jets Diboson Multijet
(b)
Figure 4: Kinematic distributions comparing data to predictions in the lepton+jets channel for (a) the pjet1T of the highest-pTjet and (b) EmissT .
“Other top” includes t¯t, s- and t-channel single top-quark production.
The hatched band shows the uncertainty due to the background nor- malisation. The last bin includes overflows.
reconstructed mass [GeV]
0 400 800 1200 1600 2000
Events / GeV
10-1
1 10 102
ATLAS
L dt = 4.7 fb-1
∫
Lepton + jets channel
= 7 TeV s
Data b’ (800 GeV) Wt Other top W+jets HF W+light jets Z+jets Diboson Multijet
Figure 5: Reconstructed mass distribution for data and background expectation for the lepton+jets channel. “Other top” includes t¯t, s- and t-channel single top-quark production. The hatched band shows the uncertainty due to the background normalisation. The signal for a mass of 800 GeV is also shown. The last bin includes overflows.
Table 2: Observed and expected event yields in the lepton+jets chan- nel with normalisation uncertainties. The signal yields are calculated withκbL=gL=1 andκbR=gR=0.
Process Event yield
b∗(400 GeV) 12100±1600 b∗(600 GeV) 1950±300
b∗(800 GeV) 370±70
b∗(1000 GeV) 79±17
b∗(1200 GeV) 20±5
Wt 1660±120
single top s,t-channel 1960±140
t¯t 15700±1600
W+light jets 3200±400
W+jets HF 10900±1400
Diboson 327±16
Z+jets 1300±800
Multijet 3500±1700
Total expected bkg. 38500±2900
Total observed 38175
7. Systematic uncertainties
Systematic uncertainties affecting the signal accep- tance and the background normalisation are consid- ered, together with uncertainties affecting the shape of the discriminant distributions. The main experimental source of systematic uncertainty comes from the lim- ited knowledge of the jet energy scale [58], which car- ries an uncertainty of 2–7% parameterised as a function of jet pT andη. The presence of a b quark in the jet adds an additional uncertainty of 2–5% to the jet en- ergy scale uncertainty, depending on the jet pT. Other jet-related uncertainty sources are the jet energy reso- lution, jet reconstruction efficiency and b-tagging ef- ficiency [59]. Lepton-related uncertainties come from trigger and identification efficiencies as well as the lep- ton energy scale and resolution. Event-related uncer- tainties are due to the modelling of multiple proton- proton interactions and the underlying event as well as ETmiss[60]. The uncertainty on the integrated luminosity is 3.9% [31, 32].
Simulation uncertainties include modelling of the hard process, parton shower and hadronisation, and initial- and final-state radiation. These have been as- sessed for the t¯t background events by comparing dif- ferent generators (Powheg and MC@NLO), different shower models (Pythiaand Herwig), and for t¯t and sig- nal events different settings for the amount of additional radiation [64]. Other sources of theoretical uncertainty include the normalisation for t¯t (+7%−10%) [47, 65–67], sin-
gle top-quark (±7%) [48–50] and diboson (±5% with an additional 24% per extra jet) production [61], as well as the choice of PDF. The latter was assessed using the CT10 [27], MRST [28] and NNPDF [29] sets.
Additional uncertainties affect the data-driven back- ground estimation. The uncertainty on the DY back- ground normalisation in the dilepton channel is 10%
for ee andµµ final states and 60% forττ final states.
The uncertainty on the fake-dileptons normalisation in the dilepton channel is 100%. The uncertainty on the W+jets normalisation in the lepton+jets channel is 13%.
The W+jets flavour composition has two additional un- certainties: the HF contribution has a relative uncer- tainty of 6%, and the Wbb/WHFratio has an uncertainty of 17%. The multijet background normalisation in the lepton+jets channel has an uncertainty of 50%.
8. Statistical analysis
Both the HT distribution in the dilepton channel and the reconstructed mass distribution in the lepton+jets channel show good agreement between the data and the background model. These two discriminants are used to set limits on the b∗-quark signal using a Bayesian anal- ysis technique [68]. The likelihood function is defined as
L(data|σb∗)=Y
k
µnkke−µk nk!
Y
i
Gi, (3)
where k is the index of the discriminant template bin, running over both analysis channels;µk=sk+bkis the sum of predicted signal and background yields; nkis the observed yield and Giis a Gaussian prior for the ith sys- tematic uncertainty. A flat prior is assumed for the sig- nal cross-section. Upper limits on the b∗-quark produc- tion cross-section times branching ratio to Wt are set at the 95% credibility level (CL) for a series of b∗masses at 100 GeV intervals.
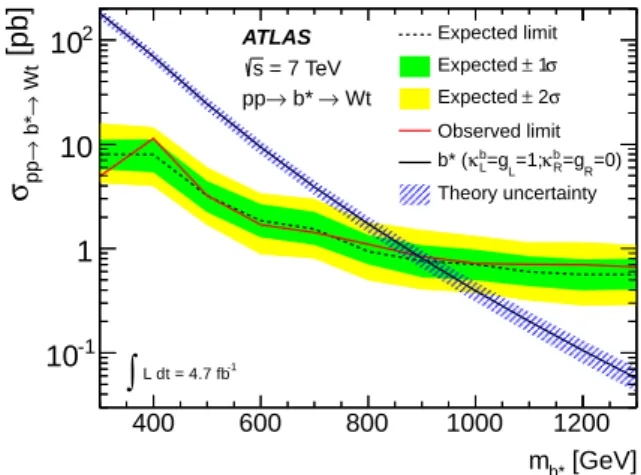
The observed and expected cross-section limits as a function of the b∗-quark mass for the left-handed cou- pling scenario (κbL = gL = 1 and κRb = gR = 0) are shown in Fig. 6, where the expected limit and its un- certainty are derived from ensembles of background- only pseudo-datasets. The intersection of the theoret- ical cross-section and the observed (expected) cross- section limit defines the observed (expected) b∗-quark mass limit. The observed lower limit on the b∗-quark mass for this left-handed coupling scenario is 870 GeV with an expectation of 910 GeV. When considering only the dilepton channel, the observed (expected) limit on the b∗-quark mass is 800 GeV (820 GeV); for the lep- ton+jets channel, the limits are 800 GeV (830 GeV).
[GeV]
mb*
400 600 800 1000 1200
[pb] Wt→ b*→ppσ
10-1
1 10
102 Expected limit
σ
± 1 Expected
σ
± 2 Expected Observed limit
R=0)
R=g κb L=1;
L=g κb
b* (
Theory uncertainty ATLAS
→ Wt
→ b*
pp = 7 TeV s
L dt = 4.7 fb-1
∫
Figure 6: Expected and observed limits at the 95% CL as a function of the b∗-quark mass. Also shown is the theory prediction for b∗-quark production with couplingsκbL=gL=1 andκbR=gR =0, including PDF and scale uncertainties.
Limits are also computed for models with right- handed and vector-like couplings of the b∗quark. Set- ting κbL = gL = 0 and κbR = gR = 1, the observed lower mass limit is 920 GeV with an expected limit of 950 GeV. SettingκbL=κbR =gL=gR=1, the observed lower mass limit is 1030 GeV with an expected limit of 1030 GeV.
At each mass point, the corresponding cross section is parameterised as a function of the couplingsκbL,R and gL,R in order to extract coupling limits in each of the three b∗-quark coupling scenarios. The resulting limit contours are shown in Fig. 7. The coupling limits in- crease as the theoretical cross-section decreases with b∗ mass, except for the region between 400 GeV and 500 GeV where the backgrounds decrease rapidly with increasing mass (see Figs. 3 and 5).
9. Summary
A search for a singly produced excited b∗-quark in 4.7 fb−1 of data collected with the ATLAS detector in pp collisions at √s=7 TeV has been presented. This is the first search for excited-quarks coupling to the third generation. It considers the dilepton and lepton+jets fi- nal states. Limits are computed as a function of the b∗gb and b∗Wt couplings in three different scenarios. For purely left-handed couplings and unit strength chromo- magnetic coupling, b∗quarks with mass below 870 GeV are excluded at the 95% credibility level.
7
gL
-0.2 0 0.2 0.4 0.6 0.8 1
Lbκ
0 0.1 0.2 0.3 0.4 0.5 0.6 0.7 0.8 0.9 1
ATLAS 95% CL limit
L dt = 4.7 fb-1
∫
= 7 TeV;
s
Wt; Left-handed b*-quarks
→
→ b*
pp [GeV]
mb*
300 400 500 600 700 800
(a)
gR
-0.2 0 0.2 0.4 0.6 0.8 1
Rbκ
0 0.1 0.2 0.3 0.4 0.5 0.6 0.7 0.8 0.9 1
ATLAS 95% CL limit
L dt = 4.7 fb-1
∫
= 7 TeV;
s
Wt; Right-handed b*-quarks
→
→ b*
pp [GeV]
mb*
300 400 500 600 700 800 900
(b)
gL/R
-0.2 0 0.2 0.4 0.6 0.8 1
L/Rbκ
0 0.1 0.2 0.3 0.4 0.5 0.6 0.7 0.8 0.9 1
ATLAS 95% CL limit
L dt = 4.7 fb-1
∫
= 7 TeV;
s
Wt; Vector-like b*-quarks
→
→ b*
pp [GeV]
mb*
300 400 500 600 700 800 900 1000
(c)
Figure 7: Limit contours at the 95% CL as a function of the coupling parameters for several different b∗-quark masses, for (a) left-handed b∗quarks, (b) right-handed b∗quarks and (c) vector-like b∗quarks.
10. Acknowledgements
We thank CERN for the very successful operation of the LHC, as well as the support stafffrom our institu- tions without whom ATLAS could not be operated effi- ciently.
We acknowledge the support of ANPCyT, Argentina;
YerPhI, Armenia; ARC, Australia; BMWF and FWF, Austria; ANAS, Azerbaijan; SSTC, Belarus; CNPq and FAPESP, Brazil; NSERC, NRC and CFI, Canada;
CERN; CONICYT, Chile; CAS, MOST and NSFC, China; COLCIENCIAS, Colombia; MSMT CR, MPO CR and VSC CR, Czech Republic; DNRF, DNSRC and Lundbeck Foundation, Denmark; EPLANET, ERC and NSRF, European Union; IN2P3-CNRS, CEA- DSM/IRFU, France; GNSF, Georgia; BMBF, DFG, HGF, MPG and AvH Foundation, Germany; GSRT and NSRF, Greece; ISF, MINERVA, GIF, DIP and Benoziyo Center, Israel; INFN, Italy; MEXT and JSPS, Japan;
CNRST, Morocco; FOM and NWO, Netherlands; BRF and RCN, Norway; MNiSW, Poland; GRICES and FCT, Portugal; MERYS (MECTS), Romania; MES of Russia and ROSATOM, Russian Federation; JINR;
MSTD, Serbia; MSSR, Slovakia; ARRS and MVZT, Slovenia; DST/NRF, South Africa; MICINN, Spain;
SRC and Wallenberg Foundation, Sweden; SER, SNSF and Cantons of Bern and Geneva, Switzerland; NSC, Taiwan; TAEK, Turkey; STFC, the Royal Society and Leverhulme Trust, United Kingdom; DOE and NSF, United States of America.
The crucial computing support from all WLCG part- ners is acknowledged gratefully, in particular from CERN and the ATLAS Tier-1 facilities at TRIUMF (Canada), NDGF (Denmark, Norway, Sweden), CC- IN2P3 (France), KIT/GridKA (Germany), INFN-CNAF (Italy), NL-T1 (Netherlands), PIC (Spain), ASGC (Tai- wan), RAL (UK) and BNL (USA) and in the Tier-2 fa- cilities worldwide.
References
[1] T. M. P. Tait and C. P. Yuan, Single top quark production as a window to physics beyond the standard model, Phys. Rev. D 63 (2000) 014018,arXiv:hep-ph/0007298.
[2] ATLAS Collaboration, Measurement of the t-channel single top-quark production cross section in pp collisions at
√s=7 TeV with the ATLAS detector, Physics Letters B 717 (2012) 330–350,arXiv:1205.3130 [hep-ex].
[3] CMS Collaboration, Measurement of the single-top-quark t-channel cross section in pp collisions at√s=7 TeV, arXiv:1209.4533 [hep-ex]. Submitted to JHEP.
[4] ATLAS Collaboration, Evidence for the associated production of a W boson and a top quark in ATLAS at√
s=7 TeV, Phys.
Lett. B 716 (2012) 142,arXiv:1205.5764 [hep-ex].