Department of Physics
Master Thesis in Physics
Investigation of PEN as a Scintillator for Low Background Experiments:
Characterisation of Light Yield Properties
Author:
Thesis Supervisor:
Thesis Reviewer:
Thesis Co-Advisor:
Thesis Submission Date:
Thomas Kraetzschmar PD Dr. Béla Majorovits Prof. Dr. Stefan Schönert Dr. Elena Sala
April 30, 2018
Acknowledgements
I would like to express my gratitude to my thesis advisor, PD Dr. Béla Majorovits of the Max Planck Insitute for Physics (Werner-Heisenberg In- situte), for offering me this interesting thesis topic and for his guidance and support throughout the thesis. I also thank Prof. Dr. Schönert for accepting to be the co-advisor and second referee for my thesis, and his valuable advice given in the meetings we had.
My special gratitude also goes to my thesis co-advisor Dr. Elena Sala, who acquainted me with particle detectors and gave valuable advice through- out the thesis.
Another great experience was to work with the research groups at MPP, the GERDA group and the Future Detectors. I always appreciated the friendship and cooperation of the group members. Many thanks to everyone who has provided feedback on ideas and/or drafts of this thesis.
Abstract
Polyethylene Naphthalene (PEN) presently attracts the interest of vari- ous groups as a relatively cheap, radio-pure scintillating material, which can be moulded in arbitrary geometries. Various potential application fields, spanning from low-background experiments to high-energy physics calorimeters to potential use in education could profit from the use of PEN.
The light output of PEN as custom-made scintillator is not yet well under- stood. The goal of this thesis was the investigation of optical properties of PEN.
Three dedicated setups were used, two of which had to be built and characterised as part of this master thesis. A photospectrometer setup for measuring the spectral shape and light output of different samples was installed, optimised, and characterised. For light output measurements, a setup with a photomultiplier tube (PMT) was built and first measurements were performed. The test of temperature dependence of PEN light output was conducted in an available experimental setup.
The measurements with the spectrometer showed, that some moulding parameters influence the light output. Using a PMT setup, it could be demonstrated that PEN tiles can be used with similar efficiency as standard BC408 scintillator tiles for veto purposes. Also, clear evidence for increasing light output at lower temperatures could be found.
Contents
1 Introduction 1
2 Physics Introduction 3
2.1 The Matter-Antimatter Problem . . . 3
2.2 Beyond the Standard Model: Majorana Particles . . . 3
2.3 Investigating the Nature of Neutrinos . . . 4
2.3.1 Neutrinoless Double-Beta Decay . . . 6
3 Low Background Experiments 9 3.1 Background Contributing Components . . . 9
3.2 GERDA and LEGEND . . . 10
4 Interaction of Radiation with Matter 13 4.1 Charged Particle Radiation . . . 13
4.1.1 Heavy Charged Particle Radiation . . . 13
4.1.2 Lepton Radiation . . . 14
4.1.3 Energy Loss Distributions in Matter . . . 14
4.2 Uncharged Particle Radiation . . . 15
4.2.1 Gamma Ray Radiation . . . 15
4.2.2 Neutron Radiation . . . 17
5 Generation of Scintillation Light 19 5.1 Organic Scintillators . . . 19
5.1.1 Electronic Structure of Organic Molecules . . . 19
5.2 Luminescence . . . 21
6 Light Detection Methods 25 6.1 Working Principle of a Spectrometer . . . 25
6.1.1 Spectrometer . . . 25
6.1.2 CCD Physics . . . 26
6.2 Working Principle of a PMT . . . 26
6.3 Working Principle of a SiPM . . . 27
7 Light Spectrum Measurements 29 7.1 Moulding Parameters to be Investigated . . . 29
7.2 Experimental Idea and Boundary Criteria . . . 31
7.3 Experiment Setup . . . 31 iii
7.4.2 Understanding UV Lamp Influences . . . 34
7.4.3 Setup Geometry . . . 34
7.4.4 Defining of Parameters of a Standard Setup . . . 37
7.4.5 Setup for Attenuation Length Study . . . 39
7.5 Standard Measurement Procedure and Reproducibility . . . 41
7.5.1 Reproducibility . . . 41
7.6 Analysis Procedure . . . 42
7.6.1 Data Preprocessing . . . 42
7.6.2 Determination of Dependent Variable Values and Sta- tistical Uncertainties . . . 45
7.7 Results . . . 46
7.7.1 Attenuation Length Study . . . 46
7.7.2 Moulding Parameter Investigation . . . 48
7.8 Summary . . . 50
8 Light Output Measurements 51 8.1 Experimental Constraints . . . 51
8.2 Experimental Setup . . . 51
8.3 Experimentation - Light Output Measurements . . . 52
8.4 Sample Preparation . . . 53
8.5 Results . . . 53
8.5.1 Waveform Evaluation . . . 53
8.5.2 Characterising the Setup . . . 53
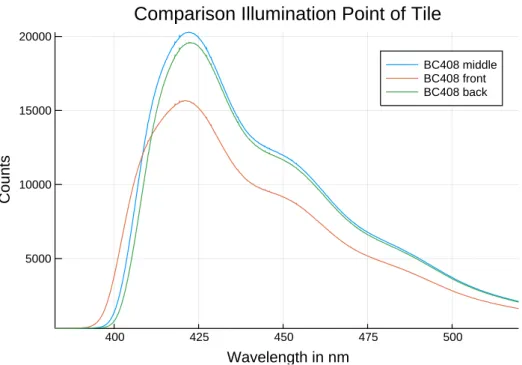
8.5.3 Scintillator Comparison . . . 54
9 Light Output for different Temperatures 57 9.1 Experiment Design . . . 57
9.2 Experimental Setup . . . 58
9.3 Data Acquisition . . . 59
9.3.1 Calibration . . . 61
9.4 Analysis . . . 61
9.4.1 Light Output as a Function of Temperature . . . 61
10 Conclusion 69
A Figures 77
List of Figures 82
List of Acronyms 83
Chapter 1 Introduction
Motivation: The matter-antimatter problem is one of the biggest yet to be solved mysteries in physics. As we believe based on our current under- standing of the formation of the universe, that there were equal parts of matter and antimatter right after the big bang, it is unclear how baryoge- nesis, the survival of matter over antimatter took place.
One of the possible solutions is the CP violating decay of Majorana neu- trinos, which are their own antiparticles. Neutrinoless double-beta decay can be used to test the Majorana nature of neutrinos, because it is only allowed if neutrinos are Majorana particles.
Since the lifetime of the postulated neutrinoless double-beta decay is very long, the event rate is extremely low. This makes quasi background- free experiments with high detector mass, such as the GERmanium Detec- tor Array (GERDA) experiment, necessary to search for this process with sufficient sensitivity. For the next generation experiment, the Large En- riched Germanium Experiment for Neutrinoless double-beta Decay (LEG- END), it is proposed to suppress the background even further. New tech- niques of background reduction and the optimisation of existing ones are necessary to achieve this goal. A common technique is the use of multi pur- pose materials, which fulfil the need of radio-purity, but can also be used for actively vetoing background radiation. In GERDA, most of the components used fulfil these requirements, except of the detector array’s structural ma- terial, made of ultra-pure copper and silicon. For LEGEND, the use of an ultra-pure, transparent, and active structural material could improve the background identification efficiency. Unfortunately, common scintillators are usually unsuitable as they do not fulfil the set requirements. A pos- sible candidate as structural material is Polyethylene naphthalate (PEN), a polyester polymer which is commonly used for everyday tools such as bottles or cups. Aside from its sturdy properties it also scintillates when exposed to radiation. It is widely used in industry, thus, its price is much lower compared to other scintillation materials. PEN could reduce the va- riety of materials for the detector array structure, using it as detector and structural material as well as copper wire isolations. It was shown that PEN is mechanically hard in cryogenic environments [Eck18] and PEN can
1
be laminated and used as an isolator for cables [BCG+13]. Furthermore, PEN is relatively radio pure. These properties make it interesting for the use in low background experiments, such as the LEGEND project.
Problem Statement: Since the goal is to use custom-made PEN in LEGEND, it is crucial to understand the scintillation properties of the ma- terial and how the customisation process influences the desired properties of light output and transparency, as well as radio-purity and mechanical hardness. Furthermore, it also should be possible to produce cups for the Ge detectors. Our project at the Max-Planck-Insitut for Physics in Munich is investigating the possibility of using Polyethylene naphthalate (PEN) for that purpose.
The main focus of this thesis was on the investigation of the light output properties. The first question, when considering a new scintillator material, is what the light spectrum of the emitted light looks like. Especially the peak wavelength is of interest, as it determines the possible light detectors which can be used. Second, the light output and pulse shapes when us- ing a common light detection system are of interest. At last, additional properties like the temperature or pressure dependence of the light output are also of interest. Since it is intended to use the material in cryogenic environments, the behaviour of the light output for different temperatures was investigated.
Approach: In order to answer the stated questions, three dedicated were used. Two of which were designed, implemented and characterised specifi- cally for this work. These setups were used for studying the light spectrum and the light output and behaviour of a common light detection system.
The last experiment, for studying the behaviour of the light output at dif- ferent temperatures, could be conducted in an existing setup, available at the institute.
Work Performed: The two setups for investigating the scintillation prop- erties of PEN were successfully implemented and characterised in the course of this thesis work. Light spectra of custom-made PEN were recorded and the peak wavelength was determined with a common value of 450 nm. For the customisation process of moulding, a moulding parameter investigation focusing on the influence of the moulding parameters on the light output was performed and two parameters influencing the light output were iden- tified. Furthermore, first pulses with a PMT were recorded revealing a long decay tail of the event pulse and the possibility of pulse shape discrimina- tion for PEN, and energy spectra of different scintillators were recorded.
At last, a clear indication of a temperature dependence of the light output was found, with an increase of light output for a decrease in temperature.
Chapter 2
Physics Introduction
2.1 The Matter-Antimatter Problem
In physics, the simplest questions to ask are often the hardest to answer.
One of these questions is: Why is there matter? When considering the standard model (SM), there is no reason why the observed amount of mat- ter should have formed in the early universe instead of being annihilated right after its production. We believe that baryons were formed in a pro- cess called baryogenesis, from a state of equal numbers of baryons and antibaryons. Otherwise, there would have been a highly fine-tuned initial condition, with 6.000.001 quarks for every 6.000.000 antiquarks. Empiri- cally, such a fine-tuning is very implausible in physics. Furthermore, the model of an inflation is well motivated by the observed features of the cosmic background [DNN08].
2.2 Beyond the Standard Model: Majorana Particles
For a dynamical generation of baryons, we have three criteria given by Sakharov [DNN08]:
1. Baryon number violation
2. Charge conjugation (C) and Charged conjugation Parity (CP) trans- formation violation
3. Out-of-equilibrium dynamics
These criteria are all found in the SM. However, none of the known mecha- nisms generates a large enough baryon asymmetry. This is pointing to new physics beyond the SM, which must extend the model with new sources of CP violation and either provide a departure from thermal equilibrium in addition to the electroweak phase transition (EWPT) or modify the EWPT itself. One of the favoured candidates introducing a new CP vio- lating source are Majorana neutrinos. Departure from thermal equilibrium
3
can occur for example during electroweak symmetry breaking. Majorana particles violate the lepton number as they have a Majorana mass and are their own antiparticle [DNN08].
In 1937 Ettore Majorana proposed "an essentially new theory for parti- cles without electric charge (neutrons and hypothetical neutrinos)" [Maj37].
In this theory the complex field Ψ(x) for Weyl-fermions is given by Ψ(x) = χ1+χ2
√2 (2.1)
with
χ1,2(x) = Ψ(x)±ΨC(x)
ñ2 (2.2)
fulfilling the Dirac equations, with the Dirac matrices γα:
(iγα∂α−m)χ1,2(x) = 0 (2.3) Additionally, χ1,2(x) also fulfils the Majorana condition with the charged conjugate operator C:
χ1,2(x) = χC1,2(x) =CχT1,2(x) (2.4) Here, χ1,2(x) indicates the field of a particle while χ1,2(x) indicates the field an antiparticle. It is possible to show that, for Majorana particles, the creation operator of particles and antiparticles are the same, which means that they are their own anti-particles [Bil10].
2.3 Investigating the Nature of Neutrinos
The neutrino is only weakly and gravitationally interacting, which is why it has earned the nickname "ghost particle". Its detection is technically chal- lenging, making it hard to measure its properties. First proposed by Pauli in 1911 in order to explain the continuous electron energy spectrum of the βdecay, it took decades until it could finally be measured in 1956 by Reines and Cowan with their famous "Poltergeist" experiment, using the inverse β decay [CRH+56]. In 1962, a second flavour state, the muon neutrino νµ, was found by Ledermann, Schwartz, and Steinberger [DGG+62] in the AGS Neutrino experiment at Brookhaven National Laboratory. Finally, in 2000 the DONUT experiment proved the existence of the tau neutrino ντ [KUA+01].
Since the "solar-neutrino problem", it is known that neutrinos are mas- sive particles, and not mass-less as assumed in the SM. Here, the flux of neu- trinos was measured and the one calculated from well understood processes in the sun did not coincide [BU88]. It turned out that the neutrinos are os- cillating, which means that they can change their flavour when propagating.
This was measured independently by experiments like Super-Kamiokande for atmospheric neutrinos and the Sudbury Neutrino Observatory (SNO) for solar neutrinos [F+98], [A+02].
CHAPTER 2. PHYSICS INTRODUCTION Page 5
The flavour eigenstates hνα|=hνe|,hνµ|,hντ|, and the mass eigenstates hνi| =,hν1|,hν2|,hν3| are not the same but superpositions of each other.
The mixing is determined by the unitary matrix U given by:
hνα|=X
i
Uαihνi| (2.5)
This rotation matrix is named PMNS matrix after Pontecorvo, Maki, Nak- agawa and Sakata [GGMS14]. It is an equivalent to the CKM matrix in the quark sector and can be parametrised with three mixing anglesθij and δCP the CP violating Dirac Phase. The entries of the PMNS matrix are denoted as follows:
U =
Ue1 Ue2 Ue3 Uµ1 Uµ2 Uµ3 Uτ1 Uτ2 Uτ3
(2.6)
With sij =sinθij and cij = cosθij the rotation in the state space is given by the rotation matrix R:
R=
c12c13 s12c13 s13e−iδCP
−s12c23−c12s13s23eiδCP c12c23−s12s13s23eiδCP c13s23 s12s23−c12s13c23eiδCP −c12s23−s12s13c23eiδCP c13c23
(2.7) Furthermore, if neutrinos are Majorana particles, two additional phases the CP violating phasesα1, α2, given by the phase matrix A in Equation 2.8, have to be considered.
A =
eiα1 0 0 eiα2 0
0 0 1
(2.8)
Finally, this gives the PMNS matrix stated in Equation 2.9 [GGMS14]:
U =R·A (2.9)
For a flavour state with energy E the probability that an oscillation has taken place with a change from flavour state α to a stateβ, at distance L from the source, is described by:
P(α→β, L, E) =X
kl
UαkUαl∗Uβk∗ Uβle
∆m2 kl
2E L (2.10)
This probability can be non-zero if the masses are not the same. With the mass squared difference∆m2kl and the neutrino energy E. On the one hand this means the neutrino mass squared differences are measurable in neutrino oscillation experiments [GGMS14], [AS09]. On the other hand oscillation experiments can not give information on the absolute masses m1,2,3.
M.S. Thesis Thomas Kraetzschmar April 30, 2018
By investigation of theβ decay, the effective electron neutrino massmνe can be measured in a direct way. The measured quantity is a superposition of the neutrino mass eigenstates given by:
hmβi= q
c212c213m21+s212c213m22+s213m23. (2.11) The KATRIN experiment aims to improve the limit given by one order of magnitude [EBB+18]. The energy released in a β decay, the Q-value, is known. This means that the upper endpoint of the electron energy spectrum of this decay is shifted bymβc2 with respect to the Q-value. The current upper limit mβ < 2eV was obtained by the Mainz and Troitsk experiments [K+05], [ABB+11].
It is also possible to constrain the absolute neutrino mass scale Σ =X
i
mi (2.12)
from cosmological measurements. Taking into consideration CMB mea- surements, model-dependent limits on structure formation can be given. A limit of Σ < 0.13 eV with a 95% confidence level [CNV16] can be deter- mined.
2.3.1 Neutrinoless Double-Beta Decay
All data of the experiments presented so far established a finite but very small mass of neutrinos, which cannot be explained in the SM. A possi- ble explanation could be given with the Majorana theory explained in the previous section. If one has a neutrino field νL, satisfying the Majorana conditions, one can allow for a mass term in the form of
LM =−1
2νLMLM(νL)c+h.c. (2.13) with MM being a complex3×3 matrix and h.c. being the hermitian con- jugated. This mass term is called Majorana mass term [Bil10].
For neutrinoless double-beta decay (0νββ) to occur a non-vanishing Ma- jorana neutrino mass is necessary, independent of the mechanism. Double- beta decay can in general be observed, if an isotope with(A, Z), the number of nucleiA and the number of protonsZ, has less binding energy than the isotope(A, Z±1)but more than the isotope (A, Z±2). In this case single β± decay is energetically forbidden while double β± decay is allowed. The Majorana nature would allow for the exchange of a neutrino as illustrated in Figure 2.1. This process would yield two electrons, but no neutrinos in the final state. Hence the total energy freed in this process, the Q-value, could be detected. An observation of double-beta decay would not only prove the Majorana nature of the neutrino, but it would also yield a deeper insight into the neutrino mass [O+14].
CHAPTER 2. PHYSICS INTRODUCTION Page 7
Figure 2.1: Feynman diagram illustrating a double-beta decay, on the left, and a neutrinoless double-beta decay, on the right [AEE08].
M.S. Thesis Thomas Kraetzschmar April 30, 2018
Chapter 3
Low Background Experiments
As examples for low background experiments, this chapter briefly surveys GERDA, an already operational0νββ-decay experiment, and LEGEND, a next generation 0νββ-decay experiment [The17] [A+17].
3.1 Background Contributing Components
Rare event physics experiments are searching for processes which have a very low event rate. Therefore, it is mandatory to measure in an almost background-free environment. In general, there are several sources of back- ground: cosmic radiation, contamination of radioactive isotopes in con- struction materials, and environmental radioactivity [The96].
In underground laboratories muons are the main contribution of cosmic radiation. They are produced in the atmosphere by primary cosmic rays and are very penetrating. While for most particles produced in hadronic cosmic ray showers a relatively shallow underground laboratory with about 15 meters of water equivalent is enough to shield them, it is necessary to go deep underground in order to reduce the muon flux by several orders of magnitude. Furthermore, muons can produce secondary radiation, such as neutrons, which also contributes to background [The96].
Placing an experiment in deep underground reduces the muon flux, but contamination of the surrounding material has still to be taken into account.
In most of earth’s building materials including stones and sand, there are primordial radioactive remnants of the nucleosynthesis the solar system was born from. The main contribution to the background are isotopes of Potassium: 40K, Thorium: 232Th, and Uranium: 235U. 232Th and 235U have long half lives, compared to the age of the universe, and decay chains and the decay of some of their daughters emit gammas in a wide energy spectrum. Amongst the isotopes produced in these decay chains Radon is a particular problem for a low level radiation experiment. Radon is a noble gas and can hence not be chemically bound when produced. Especially
222Rn is troublesome. Because of its comparably long half-life of 3.82 days, it can dissipate and spread in the experiment, leading to constantly renewed contamination [The96].
9
Using the GERmanium Detector Array (GERDA) experiment as an example, methods to reduce the background either by rate reduction or by other means are presented below. Furthermore, as a prospect for how to improve the background further in next generation experiments, some R&D for the Large Enriched Germanium Experiment for Neutrinoless double- beta Decay (LEGEND) is presented.
3.2 GERDA and LEGEND
The following section closely follows [The17]. The idea of GERDA and LEGEND is to operate high purity Germanium detectors enriched with the double beta decaying isotope76Ge, in a radio-pure cryogenic environment shielded from radiation outside the experiment and equipped with veto detectors for radiation events in the experiment. The elegance in GERDA is that most infrastructural components serve two goals. They act as shield of the detectors from radiation and veto radiation events in the experiment at the same time. Furthermore, the detectors themselves also serve as decay volume in which theββ-decay occurs.
In order to shield the GERDA experiment from cosmic muons, it is lo- cated at the Laboratori Nazionali del Gran Sasso (LNGS), an underground laboratory in Italy. It has an overburden of 3500 meters of water equiva- lent. Overburden is the distance, through which cosmic ray particles must pass in order to penetrate into the laboratory multiplied by the density of the material; it is stated in meters of water equivalent. The overburden at LNGS removes the hadronic components of cosmic ray showers and reduces the muon flux to 1.2 muons per (m2 h).
The detectors are placed in a cryostat surrounded by radiopure liquid Argon (LAr), cooling the Ge detector down to its operation temperature of less then 90 K. Additionally, 2 m of LAr shields the Ge detectors from external radiation and acts as a scintillator, i.e. it produces light when exposed to radiation. The cryostat itself is placed in a tank filled with ultrapure water that again acts as a shield from external radiation and as active material, thanks to the readout of Cherenkov light from muons passing through the experiment with PMTs. The muon veto is completed by three layers of plastic scintillator panels on top of the experiment. This experimental structure is illustrated in Figure 3.1 a).
The closer components are to the Ge detectors, the more effort needs to be devoted to selecting them to guarantee low levels of radioactive ma- terial. While the 66 photomultpliers (PMT) monitoring the water tank for Cherenkov light are well shielded, inside the cryostat for the LAr veto, low background PMTs have to be used in order to ensure low enough back- ground. These photomulipliers are part of the light collection system used in GERDA, as shown in Figure 3.1 b).
The light collection system of the LAr veto is located around the Ge detector array, depicted in Figure 3.1 c), and collects the scintillation light produced by energy deposits in LAr. It is instrumented with low back-
CHAPTER 3. LOW BACKGROUND EXPERIMENTS Page 11
Figure 3.1: a) Overview: (1) water tank with muon veto system PMTs (590m3, diameter 10 m), (2) LAr cryostat (64m3, diameter 4 m), (3) floor and roof of clean room, (4) lock, (5) glove box (6) plastic muon veto system;
b) LAr veto system: (1/5) bottom/top plate (diameter 49 cm) with 7/9 3" PMTs (R11065-10/20 MOD), low radioactivity of U and Th (<2 mBq/PMT), (2) fiber curtain (h 90 cm) coated with wavelength shifter, (3) optical couplers and SiPMs, (4) thin-walled (0.1mm) Cu cylinders (h 60 cm) covered with a Tyvek reflector on the inside (6) calibration source entering slot in top plate (7) slot for second of three calibration sources;
c) detector array: (1) Ge detectors arranged in 7 strings, (2) flexible bias and readout cables, (3) amplifiers;
d) detector module, view from bottom: (1) BEGe diode (2/3) signal/high voltage cables attached by (4) bronze clamps to (5) silicon support plate, (6) bond wire connections from diode to signal and high voltage cable, (7) Cu support rods.
Figure and caption cited from [The17].
M.S. Thesis Thomas Kraetzschmar April 30, 2018
ground PMTs and silicon photomultipliers (SiPM). The light collection system is made of a curtain of wavelength shifting fibers surrounding the Ge detector array from the side. There are read outs at both ends with SiPMs. At the top and bottom of the light collection system, 16 three-inch PMTs collect the scintillation light independently. The distance of the Ge detectors to each PMT is at least 0.7 m and hence enough to limit the detectable background of the PMTs intrinsic Th and U contamination.
The Ge detectors are connected to custom-made low-radioactivity charge- sensitive pre-amplifiers. In order to guarantee enough shielding, the ampli- fiers are placed 35 cm above the detectors, as illustrated in Figure 3.1 c).
The detectors are placed on an ultrapure silicon plate and are surrounded by scintillating nylon cylinders. These are needed to limit contamination of the detector surface by the LAr volume with 42K, which emerges in the decay of 42Ar. The detector array is held in place by strings made of ultrapure Copper.
In LEGEND, one of the ideas to reduce the background even further is to replace the inactive materials of the detector array such as Si and Cu with an active structural material.
Chapter 4
Interaction of Ionising Radiation with Matter
When considering radiation detection, the following types of radiation have to be distinguished [Bir64]:
1. Heavy charged particles: protons, heavy ions, and mesons 2. Leptons: mainly electrons or positrons and muons
3. Electromagnetic radiation 4. Neutrons
These radiation types are categorised into two groups which have funda- mentally different ways of interaction with a scintillation medium. Charged particle radiation can continuously interact through Coulomb force with the electrons and the nuclei of the medium. Because of this, the probability of detecting them is high. Electrically neutral particles are not influenced by the Coulomb force, thus are not hindered by the charge of the nucleus of the electron clouds and the detection probability is low as explained below.
4.1 Charged Particle Radiation
When considering charged particle radiation, the maximum transferred en- ergy in matter per event for a particle of mass m with kinetic energy Ekin is given by Equation 4.1, withmi being the mass of the incident particle of the medium.
∆Ekin = 4mi
mEkin (4.1)
4.1.1 Heavy Charged Particle Radiation
For heavy charged particles (HCPs) the following approximation holds:
∆Ekin ≈ 1 500Ekin 13
HCPs need many interactions to transfer a considerable amount of energy to the medium. The mean energy loss dE, along a path with the unit lengthdr is given by the Bethe-Bloch Equation:
dE
dr = 4πe4z2
mev2 N Z[ln2mev2
I −ln(1−β2)−β2] (4.2) wherez·eis the charge of the interacting particle –edenotes the electronic charge, z is an integer and indicates the number of charges – and v is the velocity of the particle with v = βc; c being the velocity of light. N and Z are the number of atoms and the atomic number and I is an empirical constant for a given homogeneous medium [Bir64] [Kno00].
At non-relativistic energies, Equation 4.2 is dominated by the overall 1/β2 factor, leading to a decrease of dE/dr for increasing velocity. The minimum is atv ≈0.95cand particles at this point are known asminimum ionizing particles (MIPs). For particles with energies beyondEv≈0.95c,1/β2 becomes almost constant anddE/dr increases again [Leo87].
4.1.2 Lepton Radiation
For low-energetic leptons, especially electrons, the energy loss in the medium has a lower rate than that of HCPs, but the energy loss per event is much higher leading to a even more tortuous path through the medium then for HCPs. Additionally to the Coulomb interactions, energy losses through electro magnetic (EM) radiation – mostly bremsstrahlung – are much more prominent and have to be taken into account, leading to a modified version of the energy depositions function [Kno00] [Bir64].
On the other hand high-energetic leptons, mostly cosmic muons, are commonly used as MIPs, which follow the energy deposition function de- scried by Equation 4.2. MIPs have an essentially straight path through the medium and only depositing a fraction of the their energy in the material [Leo87].
4.1.3 Energy Loss Distributions in Matter
One has to consider the actual energy deposition of charged particles in thin scintillators. Up until now all energy deposition functions treated the mean energy deposited in the material. Now we are interested in the amount of energy transfer per event. In a thick absorber it holds that Ni → ∞ the condition for the number of interactions is approximated well enough, which means that the Central Limit Theorem for the probability distribu- tion of energy deposition holds. The energy deposition is distributed Gaus- sian with the most probable energy deposited being at the mean. This is not true in thin absorbers. In thin scintillators the probability of a single event energy deposition is much greater then in thick absorbers, because Ni is much lower. The so-called Landau distribution f(x,∆) describes the complicated probability distribution function for energy deposited in the
CHAPTER 4. INTERACTION OF RADIATION WITH MATTER Page 15
material. It is given by:
f(x,∆) = Φ(λ)
ζ (4.3)
with ζ being the first order approximation of the mean energy loss given by Avogadros numberNa, the density of the mediumρ, and re2 = (e2/mc)2 with m being the mass of the particle:
ζ = 2πNar2emec2ρZ A
z β
2
r (4.4)
The universal function Φ(λ) is given by:
Φ(λ) = 1 π
Z ∞ 0
exp(−uln|u| −uλ) sin(πu)du (4.5) being only dependent on λ, which is given by:
λ= 1
ζ[∆−ζ(ln|ζ| −ln||+ 1 +C)] (4.6) with ∆ being the energy loss, Euler’s Constant C = 0.577. . . and ln||
given by:
ln||= ln
(1−β2)I2 2mc2β2
+β2 (4.7)
This distribution is valid if the ratio of the mean energy loss ∆¯ and the maximum energy transfer allowable in a single collisionWmax, given by:
κ=
∆¯
Wmax, (4.8)
fulfils the condition ofκ≤0.01[Leo87].
4.2 Uncharged Particle Radiation
4.2.1 Gamma Ray Radiation
EM radiation has three major interactions: photoelectric absorption, Comp- ton scattering, and pair production. For low-energetic photons, the pho- toelectric effect is the dominant interaction mechanism. With increasing energy the Compton effect becomes dominant until at approximately 5 MeV pair productions is most probable.
The fraction of incident photons interacting with the material, which yields the detection probability, is described by:
f = 1−exp(−µd) (4.9)
f is the detection efficiency, µ the linear attenuation coefficient, d is the thickness of the scintillator. With a thin scintillator, in the order of some
M.S. Thesis Thomas Kraetzschmar April 30, 2018
millimetres and the density of lead, and a gamma above 100 keV, the prob- ability is about 1%. This decreases several orders of magnitude for higher energies and lower densities of the scintillator material. From this, we can see that large structures of scintillator material are necessary to detect gamma rays efficiently [Bir64] [The96].
Photo Electric Absorption
The photoelectric absorption is an interaction in which the photon com- pletely disappears in an interaction with an atom in the medium. A photo- electron is ejected from the atom which absorbed the photon; the kinetic energy Ee of this photo electron is given by:
Ee =hν−Eb (4.10)
whereEbdenotes the binding energy which has to be overcome,his Planck’s constant andν is the frequency of the electromagnetic wave corresponding to the radiation. In this interaction, the photon does not interact with a single electron, but with the atom as a whole.
A secondary electron can be ejected and interact with the medium as described before. Furthermore the ionised atom refills its shell from which the electron was ejected. The refilling process emits a characteristic X-ray which again interacts with the medium, involving less tightly bound shells, close to the original incident site [Kno00].
Compton Scattering
When the gamma is Compton scattered, the photon transfers some portion of the energy to the recoil electron and is scattered away with an angle θ from the beam path. The energy transferred is dependent on θ:
hν0 = hν 1 + mhν
ec2(1−cosθ) (4.11) withν being the frequency of the incoming photon and ν0 the frequency of the scattered photon. The more energy the photon transfers, the more it gets deflected. Furthermore, the interaction probability is linearly depen- dent on the atomic numberZ, as it gives the available electrons of an atom with which interaction is possible [Kno00].
The angular distribution of scattered gamma rays is given by the Klein- Nishina formula [Kno00] and indicating the strong tendency of forward scattering.
Pair Production
If the photon energyEγ fulfils:
Eγ ≥2me (4.12)
CHAPTER 4. INTERACTION OF RADIATION WITH MATTER Page 17
pair production is possible. In this process, the gamma particle changes into an electron and a positron.
The kinetic energy Ekin of the decay products is given by:
Ekin =Eγ−2me (4.13)
Since there is a low probability of pair production until Eγ reaches several MeV this effect is confined to high-energetic gammas. Furthermore, pair production has a characteristic signal due to the positron annihilation in the medium [Kno00].
4.2.2 Neutron Radiation
Neutrons can reach the nucleus unhindered, as they are not electrically charged. If an interaction occurs, the neutron can get absorbed by the nucleus or alter its energy and direction. A nucleus can be in a highly excited state, after interacting with the neutron, leading to considerable secondary particle production. The detection efficiency is analogous to gamma radiation, with the necessity of dense or thick materials [Kno00]
[Bir64].
At last one also has to account for the response function of the detector, which can be approximated with a Gaussian. The two response functions in effect lead to a function called Langaussian. [Leo87]
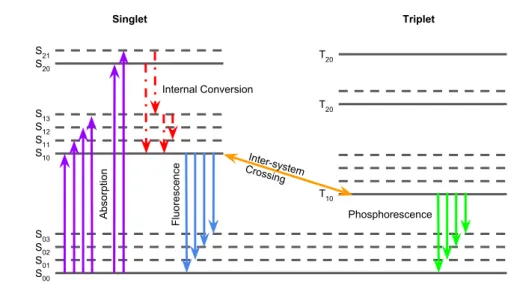
By radiation, energy can be transferred to the scintillator and an elec- tron gets excited from the ground state S00 to any vibrational state S1j0 , with j denoting a vibrational state ofS10. The electron can relax within the vibrational structure of S10 due to internal conversion. This energy can be transferred to neighbouring molecules and lost for any luminescence pro- cess. After relaxing within the S10 quasi-band the electron can only get to a lower state via luminescence. The actual scintillation process in this case would be fluorescence. Another relaxation that can happen is via phospho- rescence. In this case the electron is transferred via inter-system crossing into the T10 quasi-band. It relaxes to the vibrational ground state T10 and performs phosphorescence afterwards. The number of electrons transferred by inter-system crossing depends on the ionisation density, as this can be different for interactions of different types of radiation. The ratio of the fast fluorescence pulse to the slow phosphorescence pulse can be used for deter- mination of the type of incident radiation. Gamma excitation should have a much shorter waveform, as gammas do not enhance transitions to theT10 quasi-band, whereas α particles are expected to give a much longer wave- form, by enhancing the transition from S10 to T10 via inter-system crossing [Win86] [Ber71] [Ber71].
M.S. Thesis Thomas Kraetzschmar April 30, 2018
Chapter 5
Generation of Scintillation Light
One of the most common methods to measure ionizing radiation is detec- tion of scintillation light. Instead of detecting particles directly, we can observe the characteristics of the emitted light with a suitable detection system. Nowadays, a manifold of materials optimised for light emission exists. In the following, the underlying physics of these materials, in par- ticular organic scintillators, are described.
5.1 Organic Scintillators
Organic scintillators are aromatic hydrocarbon compounds consisting of linked or condensed benzene ring structures. When exposed to ionising radiation they can exhibit luminescence, i.e. emit light. Luminescence of organic molecules is not only used for scintillator applications but has var- ious other applications, e.g. dye lasers. The process of converting various types of radiation into detectable light is well understood [Leo87] [Win86].
The underlying fundamental principle of luminescence is explained in the following subsections. First, the electronic structure is described, which is necessary to understand the luminescence process explained afterwards.
Finally, the scintillation mechanism is explained.
5.1.1 Electronic Structure of Organic Molecules
In general, the luminescence of organic molecules is associated with com- pounds containing either benzene or triple-bonded carbon atoms in mo- lecules [Bir64]. Since PEN contains two benzene rings, only benzene is considered in the following description.
Carbon (C) atoms define the structure of organic molecules. In benzene, it is in a trigonal or sp2 hybridization state, which describes the mixing of the electronic states of carbon. One of the states of carbon, the p orbital, does not mix with another state. This is shown in Figure 5.1 on the left side by the dumbbell shapes. Three hybrid orbitals are produced by mixing one s and the remaining two p states. The bonds are known as σ-bonds, and they are in the same plane with an 120◦ angle to each other, leading
19
to the characteristic hexagonal structure of benzene, shown in Figure 5.1.
The unchangedpstate of the carbon is mirror-symmetric towards the plane
Figure 5.1: Molecular structure of benzene with the bonds displayed. The black lines between the Carbon atoms indicateσ-bonds. On the left the unchanged p states are displayed in yellow and blue dumbbell shapes. On the right these p states have formed a delocalisedπ orbital structure, indicated by the yellow and blue torus. [aut].
of the benzene and the associated orbital is known as aπ-orbitals. The six π-orbitals of the benzene Carbon atoms interact and form six π-molecular- orbitals which are completely delocalised, as illustrated in Figure 5.1 on the right side [Bir64].
In principle, the π-orbital structures are in singlet energy states, from now on denoted as S with S0 being the ground state, and triplet energy states, denoted as T with T1 being the lowest triplet state. Each electro- magnetic energy state has vibrational and rotational substates. The energy ratio of the level splitting is about 400:20:1 for the electrical, vibrational, and rotational states. A certain electric state is indicated by the first index, e.g. S0. The vibrational state is denoted by the second index number, eg.
S00 orS01, the energy levels are depicted in Figure 5.2.
For understanding energy levels the following model is helpful: (i)States are viewed as planes of energy and the nuclear coordinate. For each existing energy level there is a plane. (ii)An electron at an energy level can wander around on this plane freely. (iii) Vibrational and rotational energy levels have a much smaller energy splitting, the energy planes overlap more easily than electronic states. (iv) An overlap of energy planes allows the electron to transfer into another state, converting its energy into heat. Lower ener- getic states are in general more favourable as the electron has less energy and is more tightly bound. This process is called internal conversion. In complex systems such as organic molecules the overlap of energy planes is already high. Furthermore, in non-gaseous media broadening effects lead to an even greater overlap resulting in quasi-bands instead of strictly sep- arated states. In this setting, molecules excited to higher electronic states Snm, with n ≥ 1 and n, m ∈ N, dissipate their excess energy in the form of phonons, until the electron reaches the S10 state in Figure 5.2. The
CHAPTER 5. GENERATION OF SCINTILLATION LIGHT Page 21
S00 S01 S02 S03 S10 S11 S12 S13 S20 S21
T10 T20 T20
Singlet Triplet
Absorption Fluorescence Phosphorescence
Internal Conversion
Inter-system Crossing
Figure 5.2: Energy levels of an organic molecule withπ-electron structure. There are two possible configurations, singlet and triplet states. Electronic states are denoted by the first number of the index, the vibrational states are denoted with the second number. Possible transitions from one level to another are indicated with arrows. This figure was drawn following the description by [Bir64]
typical time constant is approximately 10−11s. Above considerations lead to the following simplified model of the organic molecule structure: There are basically three quasi-bands made out of the electronic states, a ground quasi-bandS00 and two excited quasi-bandsS10 andT10, which is made of all vibrational energy levels to which excitation is possible. An electron can get excited from S00 to S10 by ionising radiation and can be transferred to T10 via inter-system crossing [Ber71][Win86][Kno00][Kau57].
Next, the evaluation of the distribution of vibrational states in an equi- librium is of interest. The distribution of vibrational states taking part in fluorescence is given by:
n1 =n0g1 g0exp
− ∆E kBT
(5.1) The scintillator has a certain number of molecules in the vibrational states 0 and 1, denoted byn0 andn1. Furthermore, the two states have degeneracies g0 and g1 respectively. The energy difference between the two states is given by ∆E, and the energy of the system by the temperature T, and Boltzmann’s constant kB.
Equation 5.1 shows that at 300 K electrons which are able to participate in fluorescence are predominantly in the lowest vibrational state.
5.2 Luminescence
Luminescence is radiation emitted in a transition between the two lowest electronic states S10 or T10 and S00. Luminescence of a wavelength range
M.S. Thesis Thomas Kraetzschmar April 30, 2018
between 300nm and 650nm is defined as fluorescence and is caused by the deexcitation from a singlet excited state to the singlet ground state.
Furthermore there is phosphorescence, the deexcitation of a triplet state T10 to the ground state S00. For scintillators there is also a division by the type of excitation. Photoluminescence is luminescence after excitation by electromagnetic radiation. Scintillation is luminescence following excita- tion by ionizing particles in general. The time-dependent emission of light by a scintillator, given by the intensityI, dependent on the time t, for one of the lifetime parameter τ, is given by [Ber71] [Win86]:
I(t) =I(0) exp
− t τ
(5.2) Emitted light has less energy than the one with which it was excited.
This effect is called Stokes shift. By considering the electronic structure the processes involved become clear.
The governing selection rules for possible transitions from S10 or a longer-lived vibrational state of S1 to S0m are the Franck-Condan factors, with m denoting a vibrational state of S0. The setting is demonstrated in Figure 5.3. Two electronic states are considered with their vibrational lev- els. For each vibrational state the wave function is illustrated. A transition from one electrical state to another via photons is determined by the wave functions of the vibrational states. This is because a transition’s proba- bility is given by the overlap of the wave functions of the transfer levels.
Rapid transition occurs between states of the same multiplicity. In short, if the amplitudes of the wave functions of the transfer states are both at a maximum, it is much more likely that a transition occurs, than if there are at knots of the wave function [Kau57] [Ber71] [Bir64] [Win86].
The band structure effectively gives a four-level system, allowing for a continuous light output. The frequency spectrum is given by a Lorentz distribution. If enough thermal energy is present, the Lorentz distribution transforms to a Gaussian distribution [Win86].
In addition to fluorescence, there is another luminescence process: Phos- phorescence is a transition fromT10toS00. This inter-combination radiation has a lifetime orders of magnitudes larger then fluorescence, because it is a quantum-mechanically suppressed process. As shown in Figure 5.2, phos- phorescence only occurs when there are inter-system crossings. Once an electron has found its way into a triplet state, there are basically two types of phosphorescence:
(i) α-phosphorescence, or delayed fluorescence, in which the electron gains energy from phonons, lattice vibrations of the material, and is able to de- cay via fluorescence after an inter-system crossing from T10 to S10. (ii) β-phosphorescence with a direct transition from T10 toS0m. In both cases, the electron stays in the excited state orders of magnitudes longer then in the fluorescence case [Ber71].
After considering the mechanism of luminescence, it is worthwhile to have a short look at the structure of the molecules again. It has been demonstrated that the peak wavelength of the fluorescence is bigger, if the
CHAPTER 5. GENERATION OF SCINTILLATION LIGHT Page 23
Nuclear Coordinates
Energy
Energy Plane E1
Energy Plane E0 ν’ = 0
1
ν = 0 2
3 4 5
6
1 2
3 4
5 6
Figure 5.3: Franck-Condon diagram displaying the electric potential of a ground state E0 and an excited stateE1 and the levels and wave function of the vibra- tional states. The transitions, shown in the figure by the green and blue arrow, illustrate the overlap of the vibrational wave functions needed for a transition.
In contrast, the grey arrow shows an unprobable transition between two knots of vibrational wave functions [Sam14].
non-localized π-system of a particular class of compounds is made longer by substitution. This means a two-benzene ring structure emits at a longer wavelength range then a one-benzene structure. This can be validated by comparing the fluorescence of PEN and PET [Ber71].
M.S. Thesis Thomas Kraetzschmar April 30, 2018
Chapter 6
Light Detection Methods
Light and its detection play a major role in many fields of science. Albeit the applications are numerous, the fundamental principle of detection is mostly the same: A photon flux is converted into an electric signal which can be digitised. In the following, three light detection systems which are frequently used in science, including for this thesis work, are described.
6.1 Working Principle of a Spectrometer
The dispersion of light is the cornerstone of the field of spectral analysis, first conducted by Kirchhoff and Bunsen. These pioneers developed an apparatus with which it is possible to distinguish different wavelengths of light emitted by a medium. Through a thin slit light enters into the apparatus. The light rays are made parallel by an optical element. The parallelised light beam meets another optical element splitting the light into beams of different wavelengths. The dispersed light can then be analysed.
In the following, the working principle of the spectrometer used for this thesis work and its tool for detecting spectra are described [EGH+78].
6.1.1 Spectrometer
The spectrometer used in this thesis was a Czerny-Turner spectrograph.
This configuration uses two concave mirrors for aligning the light and a grating plate for splitting up the light into its wavelengths. As illustrated in Figure 6.1, the first mirror aligns the incoming light into parallel beams.
The dispersive element is a plane grating which reflects light of different wavelengths by different angles. The range of wavelengths detected can be varied by rotating the plane grating angle to select the required diffracted images. At last the second mirror focuses light on the sensor, a 1024 channel CCD camera which is detecting the spectra [Tec].
25
Figure 6.1: Scetch of a Czerny-Turner Spectrometer [Tec]
6.1.2 CCD Physics
Charge-coupled devices are silicon wafers divided into geometric light sen- sitive regions. These regions are metal oxide semiconductor (MOS) capaci- tors, operated as photodiodes. They are the fundamental light sensing unit, called pixels. The pixels are defined in the silicon matrix by an orthogonal grid of gates. The pixels capture image information as localised electrical charges, varying with light intensity. The dependency on charge and pho- tons is linear because a single electron hole pair is produced per photon, but quantum efficiency is varying for different wavelengths. The produced single electron per photon is called photoelectron. The MOS capacitor wells have a maximum capacity referred to as full well capacity. The full well capacity determines the maximum signal detectable. The most important noise source is shot noise due to the Poissonian distribution of the num- ber of photoelectrons coming from the the quantum nature of radiation [SFD17].
6.2 Working Principle of a PMT
The working mechanism is as follows: If a single photon hits the photocath- ode, an electron is emitted through photoelectric effect and accelerated to the first dynode of the electron multiplier section. This electron starts an avalanche or cascade of electrons produced in the dynode structure. Each electron hitting the dynode causes the emission of several electrons which are again accelerated to the next dynode. Cathode, dynodes and anode ef- fectively constitute a potential ladder with the cathode as its start and the anode as the charge collector providing a detectable current. In order to obtain enough amplification, PMTs are operated with high voltage [Leo87].
PMTs are prone to an intrinsic count rate not induced by photons, the
CHAPTER 6. LIGHT DETECTION METHODS Page 27
so called dark current and dark count [Leo87].
6.3 Working Principle of a SiPM
A silicon photomultiplier is a solid state photo detector. In response to a photon electron-hole pairs are created. Accelerated by the bias voltage, these create an avalanche that produces a current pulse which is several nanoseconds long and has a gain of approximately 105 to 106. SiPMs are divided into pixels. Each pixel, or microcell, is an avalanche photodiode (APD) connected in series with a quenching resistorRQ, which can be seen in the circuit diagram in Figure 6.2 on the right side. All microcells (pixels) are connected in parallel. Effectively, this gives an anode and a cathode for the SiPM and the output signal is given by the sum of all pixels.
Figure 6.2: Structure of a silicon photomultiplier (SiPM) [Pia17].
When a pixel fires, the resulting current causes a voltage drop overRQ. If RQ is chosen properly, the voltage drops below the breakdown voltage leading to a stop of the charge avalanche.
In an experiment a voltage drop is being measured. It is given by the number of electrons N released in a pixel, the elementary charge e, and the time ∆t, giving Equation 6.1:
U = N eR
∆t (6.1)
Since N, ∆t and R are constants of the system, the voltage signal for a single pixel is always the same.
The gain g is dependent on the capacity CJ of the APD’s avalanche region, the breakdown voltage of the SiPMVB, and the supply voltageVS, and given by:
g = (VB−VS)CJ
e (6.2)
Since VB is known to be temperature-dependent, this is also true for the gain. Fortunately, following Equation 6.2, the gain can be kept constant by adjusting VS such that the overvoltage is constant: (VB−VS) = const [Pia16].
The quantum efficiency (QE) of the SiPM is effectively temperature- dependent as it also depends on the overvoltage. The quantum efficiency
M.S. Thesis Thomas Kraetzschmar April 30, 2018
gives the probability that an incident photon can produce a charge carrier capable of triggering a Geiger discharge. The likelihood of a Geiger dis- charge is dependent on three factors: i) the strength of the electric field,ii) the avalanche regions width, andiii) collisional cross section of charge car- riers with phonons and the specific history of these interactions. The first two factors depend on the(VB−VS). That means by adjustingVS to keep the gain fixed, one also fixes the QE of the SiPM, which is an important property used in Chapter 9.
Noise sources in the SiPM are dark current and shot noise as described in the previous sections [Pia17].
Chapter 7
Light Spectrum Measurements
In the development of custom-made PEN samples it is essential to evaluate how the moulding process influences the scintillation properties of the ma- terial. An important property of a scintillator is the emitted light spectrum when hit by ionising radiation: In particular, the peak wavelength and the integrated value of the spectrum within the wavelength range to which the used detectors respond. The integrated value will from now on be denoted as light output. First the customisation process of PEN is descriped. Af- ter that, a description of the setup is given. Finally the results and the corresponding analysis and method are presented.
7.1 Moulding Parameters to be Investigated
Because it is planned to use custom-made PEN as a scintillator mate- rial, understanding the production process of arbitrary shapes via injec- tion moulding is essential. The production process has a great influence on the crystallinity, and crystallinity effects the light output, because the less amorph a polymer is the less transparent it gets, as the light passing through is scattered more. For scintillator purposes the transparency de- fines how much of the produced light is emitted from the material. At the Fraunhofer-Institut für Chemische Technologie (ICT) scintillator tiles were produced with injection moulding with varying moulding parameters. The parameters considered are:
• the humidity of the granulate
• the injection speed
• the tool temperature
• the in-tool cooling time of the tile
• the cooling time with and without water
For the injection speed, the effects of different tool temperatures and the humidities were also studied. There are 23 additional parameters for the
29
injection moulding process. Most of them are dependent on the moulding parameters stated above and are not considered further, as the goal was to obtain a better understanding of the overall parameter space, especially which of the above parameters influence the light output and in which way they do so. A similar study was done at the Technische Universität Dort- mund (TUD), with a screening plan to investigate the following moulding parameters:
1. Melt temperature 2. Mould temperature 3. Injection speed 4. Packing pressure 5. Packing time 6. Cooling time
The parameter investigation supervised by TUD included 12 samples, presented in Table 7.1, which were tested for transparency. The most trans- parent samples were then compared to the ones produced at ICT during this thesis.
Table 7.1: Parameters as stated in the text for the parameter investigation at TUD.
Parameter #: 1 in ◦C 2 in◦C 3 in cm3/s 4 in bar 5 in s 6 in s
Experiment: 1 280 30 10 1000 2 20
Experiment: 2 280 30 10 1000 2 40
Experiment: 3 280 30 50 1600 7 20
Experiment: 4 280 80 10 1600 7 20
Experiment: 5 280 80 50 1000 7 40
Experiment: 6 280 80 50 1600 2 40
Experiment: 7 310 30 50 1600 2 20
Experiment: 8 310 30 50 1000 7 40
Experiment: 9 310 30 10 1600 7 40
Experiment: 10 310 80 50 1000 2 20
Experiment: 11 310 80 10 1600 2 40
Experiment: 12 310 80 10 1000 7 20
In order to understand the influences on the light output the tiles where then measured in a spectrometer setup, one measurement for each of the 30 mm×30 mm surfaces, in order to understand possible influences of the tool used for the production. Results of the study of the ICT tiles are presented and compared to tiles produced at the Technische Universität Dortmund (TUD) in Section 7.7.2.
CHAPTER 7. LIGHT SPECTRUM MEASUREMENTS Page 31
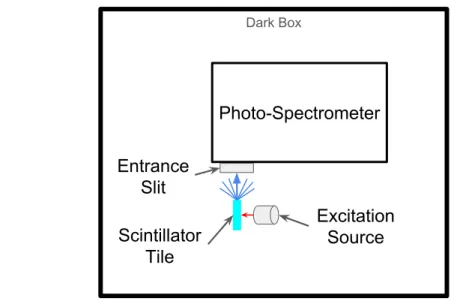
7.2 Experimental Idea and Boundary Criteria
The idea of the setup, for measuring the light spectrum of PEN, is sketched in Figure 7.1. It is to place a scintillator tile in front of a photo-spectrometer and to excite this tile with a ionising source in an environment of low light background.
Dark Box
Photo-Spectrometer Entrance
Slit Scintillator
Tile
Excitation Source
Figure 7.1: Spectrometer setup design sketch
The design of the setup needs to meet the following boundary condi- tions:
• To be fit for the 30 mm×30 mm×3 mm standard tiles from ICT and TUD.
• A well understood, stable, and safe-to-use ionising source.
• A photo-spectrometer which is optimised for wavelengths of 400 nm to 600 nm.
• Optimised arrangement for maximum light collection and minimal optical defects
• Temperature stability.
• Reproducibility of below 0.5 % uncertainty.
7.3 Experiment Setup
The scintillation light is measured by an Czerny-Turner spectrograph (An- dor Shamrock 303i) equipped with a CCD-camera (Andor DV420A OE) and a grating plate which allows to measure a wavelength interval of 405
M.S. Thesis Thomas Kraetzschmar April 30, 2018
nm to 542 nm with a resolution of 0.135 nm. The light enters the photo- spectrometer via a slit that is adjustable in width from 10 µm to 2.5 mm and height of 40 mm.
The CCD is cooled down to−60◦C in order to reduce the thermal noise of the sensor and is capable of detecting wavelengths in the range of 200 nm to 1050 nm.
Both the spectrometer and the camera are connected to a computer via USB; the computer is used to control the two devices and to record data.
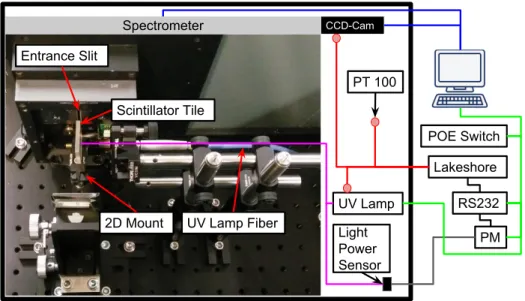
The samples can be mounted on a two-dimensional mount adjustable in height and distance with respect to the spectrometer with a precision of 0.1 mm. The positioning of mount and tile is shown in Figure 7.2. The distance between the entrance slit of the spectrometer and the sample can be between 6 mm and 30 mm.
Spectrometer CCD-Cam
Scintillator Tile Entrance Slit
2D Mount UV Lamp Fiber
UV Lamp
PM POE Switch
RS232 Lakeshore PT 100
Light Power Sensor
Figure 7.2: Spectrometer setup, with all relevant technical components. The USB connections are indicated by blue lines. Furthermore, the Ethernet connections, in green, are used to power devices and control them. The UV light is coupled in a splitting fibre (the blue line in the picture). The beam lines of the UV are indicated in pink, one of them is measured by a power meter, denoted as PM. Red circles illustrate PT100 sensors, measuring the temperature. They are connected to the readout, indicated as red lines.
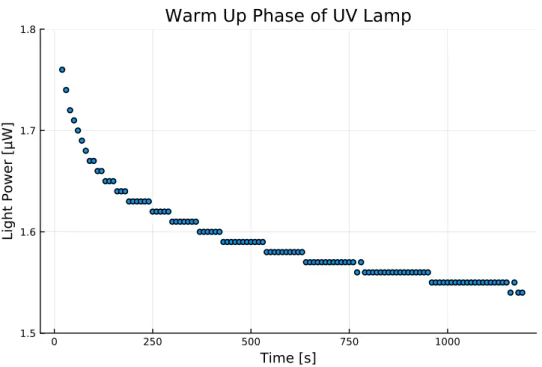
A fibre-coupled Ultra Violet (UV) light source (Ocean Optics LLS-255 LED) can be used to excite the scintillating tiles, with a centre wavelength of 255 nm and a full width half maximum (FWHM) of 10 nm.
The UV light is splitted evenly using a splitting fibre, in order to use one half of the light to excite the scintillation tile and the other half to monitor the stability of light output by a photo sensor (Newport 918D-UV-OD3R), read out by a power meter (Newport 1919R). The optical fibre can be positioned with a precision of 0.1 mm
The temperature of the setup is monitored with up to 4 PT100 sensors, each connected with a four-core cable to a Lakeshore readout device.
![Figure 2.1: Feynman diagram illustrating a double-beta decay, on the left, and a neutrinoless double-beta decay, on the right [AEE08].](https://thumb-eu.123doks.com/thumbv2/1library_info/4001256.1540482/15.892.185.684.459.736/figure-feynman-diagram-illustrating-double-decay-neutrinoless-double.webp)
![Figure 6.1: Scetch of a Czerny-Turner Spectrometer [Tec]](https://thumb-eu.123doks.com/thumbv2/1library_info/4001256.1540482/34.892.164.604.121.432/figure-scetch-of-a-czerny-turner-spectrometer-tec.webp)