ATLAS-CONF-2015-005 17March2015
ATLAS NOTE
ATLAS-CONF-2015-005
March 17, 2015
Study of the Higgs boson decaying to WW
∗produced in association with a weak boson with the ATLAS detector at the LHC
The ATLAS Collaboration Abstract
The search for Higgs boson production in association with aWor aZboson, in the decay channelH→WW∗, is performed with a data sample collected with the ATLAS detector at the LHC in proton-proton collisions at centre-of-mass energies √
s = 7 TeV and 8 TeV, corresponding to integrated luminosities of 4.5 fb−1and 20.3 fb−1, respectively. TheW H production mode is studied in three and two lepton final states, while a four lepton final state is used to search for ZH production. The observed significance is of 2.5 standard deviations while a significance of 0.9 standard deviations is expected for a Standard Model Higgs boson. The ratio of the combined W H andZH signal yield to the Standard Model expectation, µVH, is found to beµVH = 3.0+−1.11.3(stat.)+−0.71.0(sys.) for a Higgs boson mass of 125.36 GeV. TheW HandZHchannels are also combined with the gluon-gluon fusion and vector boson fusion production modes studied in the H → WW∗ → `ν`νdecay channel.
The results are interpreted in terms of scaling factors of the Higgs boson couplings to vector bosons (kV) and fermions (kF), the combined results are:|kV|=1.06+0.10−0.10,|kF|=0.85+0.26−0.20.
c
Copyright 2015 CERN for the benefit of the ATLAS Collaboration.
Reproduction of this article or parts of it is allowed as specified in the CC-BY-3.0 license.
1 Introduction
In the Standard Model (SM) of particle physics, the Brout-Englert-Higgs [1–3] mechanism induces the electroweak symmetry breaking that results in providing mass to elementary particles. The mechanism postulates the existence of an elementary scalar particle, the Higgs boson. The ATLAS and CMS collab- orations at the CERN Large Hadron Collider (LHC) have observed the Higgs boson with a mass (mH) of about 125 GeV [4,5]. Currently the measurement of the couplings of the Higgs boson to SM particles as well as its spin and CP quantum numbers [6–12] are essential tests of the SM. Higgs boson production in association with aWorZboson (respectively denoted asW HandZH), which are collectively referred to as V H associated production in the following, provides direct access to the Higgs boson couplings to gauge bosons. In particular, in theW H mode with the subsequentH→WW∗decay, the Higgs boson couples only toWbosons, both at the production and decay vertices.
Production of V H has been tested both at the Tevatron [13] and at the LHC [14–20], in events with leptons and either missing transverse momentum or two central jets. NoV H production has been observed so far.
In the present work, a search for Higgs boson production in association with a vector boson, with the subsequentH→WW∗decay, is presented. The analysed data were collected in the years 2011 and 2012 by the ATLAS experiment at centre-of-mass energies of √
s = 7 TeV and 8 TeV, respectively.
In the SM, for mH = 125 GeV, the cross sections of the W H andZH associated production modes, followed by theH→WW∗decay, are 0.12 pb and 0.07 pb at √
s = 7 TeV and 0.15 pb and 0.09 pb at
√s = 8 TeV [21], respectively. Four topologies are considered, with four, three and two leptons in the final state, respectively. The analyses are optimised to search for bothW HandZHprocesses; a combined search forV H is also presented. TheV H results are then further combined with theH→WW∗→`ν`ν analysis in the gluon-gluon fusion (ggF) and vector boson fusion (VBF) production modes [22], in which the ATLAS collaboration has reported the observation of the Higgs boson in theH→WW∗decay mode with a significance of 6.1 standard deviations. The combination of the ggF, VBF and V H analyses, presented in this note, are used to determine the couplings of the Higgs boson to vector bosons and, indirectly, to fermions, providing further constraints on the Higgs boson couplings. The results are consistent with the SM predictions.
2 Analysis Overview
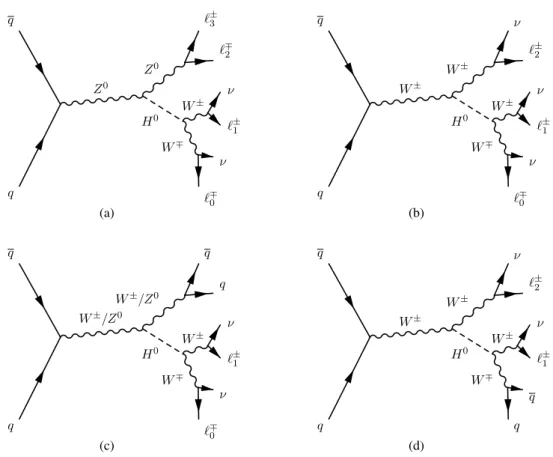
The Higgs bosonV Hproduction, followed by theH→WW∗decay, is searched for using events with four, three or two electrons or muons in the final state. Leptonic decays of tau leptons fromH→WW∗→τντν are included in the analysed sample and they are considered as signal, but no specific selection is con- sidered for events with hadronically decaying tau leptons in the final state. The analysis selection is designed to select events whose kinematic is consistent with theV H signal for each final state, in order to enhance the signal to background ratio. Figure 1 illustrates the relevant tree-level diagrams of the studied processes, in which a Higgs boson is produced in association with a gauge boson (WorZ).
Four channels are analysed, defined as follows:
(a) 4`channel(Figure1a): The leading contribution consists of a process in which a virtualZ boson radiates a Higgs boson, which in turn decays to aW boson pair. The decays of the gauge bosons produce four charged leptons and two neutrinos in the final state. The lepton pair with an invariant mass closest to theZ-boson mass is labelled as (`2,`3), while the remaining leptons are labelled as
`0and`1and are assumed to originate in theH→WW∗decay. Main backgrounds to this channel are the non-resonantZZ∗andZWW∗production.
(b) 3`channel(Figure1b): The leading contribution consists of a process in which a virtualWboson
Z0
W∓ W± Z0
H0
q q
`∓0 ν
`±1 ν
`∓2
`±3
(a)
W±
W∓ W± W±
H0
q q
`∓0 ν
`±1 ν
`±2 ν
(b)
W±/Z0
W∓ W± W±/Z0
H0
q q
`∓0 ν
`±1 ν q q
(c)
W±
W∓ W± W±
H0
q q
q q
`±1 ν
`±2 ν
(d)
Figure 1: Feynman diagrams at tree-level of the V H topologies studied in the present analysis: (a) 4`
channel (b) 3`channel (c) opposite-sign 2`channel and (d) same-sign 2`channel.
radiates a Higgs boson, and the Higgs boson decays to aWboson pair. All the gauge bosons decay leptonically producing three charged leptons and three neutrinos in the final state. The lepton with unique charge is labelled as`0, the lepton closest to`0in angle is labelled as`1, and the remaining lepton is labelled as`2. Leptons`0 and`1 are assumed to be produced by theH→WW∗decay.
The most prominent background to this channel is WZ/Wγ∗ production; non-resonant WWW∗ production is also a significant background and has the same final state as the signal. ZZ∗, Zγ, Z+jets,t¯tandWtproduction are also important backgrounds, as they mimic the signal selection if a lepton is undetected or because of a fake or non-prompt lepton from a jet.
(c) Opposite-sign2`channel(Figure1c): The leading contribution consists of a process in which the vector bosonV, which radiates the Higgs boson, decays hadronically producing two energetic jets, while theWbosons from theH→WW∗decay produce two oppositely charged leptons, labelled as
`0and`1, and two neutrinos. TheW Hprocess is expected to account for 70% of the signal yield, while theZH process accounts for the remaining 30%. The leading backgrounds for this channel aret¯tandWt. Z →ττandWW production with two associated jets are also major components.
Final states includingW+jets and multijets may produce fake leptons, contaminating the signal region. Other background sources includeWZ/Wγ∗production and other Higgs boson production modes, including ggF production.
(d) Same-sign2`channel(Figure1d): The leading contribution consists of a process in which both the W boson, produced in association with the Higgs boson, and one of theW bosons from the Higgs boson decay leptonically. Only final states with same-sign leptons are selected. The thirdW boson decays hadronically. The final state therefore contains two same-sign leptons, labelled as`1 and`2, two neutrinos and two energetic jets. Significant backgrounds in this channel areWZ/Wγ∗, Wγ andW+jets production. WW,Z+jets and top-quark processes also contribute. The selection is not optimised for events in which the lepton from the Higgs boson decay has opposite charge with respect to the lepton from the associatedWdue to the overwhelming background from thet¯t production.
All the channels described above are mutually exclusive based on the number of leptons with pT >
15 GeV. With the exception of the opposite-sign 2` channel, all topologies are further subdivided into several signal regions (SRs) to enhance the analysis sensitivity. The 4`channel is split into two samples according to the number of same-flavor opposite-sign (SFOS) lepton pairs. The sample containing two SFOS pairs suffers from a higher background contamination than the sample with one SFOS pair. The 3`analysis separates events with at least one pair of SFOS leptons from events without any SFOS pair.
The sample with at least one SFOS pair is further split into two subsamples, with one and two SFOS pairs, which have different signal to background ratios. In these signal regions a multivariate analysis is performed. The same-sign 2`sample is divided into two sub-channels with one (SS1jet) or two (SS2jet) selected jets in the final state. Additional data samples are defined in order to normalise the major backgrounds in each channel; they are referred to as control regions (CR) in the following. The final results are extracted from a fit simultaneously performed on all SRs and CRs. The channel with two leptons of different-flavour and opposite-sign is denoted as 2`-DFOS in the following sections.
3 The ATLAS Detector
ATLAS [23] is a multi-purpose particle physics detector with a forward-backward symmetric cylindrical geometry1and near 4πcoverage in solid angle. It consists of an inner tracking detector (ID) surrounded
1ATLAS uses a right-handed coordinate system with its origin at the nominal interaction point (IP) in the centre of the detector and thez-axis along the beam pipe. Thex-axis points from the IP to the centre of the LHC ring, and theyaxis points
by a thin 2 T superconducting solenoid, electromagnetic and hadronic calorimeters, and a muon spec- trometer (MS) incorporating three large superconducting toroid magnets of eight coils each.
The ID covers pseudorapidities up to|η|=2.5 and consists of multiple layers of silicon pixel and strip detectors, and a straw-tube transition radiation tracker. The calorimeter system covers the pseudorapidity range|η|<4.9. Within the region|η|<3.2, electromagnetic calorimetry is provided by barrel and endcap high-granularity lead/liquid-argon (LAr) calorimeters. An additional thin LAr presampler covering|η|<
1.8 is used to correct for energy loss in the material upstream of the calorimeters. Hadronic calorimetry is provided by a steel/scintillating-tile calorimeter, covering |η| < 1.7, and two copper/LAr hadronic endcap calorimeters. The solid angle coverage is completed with forward copper/LAr and tungsten/LAr calorimeter modules optimised for electromagnetic and hadronic measurements, respectively. The MS consists of separate trigger and high-precision tracking chambers that measure the deflection of muons in the magnetic field generated by superconducting air-core toroids. The precision chamber system covers the region|η|<2.7 with three stations of monitored drift tube layers, except for the forward region where the innermost station is equipped with cathode strip chambers. The muon trigger system covers the range
|η| < 2.4 with resistive plate chambers in the barrel and thin gap chambers in the endcap regions. A three-level trigger system is used. The first-level trigger is hardware-based, using a subset of the detector information, and reduces the event rate below 75 kHz. This is followed by two software-based trigger levels, which together reduce the event rate to about 300 Hz.
4 Data Samples
The analysed data were recorded using inclusive single-lepton and dilepton triggers. Overall quality criteria are applied in order to suppress non-collision backgrounds such as cosmic-ray muons, beam- related backgrounds, or noise in the calorimeters. The datasets used in the 7 TeV and 8 TeV analyses correspond to an integrated luminosity of 4.5 fb−1and 20.3 fb−1, respectively. The analysis of the same- sign 2`channel has been performed only on the 8 TeV data sample. The 8 TeV data were taken at a higher instantaneous luminosity (L ' 7×1033 cm−2s−1) than that for the 7 TeV data (L ' 3×1033 cm−2s−1) but with a higher number ('21 versus'9) of overlapping proton-proton collisions (pile-up).
The increased pile-up rate, rather than the increased centre-of-mass energy, is the main reason for the differences between 7 TeV and 8 TeV analysis selections.
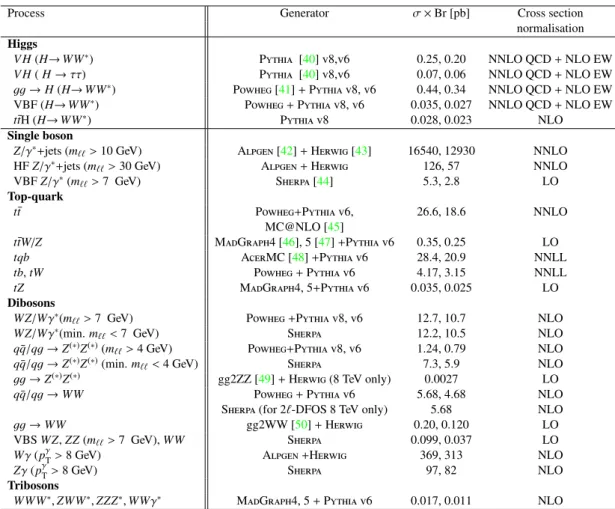
Table1lists the Monte Carlo (MC) generators and the cross sections that have been used to model and normalise the signal and background processes.
The Higgs boson production cross-sections are quoted at a Higgs boson mass of 125 GeV. The matrix-element-level calculations are interfaced to generators that are able to model the parton shower, the hadronisation and the underlying event, using either Pythia6, Pythia8, Herwig(with the underlying event modeled by Jimmy [24]), or Sherpa. The CT10 parton distribution function (PDF) set [25] is used for the Powheg and Sherpa samples while CTEQ6L1 [26] PDF set is used for Alpgen+Herwig and AcerMC samples. TheZ/γ(∗)sample is reweighted to the MRSTMCal [27] PDF set. The simulated samples are described in detail in the paper on theH→WW∗decay mode [22] with a few exceptions that are reported in the following. TheV Hsignal samples are normalised to the next-to-leading order (NLO) QCD calculations [21,28–31] with additional NLO electroweak (EW) corrections applied as a function of the transverse momentum,pT, of the associated vector boson using calculations by Hawk[32]. Thegg→ ZH signal samples are normalised to the next-to-next-to-leading order (NNLO) QCD calculations [29].
The associated Higgs boson production with at¯tpair (t¯tH) is simulated with Pythia8 and normalised to the NLO QCD estimation [21,28,29].
upward. Cylindrical coordinates (r, φ) are used in the transverse plane,φbeing the azimuthal angle around the beam pipe. The pseudorapidity is defined in terms of the polar angleθasη=−ln tan(θ/2).
TheZ/γ∗processes associated with light and heavy flavour (HF) jets are modelled by Alpgen+Herwig with merged leading order (LO) calculations. The simulation includes processes with up to five addi- tional partons in the matrix element (or three additional partons in processes with b orc-quarks). An overlap removal procedure is applied to avoid double counting of heavy flavours in the light jet samples.
The sum of the two samples is normalised to the NNLO calculation of Dynnlo [33,34]. The t¯tW/Z andtZ backgrounds are simulated using Madgraphat LO interfaced with Pythia6. The production of four leptons from a pair of virtualZ orγ bosons (indicated asZZ∗in the following) contributes to the background of the 3`channel when one low-pT lepton is not detected. Since this background is more prominent when one lepton pair has a very low mass, a dedicated sample which requires at least one SFOS pair with m`` < 4 GeV, generated with Sherpaand normalised to the NLO QCD cross section from MCFM [35], is included. Production of triboson processes is a major source of background, in particular WWW∗ in the 3`channel and ZWW∗ in the 4` channel. They are modelled by Madgraph interfaced with Pythia6 and normalised to the NLO cross section from Ref. [36].
All samples are processed using the full ATLAS detector simulation [37] based on Geant4 [38], except forW H,WZ/Wγ∗withm`` >7 GeV,qq/qg→WW,WWγ∗,t¯tand single top, which are instead simulated with Atlfast-II [37], a parametrisation of the response of the electromagnetic and hadronic calorimeters, and with Geant4 for other detector components [39]. The events are reweighted to ensure that the distribution of the number of interactions per bunch crossing is correctly reproduced.
5 Event Reconstruction and Selection
5.1 Event Reconstruction
Muons are reconstructed over the region|η| <2.5 by combining tracks reconstructed in the MS and the ID [51]. Electrons are identified within the region|η|<2.47, except in the boundary region between bar- rel and endcap calorimeters (1.37 < |η| < 1.52), through the association of an ID track to a calorimeter cluster whose shower profile is consistent with an electromagnetic shower [52]. The electron identifica- tion exploits both calorimeter and track quantities, through a cut-based approach in the 7 TeV analysis and a likelihood-based selection in the 8 TeV analysis [53].
Both track-based and calorimeter-based isolation cuts are applied on leptons. The isolation criteria are optimised to maximise the sensitivity to V H production at mH = 125 GeV. The track-based isolation is built on the computation of the scalar sum of the transverse momenta of tracks associated to the primary vertex belonging to a cone, constructed around the candidate lepton, of size ∆R = 0.2 , where
∆R = p
∆η2+ ∆φ2. The calorimeter isolation is based on the scalar sum of the transverse energies measured within a cone of∆R=0.2, excluding the energy of the calorimeter cluster associated with the particle itself. For the 8 TeV data the electron calorimeter isolation algorithm is based on topological clusters [53], while for the 7 TeV data it is based on calorimeter cells. Cells are used for the isolation for muon tracks in the calorimeter in both 7 and 8 TeV data. The calorimeter and track isolation criteria vary between the 7 and 8 TeV data samples and are not the same for all the analyses presented here. The upper cut applied on the threshold of the calorimeter energy varies from 7% to 30% of the lepton ET, while the sum of the pTvalues of the tracks in the cone cannot exceed values between 4% to 12% of the lepton pT. Less stringent isolation criteria on energy andpTare required for the 7 TeV data sample.
Jets are reconstructed from three-dimensional topological clusters [54] over the region|η|<4.5 using the anti-ktalgorithm [55] with radius parameterR=0.4. They are required to havepTlarger than 25 GeV except for the forward region,|η| >2.4, in which the threshold is raised to 30 GeV. In order to suppress the contamination of jets from pile-up, a special selection is applied: the sum of the pT of all tracks in the jet within∆R= 0.4 and that of the subset of these associated to the primary vertex is computed. For the 8 TeV data sample, the ratio between the second and the first of these two quantities is required to be
Process Generator σ×Br [pb] Cross section normalisation Higgs
V H(H→WW∗) Pythia [40] v8,v6 0.25, 0.20 NNLO QCD+NLO EW
V H(H→ττ) Pythia [40] v8,v6 0.07, 0.06 NNLO QCD+NLO EW
gg→H(H→WW∗) Powheg[41]+Pythiav8, v6 0.44, 0.34 NNLO QCD+NLO EW
VBF (H→WW∗) Powheg+Pythiav8, v6 0.035, 0.027 NNLO QCD+NLO EW
ttH (H→¯ WW∗) Pythiav8 0.028, 0.023 NLO
Single boson
Z/γ∗+jets (m``>10 GeV) Alpgen[42]+Herwig[43] 16540, 12930 NNLO
HFZ/γ∗+jets (m``>30 GeV) Alpgen+Herwig 126, 57 NNLO
VBFZ/γ∗(m``>7 GeV) Sherpa[44] 5.3, 2.8 LO
Top-quark
tt¯ Powheg+Pythiav6, 26.6, 18.6 NNLO
MC@NLO [45]
ttW/Z¯ MadGraph4 [46], 5 [47]+Pythiav6 0.35, 0.25 LO
tqb AcerMC [48]+Pythiav6 28.4, 20.9 NNLL
tb,tW Powheg+Pythiav6 4.17, 3.15 NNLL
tZ MadGraph4, 5+Pythiav6 0.035, 0.025 LO
Dibosons
WZ/Wγ∗(m``>7 GeV) Powheg+Pythiav8, v6 12.7, 10.7 NLO WZ/Wγ∗(min.m``<7 GeV) Sherpa 12.2, 10.5 NLO qq/qg¯ →Z(∗)Z(∗)(m``>4 GeV) Powheg+Pythiav8, v6 1.24, 0.79 NLO qq/qg¯ →Z(∗)Z(∗)(min.m``<4 GeV) Sherpa 7.3, 5.9 NLO
gg→Z(∗)Z(∗) gg2ZZ [49]+Herwig(8 TeV only) 0.0027 LO
qq/qg¯ →WW Powheg+Pythiav6 5.68, 4.68 NLO
Sherpa(for 2`-DFOS 8 TeV only) 5.68 NLO
gg→WW gg2WW [50]+Herwig 0.20, 0.120 LO
VBSWZ,ZZ(m``>7 GeV),WW Sherpa 0.099, 0.037 LO
Wγ(pγT>8 GeV) Alpgen+Herwig 369, 313 NLO
Zγ(pγT>8 GeV) Sherpa 97, 82 NLO
Tribosons
WWW∗,ZWW∗,ZZZ∗,WWγ∗ MadGraph4, 5+Pythiav6 0.017, 0.011 NLO
Table 1: MC generators used to model the signal and background processes. Here and in the text Powheg refers to the POWHEG-BOX generator. The Higgs boson samples are normalised using the production cross section and the decay branching fraction computed for a mass of 125 GeV. The values reported for the V H (H→WW∗) process include the NNLO contribution from thegg → ZH (H→WW∗) process.
For generators and cross sections, wherever two comma-separated values are given, the first value refers to √
s = 8 TeV and the second to √
s = 7 TeV. When a single value is given, it refers to the √ s = 8 TeV simulation. The corresponding cross section times branching fraction,σ×Br, includes the decays t → Wb, W(∗) → eν, µν, τν andZ(∗) → ee,µµ, ττ. ‘HF’ refers to heavy-flavour jet production, and
‘VBS’ refers to vector boson scattering. When a lower cut onm``is specified, it is applied to all SFOS lepton pairs, while when an upper cut is indicated it is applied to at least one SFOS lepton pair in the event. Cross sections are computed to different levels of accuracy (LO, NLO, NNLO or next-to-next-to- leading-logarithm, NNLL), as specified by the last column. 2`-DFOS is the channel with two leptons of different-flavour and opposite-sign.
larger than 0.5 for all jets with pT<50 GeV and|η| <2.4. For the 7 TeV data the threshold is increased to 0.75 for all jets with pT<50 GeV and|η|<2.4.
The MV1b-jet identification algorithm is used to tag jets containing ab-hadron [56]. Forb-jets with
|η| < 2.5 and pT >20 (25) GeV in the 8 (7) TeV data analysis, the selection has an efficiency of 85%, estimated using simulatedt¯tevents. It corresponds to a rejection of a factor 10 against jets originating from light quarks or gluons [57,58].
When two leptons are reconstructed within a cone of∆R=0.1, or a lepton and a jet are reconstructed within∆R=0.3, they are considered to be the same physical object and the duplication of reconstructed objects is resolved according to well defined priorities. In the presence of the overlap between two leptons of the same flavour, the highest pTobject is kept while the lowerpTobject is ignored. The muon is kept in presence of an overlap with an electron, the electron is kept in presence of an overlap with a jet, and the jet is kept in presence of an overlap with a muon.
Two variables describing the missing transverse momentum are calculated in this analysis: one is calorimeter-based and the other is track-based. The first one, which benefits from the large rapidity cov- erage of the calorimeter and its sensitivity to neutral particles, is referenced asEmissT in the following [59].
TheEmissT magnitude (ETmiss) is used in the analysis selection. The quantityEmissT is calculated as the neg- ative vector sum of the momenta of muons, electrons, taus, photons, jets and clusters of calorimeter cells that are not associated with these objects (the “soft-term”). In the 8 TeV analysis, to suppress the pile-up effect, the soft-term is scaled by the ratio of the summed scalarpTof tracks from the primary vertex not matched with objects to the summed scalar pTof all tracks in the event also not matched to objects [60].
The track-based missing transverse momentum measurement is used to reduce the effects of the pile- up on the resolution of the calorimeter-based variant [61]. It is obtained as vector sum of tracks with pT > 500 MeV that originate from the primary vertex. This quantity is calledpmissT , and the analysis selections are applied on its magnitude, pmissT . In order to include neutral components in the calculation for final states with jets, the sum of track momenta in jets is replaced by their energy measured in the calorimeter.
5.2 Event Selection
Selected events must contain a primary vertex with at least three well-reconstructed charged particle tracks associated to it, each with pT> 400 MeV. If there is more than one primary vertex reconstructed in the event, the vertex of the hard interaction is identified by computing the sum of the p2Tof the tracks associated to it; the vertex with the largest value is selected.
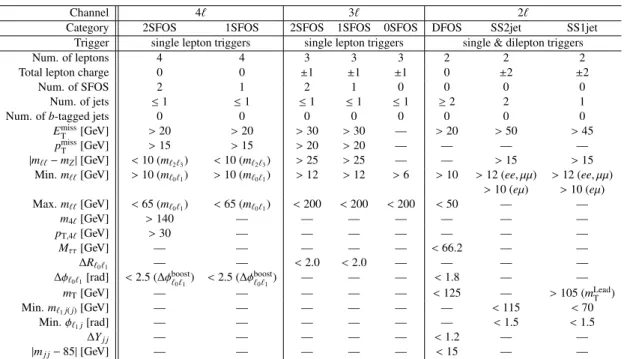
The four analysed channels are further split into eight signal regions, designed to optimise the sensi- tivity to theV Hproduction, with a specific set of cuts applied to define each signal region. The selection criteria rely on the number of leptons and their properties such as charge, flavour, transverse momen- tum, and on the number of jets andb-jets and amount of missing transverse momentum. Of particular importance are the invariant masses and opening angles among the selected objects, most notably those of opposite-sign lepton pairs. The spin-0 nature of the Higgs boson, in conjunction with the V-A na- ture of the weak interaction, results in a preference for a small opening angle for lepton pairs from H → WW∗ → `ν`ν decays. On the other hand, as described in section2, major backgrounds often contain Z boson production ort¯tproduction which give rise to opposite-sign lepton pairs with a large opening angle. In the same-sign 2` channel, the lepton decay product of the Higgs boson candidate is selected by choosing the lepton with the smallest opening angle with respect to the jet(s); cuts are therefore applied to the opening angle and to the invariant mass between this lepton and the jets. The definitions of the signal regions used for each channel are summarised in Table5.2and further detailed in sections5.2.1-5.2.4.
In all the 4`and 3`signal regions, events are recorded using inclusive single lepton triggers, which are fully efficient for high lepton multiplicity signatures, while for the 2`channels in 8 TeV data taking
Channel 4` 3` 2`
Category 2SFOS 1SFOS 2SFOS 1SFOS 0SFOS DFOS SS2jet SS1jet Trigger single lepton triggers single lepton triggers single & dilepton triggers
Num. of leptons 4 4 3 3 3 2 2 2
Total lepton charge 0 0 ±1 ±1 ±1 0 ±2 ±2
Num. of SFOS 2 1 2 1 0 0 0 0
Num. of jets ≤1 ≤1 ≤1 ≤1 ≤1 ≥2 2 1
Num. ofb-tagged jets 0 0 0 0 0 0 0 0
ETmiss[GeV] >20 >20 >30 >30 — >20 >50 >45 pmiss
T [GeV] >15 >15 >20 >20 — — — —
|m``−mZ|[GeV] <10 (m`2`3) <10 (m`2`3) >25 >25 — — >15 >15 Min.m``[GeV] >10 (m`0`1) >10 (m`0`1) >12 >12 >6 >10 >12 (ee, µµ) >12 (ee, µµ)
>10 (eµ) >10 (eµ) Max.m``[GeV] <65 (m`0`1) <65 (m`0`1) <200 <200 <200 <50 — —
m4`[GeV] >140 — — — — — — —
pT,4`[GeV] >30 — — — — — — —
Mττ[GeV] — — — — — <66.2 — —
∆R`0`1 — — <2.0 <2.0 — — — —
∆φ`0`1[rad] <2.5 (∆φboost`0`1) <2.5 (∆φboost`0`1) — — — <1.8 — —
mT[GeV] — — — — — <125 — >105 (mLeadT )
Min.m`1j(j)[GeV] — — — — — — <115 <70
Min.φ`1j[rad] — — — — — — <1.5 <1.5
∆Yj j — — — — — <1.2 — —
|mj j−85|[GeV] — — — — — <15 — —
Table 2: Definition of each signal region in this analysis. mLeadT is defined as the transverse mass of the leading lepton and theEmissT .
dilepton triggers are also used. The pT thresholds of selected triggers are lower than the cuts applied to offline objects. Single-lepton trigger efficiencies are measured with respect to offline reconstructed leptons using leptonic Z decays. The measured values are approximately 95% for electrons and 90%
(70%) for muons in the endcap (barrel).
A specific number of leptons withpT >15 GeV is required in each channel of this analysis and the event is discarded if the number of leptons is not equal to the required number. A similar requirement is applied on the number of jets: if the number of jets that satisfy the selection criteria defined in section5.1 is not equal to the required number, the event is discarded.
5.2.1 Four-lepton channel
Events in this channel are required to have exactly four leptons. The pTof the leading and sub-leading leptons must be above 25 GeV and 20 GeV, respectively, and the pT of each of the remaining two leptons must exceed 15 GeV. The total charge of the four leptons is required to be zero. Only events with at least one SFOS lepton pairs are accepted, and events are classified into the signal regions 4`-2SFOS and 4`-1SFOS according to the number of such pairs.
In order to select final states with neutrinos,EmissT is required to be above 20 GeV and pmissT above 15 GeV. In order to reduce thet¯tZbackground, events are vetoed if they contain more than one jet. Top- quark production is further suppressed by vetoing events with anyb-tagged jet with pT above 20 GeV.
The invariant mass of`2and`3,m`2`3, is required to satisfy|m`2`3−mZ|<10 GeV and the invariant mass of`0 and `1, m`0`1, is required to be between 10 GeV and 65 GeV. This requirement on m`0`1 greatly reduces the contamination fromZZ(∗)production in events with two pairs of SFOS leptons.
The sensitivity of the search is improved by exploiting two additional variables, ∆φboost`
0`1 and pT4`, where∆φboost`
0`1 denotes the difference in azimuthal angle between the two leptons from the Higgs boson candidate in the frame where the Higgs boson’s pT is zero. The Higgs boson transverse momentum is approximated with~pHT ∼ −~pZT−~pjetT , or with~pHT ∼ −~pZTif no jet is present. The angular separation∆φboost`
0`1
is requested to be below 2.5 rad. The magnitude of the vector sum of the lepton four-momenta, pT4`, can discriminate against the main background,ZZ(∗), which has no neutrinos. A cut requiringpT4`>30 GeV is introduced for 4`-2SFOS. In this signal region the invariant mass of the four leptons is required to be above 140 GeV to remove events fromH→ZZ∗→4`, which are the target of another analysis [17].
5.2.2 Three-lepton channel
For this channel, exactly three leptons are required, which must have pT >15 GeV and correspond to a total charge±1. After this requirement, contributions from background processes that include more than one fake lepton, such as singleW+jet production and inclusivebb¯ pair production, are negligible. Events are then split into the signal regions 3`-2SFOS, 3`-1SFOS and 3`-0SFOS, requiring two, one and zero SFOS lepton pairs, respectively.
In order to reduce the background fromt¯tproduction, events are vetoed if they contain more than one jet. The background from top-quark production is further suppressed by vetoing events if they contain anyb-tagged jet with pT > 20 GeV and|η| <2.5. In order to select final states with neutrinos,EmissT is required to be above 30 GeV and pmissT above 20 GeV in 3`-2SFOS and 3`-1SFOS. In the 3`-0SFOS, EmissT selections are not imposed because the main backgrounds also contain neutrinos. The invariant mass of all SFOS pairs in 3`-2SFOS and 3`-1SFOS is required to satisfy|m`` −mZ| > 25 GeV. This requirement suppresses theWZandZZ∗backgrounds and reduces theZ+jets acceptance.
A lower threshold is set on the smallest invariant mass of opposite-sign leptons at 12 GeV in 3`- 2SFOS and 3`-1SFOS and at 6 GeV in 3`-0SFOS. In addition, an upper threshold is set on the largest invariant mass of opposite-sign leptons at 200 GeV in the three signal regions. These selections reject backgrounds from heavy flavour and reduce the number of combinatorial lepton pairs from theWZ/Wγ∗ process. The WZ/Wγ∗ process could indeed give larger mass values with respect to the W H process since it can proceed through the t- and u-channels, in addition to the s-channel which is present also in W Hproduction. .
The angular separation in∆Rbetween`0and`1,∆R`0`1, is required to be smaller than 2 in 3`-2SFOS and 3`-1SFOS. This cut favours the Higgs boson decay topology with respect to that ofWZ/Wγ∗events.
In 3`-2SFOS and 3`-1SFOS, the shape of a multivariate discriminant based on a Gradient Boosted Decision Tree (BDT) [62], which produces a multivariate classifier (BDT Score), is used to achieve a further separation between signal and background. The main purpose of the multivariate classifier is to distinguish between the signal and the dominantWZ/Wγ∗andZZ∗backgrounds, and the BDT is trained against these two background processes. The BDT parameters have been tuned in order to ensure that there is no overtraining, i.e. that the BDT is robust against statistical fluctuations in the training samples.
For the training of the BDT the input discriminating variables which provide the best separation between signal and background are: the pT of the three leptons, the magnitude of their vector sum, the invariant mass of the two opposite sign lepton pairs,∆R`0`1,EmissT , and pmissT . In the final likelihood fit, the shape of the distribution of the BDT Score is used to extract the number of observed events in 3`-2SFOS and 3`-1SFOS, while the shape of the distribution of∆R`0`1 is used to extract the number of observed events in 3`-0SFOS.
5.2.3 Opposite-sign two-lepton channel
In the channel with two leptons of different-flavour and opposite-sign (2`-DFOS), exactly two leptons with pTthresholds of 22 and 15 GeV are required. Only opposite-signeµfinal states are considered in order to reduce the background fromZ+jets,WZandZZproduction. A cut on the invariant mass of the lepton pair, m`` > 10 GeV, is applied to reject combinatorial dilepton backgrounds. In order to select final states with neutrinos,EmissT is required to be above 20 GeV. These selections reduce the background processes that contain jets faking leptons. The presence of at least two jets withpT>25 GeV is required.
The background from top-quark production is further reduced by vetoing events if they contain any b-tagged jets. To reject the Z+jets production that leads to eµfinal states through Z → ττ decay, a cut Mττ < |mZ − 25 GeV| is applied, where Mττ is the dilepton invariant mass reconstructed under assumptions that the lepton pair comes from τlepton decay, the neutrinos are the only source of EmissT and neutrinos are collinear to charged leptons [22].
Upper bounds on the invariant mass of the lepton pair,m`` <50 GeV, and on the azimuthal angular separation of the lepton pair,∆φ``<1.8 rad, are applied to enhance the Higgs boson signal relative to the WW, top andW+jets backgrounds. A cut on the rapidity separation between the two jets with leading pT,∆Yj j < 1.2, and one on the invariant mass of the leading two jets,|mj j −85 GeV| < 15 GeV, are required to select jets from the associatedW/Zbosons. The central value of themj jselection interval is larger than theWboson mass in order to retain the acceptance for theZHproduction withZ→ j jdecay.
The selectionmT < 125 GeV is applied, wheremTis the transverse mass of the dilepton system defined asmT= q
(E``T +EmissT )2− |pT``+EmissT |2, whereE``T = q
|pT``|2+m2``. 5.2.4 Same-sign two-lepton channel
Exactly two leptons with the same charge are required for this channel. The leptonpTthresholds are set at 22 and 15 GeV and both same-flavour and different-flavour combinations are considered. A lower bound onm``is applied at 12 GeV for same-flavour lepton pairs and at 10 GeV for different-flavour lepton pairs.
Despite the same-charge requirement, a wrong-charge assignment may allow background contributions from Z boson decays. Therefore a veto on same-flavour lepton pairs with |m`` −mZ| < 15 GeV is introduced.
The signal regions 2`-SS2jet and 2`-SS1jet are defined requiring the number of jets to be exactly two or exactly one, respectively. Events with b-tagged jets having pT > 20 GeV are removed in both 2`- SS2jet and 2`-SS1jet. ETmissis required to be larger than 50 GeV in 2`-SS2jet and larger than 45 GeV in 2`-SS1jet. Additional cuts are applied to events in 2`-SS2jet and 2`-SS1jet, on the following variables:
the minimum invariant mass of a lepton and the jet (the two jets) in the event,mmin`j (mmin`jj ); the smallest opening angle between the lepton which minimises the above variable and a jet,∆φmin`j ; the transverse mass of the leading lepton and the EmissT ,mLeadT (see Table5.2 for details). Low values ofmmin`j (mmin`jj ) and of∆φmin`j favour the selection of Higgs decays products with respect to the major backgrounds. High values of mLeadT help in reducing the W+jets background. The pT threshold for the sub-leading muon in theµµchannel is increased to 20 GeV in both 2`-SS2jet and 2`-SS1jet to suppress fake muons from W+jets and multijet production processes.
In the fit explained in section9, 2`-SS2jet and 2`-SS1jet are further split into four signal regions according to the combination of lepton flavours in each event: ee,eµ,µeandµµ, whereeµrefers to the case in which electron has leading pT while µerefers to the case in which muon has leading pT. This splitting is motivated by the expected differences in the background contribution such as ofWγ.
5.2.5 Signal acceptance
The number of expectedV(H→WW∗) events surviving the event selections described for each channel is presented in Table5.2.5. The total acceptance forW(H → `ν`ν), forW(H → `νqq) and forZ(H →
`ν`ν) is 3.7%, 0.3% and 1.9%, respectively. The analysis acceptance for theZHwithH→`νqqprocess is negligible. The acceptance is defined as the ratio of the number of events in the SRs to the number of events expected according to the branching ratio for the various processes. The Higgs boson associated production followed by the decayH → ττcannot be completely isolated from the selected final states.
Therefore statistical results will be presented considering this component as part of the background, with σVH·Br(H→ττ) fixed to the SM values.
(a) 8 TeV data analysis
Channel 4` 3` 2`
Category 2SFOS 1SFOS 2SFOS 1SFOS 0SFOS DFOS SS2jet SS1jet W H(H→WW∗) — — 0.563 1.43 1.284 1.48 1.02 1.84
ZH(H→WW∗) 0.208 0.235 0.168 0.179 0.145 0.668 0.017 0.195 V H(H→WW∗) 0.208 0.235 0.731 1.62 1.428 2.15 1.04 2.04
(all categories) 9.44
(b) 7 TeV data analysis
W H(H→WW∗) — – 0.116 0.292 0.263 0.210 ZH(H→WW∗) 0.023 0.021 0.013 0.033 0.028 0.075 V H(H→WW∗) 0.023 0.021 0.129 0.325 0.291 0.285
(all categories) 1.073
Table 3: Number of expected signal events, for mH = 125 GeV, in the (a) 8 TeV and (b) 7 TeV data samples.
6 Background Modelling
The background contamination in the signal regions results from various physics processes, each mod- elled by one of the following methods:
• Pure MC prediction: rates and shapes are extracted from simulation and normalized to the values in Table1;
• MC prediction normalised to data: rates are extracted from data in a control region (CR) but shapes are extracted from MC;
• Pure data-driven prediction: rates and shapes are extracted from data.
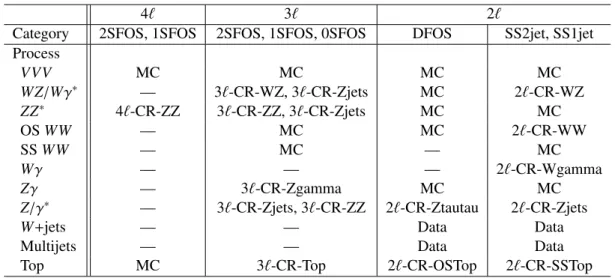
Fake-lepton backgrounds (W+jets, Multijets) in the 2`channels are estimated by using a purely data- driven method which utilises the rate at which a jet fakes a lepton. Details of this method can be found in Ref. [22]. Table6summarises the method adopted for each process in each signal region. The labels
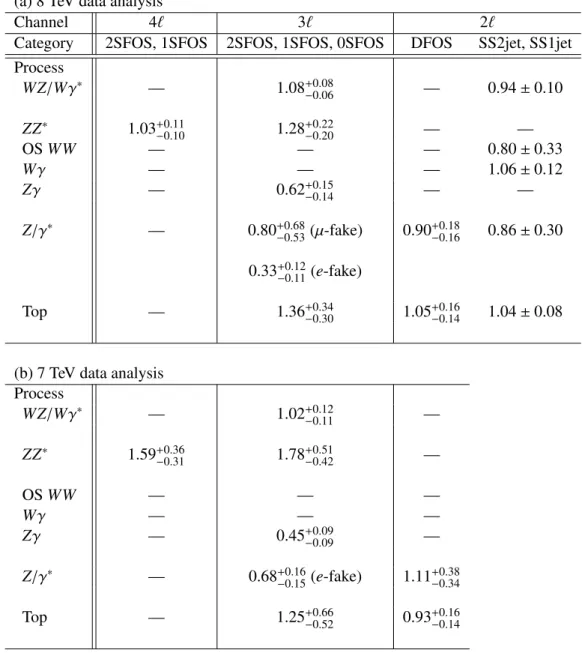
‘MC’ and ‘Data’ represent the pure MC prediction and the pure data-driven estimation. For backgrounds that are modelled by MC with a normalisation factor computed using data, the CR name is shown as defined in Table 6and6. In the table ‘VVV’ represents the triboson processesWWW∗,ZWW∗,ZZZ∗ andWWγ∗. The ‘Top’ processes includet¯tand single top production, the latter dominated bytW with W → `νdecay, as well ast¯tW/Z. The ratio oft¯t yields totW yields is found compatible between all the CRs and associated SRs, thus only one normalisation factor (NF) is extracted per CR for the ‘Top’
category. In this analysis Higgs boson production through ggF and VBF is treated as background as discussed in section9.
4` 3` 2`
Category 2SFOS, 1SFOS 2SFOS, 1SFOS, 0SFOS DFOS SS2jet, SS1jet Process
VVV MC MC MC MC
WZ/Wγ∗ — 3`-CR-WZ, 3`-CR-Zjets MC 2`-CR-WZ
ZZ∗ 4`-CR-ZZ 3`-CR-ZZ, 3`-CR-Zjets MC MC
OSWW — MC MC 2`-CR-WW
SSWW — MC — MC
Wγ — — — 2`-CR-Wgamma
Zγ — 3`-CR-Zgamma MC MC
Z/γ∗ — 3`-CR-Zjets, 3`-CR-ZZ 2`-CR-Ztautau 2`-CR-Zjets
W+jets — — Data Data
Multijets — — Data Data
Top MC 3`-CR-Top 2`-CR-OSTop 2`-CR-SSTop
Table 4: Summary of background modelling. Some backgrounds are normalised rescaling the MC yields by the data to MC ratio measured in CRs. For these backgrounds the names of the most important CRs are listed. The symbol ‘—’ means that the contribution to the total background in the signal region is negligible.
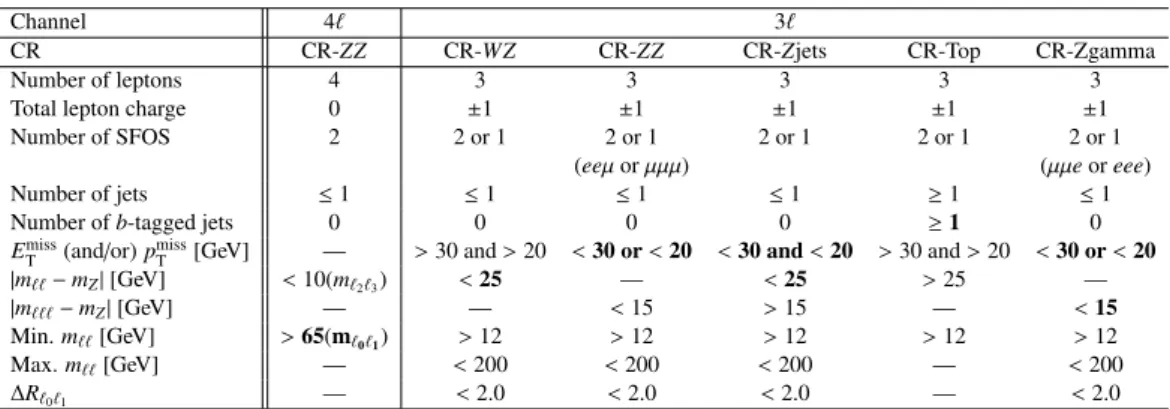
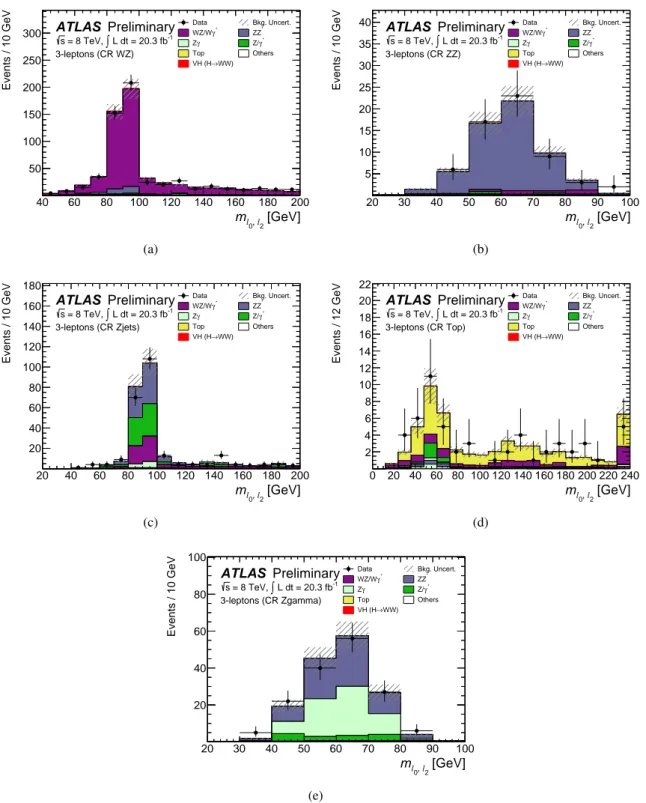
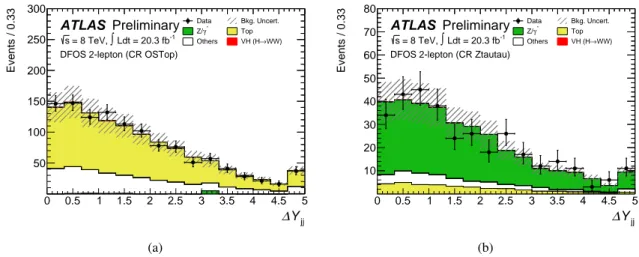
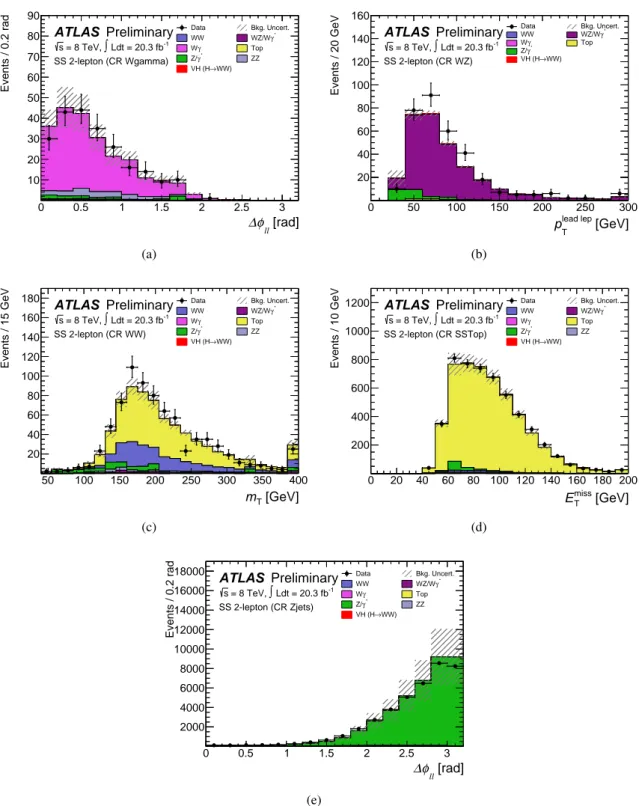
The CRs used in the 4` and 3` analyses are defined in Table 6and those used in the 2` analyses are shown in Table 6. The CRs are orthogonal to the corresponding SRs by inverting some cuts with respect to the SR definitions. These cuts are in boldface fonts in the tables and are further explained in the following sections.
Channel 4` 3`
CR CR-ZZ CR-WZ CR-ZZ CR-Zjets CR-Top CR-Zgamma
Number of leptons 4 3 3 3 3 3
Total lepton charge 0 ±1 ±1 ±1 ±1 ±1
Number of SFOS 2 2 or 1 2 or 1 2 or 1 2 or 1 2 or 1
(eeµorµµµ) (µµeoreee)
Number of jets ≤1 ≤1 ≤1 ≤1 ≥1 ≤1
Number ofb-tagged jets 0 0 0 0 ≥1 0
ETmiss(and/or)pmissT [GeV] — >30 and>20 <30 or<20 <30 and<20 >30 and>20 <30 or<20
|m``−mZ|[GeV] <10(m`2`3) <25 — <25 >25 —
|m```−mZ|[GeV] — — <15 >15 — <15
Min.m``[GeV] >65(m`0`1) >12 >12 >12 >12 >12
Max.m``[GeV] — <200 <200 <200 — <200
∆R`0`1 — <2.0 <2.0 <2.0 — <2.0
Table 5: Control region definitions in 4`and 3`analyses. Cuts indicated in boldface fonts are designed to keep the CR orthogonal to the relevant SR.
Channel DFOS 2` SS 2`
CR CR-OSTop CR-Ztautau CR-Wgamma CR-WZ CR-WW CR-SSTop CR-Zjets
Number of leptons 2 2 2 3 2 2 2
≥1 conversion e
Total lepton charge 0 0 ±2 ±1 0 0 0
Number of SFOS 0 0 — — — — —
Number of jets ≥2 ≥2 2 or 1 2 or 1 2 or 1 2 or 1 2 or 1
Number ofb-tagged jets 0 0 0 0 0 ≥1 0
EmissT [GeV] >20 >20 >45 (1j) >45 (1j) >85 (1j) >45 (1j,ee, µµ) >45 (1j)
>60 (1j,eµ) <85 (1j,eµ)
>50 (2j) >50 (2j) >80 (2j) >50 (2j,ee, µµ) >50 (2j,ee, µµ)
>60 (2j,eµ) <80 (2j,eµ)
|m``−mZ|[GeV] — — — <15(OS ee, µµ) >15(ee, µµ) >15(ee, µµ) <15(ee, µµ) Min.m``[GeV] >90 (8TeV) >10 >12(ee, µµ) >12(ee, µµ) >12(ee, µµ) >12(ee, µµ) >12(ee, µµ)
>80 (7TeV)
>10(eµ) >10(eµ) >10(eµ) >12(eµ) >55(eµ)
Max.m``[GeV] — <70 <50 — — — <80(eµ)
Mττ[GeV] <(mZ−25) — — — — —
∆φ`0`1[rad] — >2.8 <2.5 — — —
mT[GeV] — — >105 (1j) >105 (1j) >105 (1j) >105 (1j) —
Min.m`1j[GeV] — — <70 <70 <70 <70 <70
Min.m`1j j[GeV] — — <115 <115 <115 <115 <115
Min.φ`1j[rad] — — <1.5 <1.5 — — —
p``T[GeV] — — >30 — — — —
Table 6: Control region definitions in 2`analyses. Cuts indicated in boldface fonts are designed to keep the CR orthogonal to the relevant SR.
6.1 Background in four-lepton channel
The main backgrounds that contribute to the 4`-2SFOS and 4`-1SFOS signal regions are diboson pro- cesses, dominated byZZ∗production withETmissfromZ →ττdecay, and three vector boson processes, in particularZWW∗which has the same signature as the signal. These processes respectively account for about 85% and 15% of the total background contamination. To normalise the ZZ∗ background a dedicated CR, the 4`-CR-ZZ control region, is defined by inverting the cut on the invariant mass of dileptons from the Higgs boson candidate. All the other minor background processes, listed in Table6, are modelled by simulation.
6.2 Background in the three-lepton channel
Three classes of backgrounds contribute to the 3`analysis. Firstly, diboson processes: WZ/Wγ∗,ZZ∗, with an undetected lepton mainly due to its low-pT, andZγ, in which the photon converts to electron-
