ATLAS-CONF-2020-001 13February2020
ATLAS CONF Note
ATLAS-CONF-2020-001
13th February 2020
Measurements of top-quark pair single- and
double-differential cross-sections in the all-hadronic channel in p p collisions at √
s = 13 TeV using the ATLAS detector
The ATLAS Collaboration
Differential cross-sections are measured for top-quark pair production in the all-hadronic decay mode, using proton–proton collision events collected by the ATLAS experiment in which all six decay jets are separately resolved. Absolute and normalised single- and double-differential cross-sections are measured at particle and parton level as a function of various kinematic variables. Emphasis is placed on well-measured observables in fully-reconstructed final states, as well as on the study of correlations between the top-quark pair system and additional jet radiation identified in the event. The study is performed using data from proton–proton collisions at
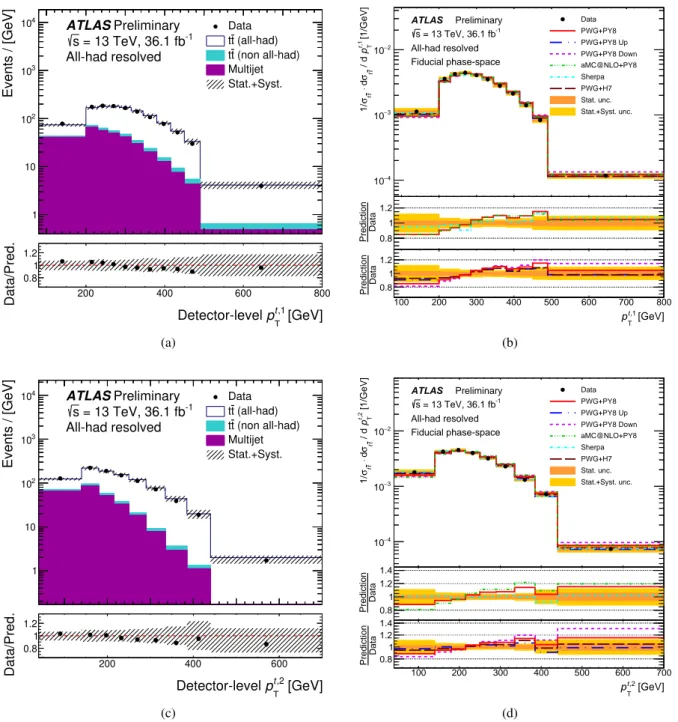
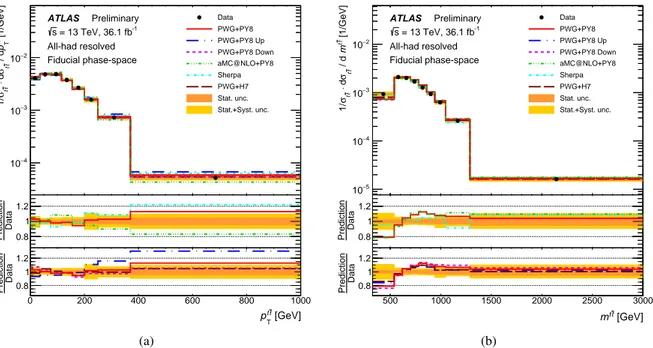
√s =13 TeV collected by the ATLAS detector at CERN’s Large Hadron collider in 2015 and 2016, corresponding to an integrated luminosity of 36.1 fb−1. The rapidities of the individual top quarks and of the top-quark pair are well modelled. Significant mismodelling is observed in the transverse momenta of the leading three jet emissions, while the leading top-quark transverse momentum and top-quark pair transverse momentum are both found to be incompatible with several theoretical predictions.
© 2020 CERN for the benefit of the ATLAS Collaboration.
Reproduction of this article or parts of it is allowed as specified in the CC-BY-4.0 license.
1 Introduction
As the heaviest particle of the Standard Model (SM), the top quark and its properties provide insights on a wide range of topics, including proton structure and precision electroweak physics. Top-quark pair production is the most significant background to the bulk of searches for physics beyond the Standard Model (BSM); therefore, improving the accuracy of theoretical models for these production processes is of central importance to the collider physics programme.
The Large Hadron Collider [1] (LHC) is the first top-quark factory, and thus provides an unprecedented opportunity to study the physics of the top quark. This paper reports the results of measurements of differential cross-sections for the production of top-quark pairs in the final state with the largest branching ratio, namely the simultaneous decay of the two top quarks each to a bottom quark and two additional quarks. The measurements are performed in the six-jet topology, using data collected by the ATLAS detector [2] at a centre-of-mass energy (
√s)of 13 TeV in 2015 and 2016 and corresponding to 36 fb−1of proton–proton (pp) collisions.
Single- and double-differential distributions of the kinematic properties of the top-quark-antiquark (tt¯) system are presented. They can be used to improve constraints on parton distribution functions (PDFs) and tuning of precision cross-section computations. Correlations between thett¯system and associated jet production are also measured, to give information on predictions of multileg matrix-element calculations.
Both absolute and normalised differential cross-sections are presented.
Previous differential measurements of top-quark cross sections, particularly in association with additional jets, have mainly used the lepton-plus-jets (`+jets) and dileptonic decay modes [3–14], while the all- hadronic decay mode has been studied at lower
√sby the CMS collaboration [15,16] and in the highly boosted regime, at high transverse momentum (pT) [17], by the ATLAS collaboration. In this analysis, events are considered in which all three quarks from each top-quark decay are resolved into distinct jets, leading to at least six jets in the final state. This complements the measurements made in this channel using large-radius jets [17], which are limited to the region of top-quark transverse momentum above 350 GeV. The resolved all-hadronic final state is admittedly subject to a larger background contamination from multi-jet production. However, this final state avoids kinematic ambiguities due to the presence of neutrinos accompanying the leptonic decays. This allows a full reconstruction of the top-quark pair without recourse to the missing transverse momentum, which has a relatively poor experimental resolution and provides no information on longitudinal momentum. The good momentum resolution on both top quarks enables characterisation of the kinematic properties of additional jet radiation accompanying thett¯system in relation to the top-quark pair kinematics.
Differential distributions measured in data are presented with corrections both to the stable particle level in a fiducial phase space, and to the parton level in the full phase space. The paper presents a set of measurements of thett¯production cross section as a function of properties of the reconstructed top quark (transverse momentum and rapidity) and of thett¯system (transverse momentum, rapidity and invariant mass) as well as additional variables. Taking various reference objects such as the leading top quark, the leading jet and the leading extra jet, angular separations and transverse momentum ratios between the additional jet radiation and these reference objects are measured. The measured differential cross-sections are compared with predictions from a variety of Monte Carlo (MC) event generators at next-to-leading-order (NLO): Powheg-Boxv2[18–21] and MadGraph5_aMC@NLO [22] interfaced with Pythia8 [23] and Herwig7 [24], and Sherpa v2.2 [25].
2 ATLAS detector
The ATLAS detector [2] is a multi-purpose particle physics detector with a forward–backward symmetric cylindrical geometry and nearly 4πcoverage in solid angle, up to|η| =4.91. The layout of the detector is based on four superconducting magnet systems, which comprise a thin solenoid surrounding the inner tracking detectors (ID) and a barrel and two end-cap toroids generating the magnetic field for a large muon spectrometer. The ID is comprised of two silicon sub-detectors, namely an inner pixel detector and an outer strip tracker, inside a Transition Radiation Tracker (TRT) based on gas-filled drift tubes. The calorimeters are located between the ID and the muon system. The lead/liquid-argon (LAr) electromagnetic (EM) calorimeter is split into two regions: the barrel (|η| <1.475) and the end-cap (1.375< |η| <3.2).
The hadronic calorimeter is divided into four regions: the barrel (|η| < 1.0) and the extended barrel (0.8 < |η| <1.7) made of scintillator/steel, the end-cap (1.5< |η| <3.2) with LAr/copper modules, and the forward calorimeter (3.1< |η| <4.9) composed of LAr/copper and LAr/tungsten modules.
A two-level trigger system [26] is used to select events for further analysis. The first level (L1) of the trigger reduces the event rate to about 100 kHz using hardware-based trigger algorithms acting on a subset of detector information. The second High-Level Trigger (HLT) uses a combination of fast online algorithms and reconstruction software with algorithms similar to the offline versions. The software-based trigger further reduces the average event rate to about 1000 Hz.
3 Collision data and simulated event samples
The data used for this analysis were recorded with the ATLAS detector fromppcollisions at
√s= 13 TeV in 2015 and 2016 with an average number ofppinteractions per bunch crossinghµiof around 23. The selected data sample corresponds to an integrated luminosity of 36.1 fb−1with an uncertainty of 2.1% [27]
obtained using the LUCID-2 detector [28] for the primary luminosity measurements. Only the data collected while all sub-detectors were operational are considered.
The events for this analysis were collected using a multi-jet trigger. This trigger selects events containing six jets with a minimumpT of 45 GeV in the central region of the detector; theηacceptance of all six jets changed from|η| <3.2 in 2015 to|η| <2.4 in 2016 to reduce triggered event rates. Jets at the HLT are reconstructed with the anti-kt jet algorithm [29] using a radius parameter,R, of 0.4 and are calibrated. This trigger was chosen as it provides a high efficiency for signal events, but places no constraint onb-tagged jets, which is crucial for evaluating background contributions in data.
The physics processes of interest to this analysis are:tt¯events with bothW-bosons decaying hadronically (all- hadronic signal),t¯tevents with at least oneW-boson decaying leptonically (non-all-hadronic background) and multi-jet production from purely strong interaction processes (multi-jet background).
1ATLAS uses a right-handed Cartesian coordinate system with its origin at the nominal interaction point (IP) in the centre of the detector. Thez-axis is taken along the beam pipe, and thex-axis points from the IP to the centre of the LHC ring. Cylindrical coordinates (r,φ) are used in the transverse plane,φbeing the azimuthal angle around the beam pipe. The rapidityyis defined by12lnE+pE−pzz, while the pseudorapidity is defined in terms of the polar angleθasη=−ln tan(θ/2).
3.1 Top pair simulation samples
Tthe MC generators listed in Table1 are used to simulate t¯t event samples for unfolding corrections (Section8), systematic uncertainty estimates and comparison with results at the pre- and post-unfolding level. The top-quark mass (mt) and width were set to 172.5 GeV and 1.32 GeV, respectively, in all MC event generators.
Application tt¯signal tt¯radiation syst. tt¯PS syst. t¯tME syst. tt¯comparison
Generator Powheg-Box v2 MadGraph5/
Sherpa 2.2.1 aMC@NLO 2.6.0
σprecision NNLO + NNLL
PDF for ME NNPDF3.0NLO
Parton shower Pythia8 Herwig7 Pythia8 ME+PS@NLO
PDF for PS NNPDF2.3LO MMHT2014 NNPDF2.3LO
Tune A14 Var3cUp Var3cDown H7UEMMHT A14 –
Scales hdamp=1.5mt hdamp=3mt hdamp=1.5mt
hdamp=1.5mt µq=HT/2 – µR,F=0.5 µR,F=2.0
Table 1: Summary oftt¯MC samples used in the analysis, showing the generator for the hard-scattering process, cross-section (σ) normalisation precision, PDF choices for the hard process matrix element (ME) and parton shower (PS), as well as the parton shower and hadronisation generator and the corresponding tune and scales.
The EvtGen v1.2.0 program [30] was used to simulate the decay of bottom and charm hadrons, except for samples generated with Sherpa [25]. Multiple overlaidppcollisions (pile-up) were simulated with the low-pTQCD processes of Pythia 8.186 [23] using a set of tuned parameters called the A3 tune [31] and the NNPDF2.3LO [32] set of parton distribution functions (PDFs).
The detector response is simulated using the Geant4 framework [33,34]. The data and MC events were reconstructed with the same software algorithms.
For the generation of tt¯ events, matrix elements (ME) were calculated at NLO in QCD using the Powheg-Box v2 [19,20] event generator with the NNPDF3.0NLO PDF set [35]. Pythia 8.210 with the NNPDF2.3LO [36] PDF set and the A14 [37] tune was used to simulate the parton shower, fragmentation and underlying event. Thehdampparameter, which controls thepT of the first gluon or quark emission beyond the Born configuration in Powheg-Box v2, was set to 1.5mt. The main effect of this parameter is to regulate the high-pTemission against which thet¯tsystem recoils. A dynamic value
q
m2t +p2
T,t was used for the factorisation and renormalisation scales (µFandµRrespectively). Signaltt¯events generated with those settings are referred to as the nominal signal sample.
The effects of different levels of initial state radiation (ISR) were evaluated using two samples with different factorisation and renormalisation scales relative to the nominal signal sample, as well as a differenthdamp parameter value. Specifically, two settings for Powheg+Pythia8 were compared [38]:
• in one sampleµF,Rwere reduced by a factor of 0.5, thehdampparameter is increased to 3mtand the Var3cUp A14 tune variation was used. In all the following Figures and Tables the predictions based on this MC sample are referred to as ‘PWG+PY8 Up’;
• in the other sampleµF,Rwere increased by a factor of 2, thehdampparameter was set to 1.5mtas in the nominal sample and the Var3cDown A14 tune variation was used. In all the following Figures and Tables the predictions based on this MC sample are referred to as ‘PWG+PY8 Down’.
To estimate the effect of the parton shower and hadronisation algorithms, a Powheg+Herwig7 sample was generated with Powheg set up in the same way as for the nominal sample. The parton shower, hadronisation and underlying event simulation were produced with Herwig7 [24,39] (version 7.0.4) using the MMHT2014lo68cl PDF set and H7-UE-MMHT tune [40]. Detector simulation was performed using a fast simulation based on a parameterisation of the performance of the ATLAS electromagnetic and hadronic calorimeters [41] (AtlFastII) and on GEANT4 elsewhere.
The impact of the matrix element generator choice was evaluated using events generated with Mad- Graph5_aMC@NLO+Pythia8 at NLO accuracy. The events were generated with version 2.6.0 of MadGraph5_aMC@NLO [22] andµq = HT/2 for the shower starting scale functional form [42]. As for the Powheg+Pythia8 samples, the NNPDF3.0NLO PDF set was used for the matrix element and the NNPDF2.3LO set for the parton shower. Calorimeter simulation was performed using AtlFastII.
An additional sample oft¯tevents generated with Sherpa 2.2.1 to provide an extra point of comparison [25].
This sample is produced at NLO in QCD for up to 1 additional parton emission, and LO for up to 4 additional partons, using the MEPSNLO merging scheme [43], with the CKKW merging scale fixed at 30 GeV [42]. Loop integrals were calculated with OpenLoops [44]. The shower, factorisation and renormalisation scales were set toµ=q
m2t +0.5(p2T,t+p2
T,t¯), and the NNPDF2.3LO PDF set was used.
The cross section used to normalise thet¯tsamples wasσt¯t =832+20−29(scale) ±35(PDF, αS)pb, as calculated with the Top++2.0 program at NNLO in perturbative QCD, including soft-gluon resummation to next- to-next-to-leading-log order (NNLL) [21,45–50], and assumingmt = 172.5 GeV. The first uncertainty comes from the independent variation of the factorisation and renormalisation scales,µFandµR, while the second one is associated with variations in the PDF andαS, following the PDF4LHC prescription with the MSTW2008 68% CL NNLO, CT10 NNLO and NNPDF2.3 5f FFN PDF sets, described in Refs. [36, 51–53].
Top-quark pair events in which at least one of theW-bosons decays via a lepton and a neutrino are a source of background contamination if the leptons are not identified. Simulatedt¯tevents with one or two leptonic decays are produced with the same settings used for the nominal signal sample.
4 Object reconstruction
The following sections describe the detector-, particle- and parton-level objects used to characterise the final-state event topology and to define the fiducial and full phase-space regions for the measurements. The final state of interest to this measurement includes jets, some of which may beb-tagged, but contains no isolated electrons, muons or tau leptons.
4.1 Detector-level object reconstruction
Primary vertices are formed from reconstructed tracks which are spatially compatible with the interaction region. The hard-scatter primary vertex is chosen to be the one with at least two associated tracks and the highestÍ
p2
T, where the sum extends over all tracks withpT >0.4 GeV matched to the vertex.
Jets are reconstructed from topological clusters of calorimeter cells that are noise-suppressed and calibrated to the electromagnetic scale [54] using the anti-ktalgorithm with a radius parameterR=0.4 as implemented
in FastJet [55]. The jets are corrected using a subtraction procedure that accounts for the jet area to estimate and remove the average energy contributed by pile-up interactions [56]; these corrections can change the jet four-momentum. This procedure is followed by a jet-energy-scale (JES) calibration that restores the jet energy to the mean response of a particle-level simulation, refined by applying a series of additional calibrations that correct finer variations due to jet flavour and detector geometry andin situcorrections that match the data to the simulation energy scale [57].
Jets must satisfypT >25 GeV and|η| <2.5 and pass the overlap removal with leptons, as described below.
To reduce the number of jets that originate from pile-up, an additional requirement on the association of a jet to a vertex, the Jet Vertex Tagger (JVT) [58], is applied. Every jet in the rangepT < 60 GeV and
|η| < 2.4 must satisfy the criterion JVT > 0.59. The JVT discriminant is based on the degree of association to the hard scatter vertex of tracks matched to the jet through a ghost-association technique described in Ref. [59].
Jets containingb-hadrons are tagged asb-jets using a multivariate discriminant (MV2c10) [60]. It combines information from the impact parameters of displaced tracks and from the location and topological properties of secondary and tertiary decay vertices reconstructed within the jet. The jets are consideredb-tagged if the value of the discriminant is larger than a threshold applied on the discriminant output value, chosen to provide a specificb-jet efficiency on an inclusivet¯tsample. In this analysis, a threshold corresponding to 70%b-jet efficiency is chosen. The corresponding rejection factors for jets initiated by charm quarks or lighter quark flavours are approximately 12 and 380, respectively [61].
Electron candidates are reconstructed from clusters of energy in the calorimeter combined with an inner detector (ID) track that is refitted using Gaussian Sum Filters and calibrated using a multivariate regression [62,63]. They must satisfypT >15 GeV and|ηclus| <1.37 or 1.52< |ηclus| <2.47 and pass the “Tight” likelihood-based identification criterion based on shower shapes in the EM calorimeter, track quality and detection of transition radiation produced in the TRT detector [64]. Isolation requirements based on calorimeter and tracking quantities are used to reduce the background from jets misidentified as prompt leptons (fake leptons) or due to semi-leptonic decays of heavy-flavour hadrons (non-prompt real leptons) [63]. The isolation criteria arepT- andη-dependent, and ensure an efficiency of 90% for electrons withpTof 25 GeV and 99% efficiency for electrons withpTof 60 GeV.
Muon candidates are reconstructed using high-quality ID tracks combined with tracks reconstructed in the muon spectrometer [65]. They must satisfypT >15 GeV,|η|< 2.5. To reduce the background from muons originating from heavy-flavour decays inside jets, muons are required to be isolated using track quality and isolation criteria similar to those applied to electrons.
Hadronically decayingτ-lepton (τhad) candidates are reconstructed from hadronic jets associated with either one or three ID tracks with a total charge of±1 [66,67]. Tau candidates withpT >25 GeV and|η| < 2.5 are considered. A Boosted Decision Tree (BDT) discriminant is used to distinguishτhadcandidates from quark- or gluon-initiated jets, for which the “Medium” working point is used. A second BDT is used to eliminate electrons faking aτ, for which a “Loose” working point was selected.
For objects satisfying both the jet and lepton selection criteria, a procedure called “overlap removal” is applied to assign objects a unique particle hypothesis, favouring well identified and isolated particles.
If an electron candidate shares a track with a muon candidate, the electron is removed, as it is likely to result from final state radiation (FSR). If a jet and an electron are within∆R=p
∆η2+∆φ2< 0.2 the jet is discarded. If the distance in∆Rbetween a surviving jet and an electron is smaller than 0.4, then the electron is discarded. If a muon track is ghost-associated to a jet, or a jet and a muon are within∆R< 0.2, then the jet is removed if its pT, total trackpT and number of tracks are consistent with muon FSR or
energy loss. If the distance in∆Rbetween a jet and a muon candidate is∆R<0.4, the muon is discarded;
otherwise the jet is removed. Finally, if the distance in∆Rbetween a jet and a tau jet is∆R<0.2, then the jet is discarded.
4.2 Particle- and parton-level objects and phase-spaces definition
Particle-level objects are defined in simulated events using only stable particles, i.e. particles with a mean lifetimeτ> 30 ps. The fiducial phase space for the measurements presented in this paper is defined using a series of requirements applied to particle-level objects, analogous to those used in the selection of the detector-level objects, described above.
Electrons and muons are required not to originate from a hadron in the MC truth record, whether directly or through a τdecay. This ensures that the lepton is from an electroweak decay without requiring a directW-boson match. The four-momenta of the bare leptons are then modified (dressed) by adding the four-momenta of all photons within a cone of size∆R=0.1, to take into account final-state photon radiation. Dressed electrons are then required to havepT >15 GeV and|η|< 1.37 or 1.52< |η|< 2.47.
Dressed muons are required to havepT > 15 GeV and|η| <2.5.
Particle-level jets are reconstructed using the same anti-kt algorithm used at detector level. The jet- reconstruction procedure takes as input all stable particles, except for charged leptons not from hadron decays as described above, inside a radiusR=0.4. Particle-level jets are required to havepT >25 GeV and|η| <2.5. A jet is identified as ab-jet if a hadron containing ab-quark is matched to the jet using the ghost-association procedure; the hadron must havepT > 5 GeV.
The simulated top-quark four-momenta are recorded after parton shower but before decays are simulated, and correspond to the parton-level description of the event. The full phase-space is defined by the set oft¯t pairs in which both top quarks decay hadronically. The measurements presented in this paper cover the entire phase-space.
5 Event selection and reconstruction
After events have been selected by the trigger, a series of selection criteria are applied to define a signal region (SR) containing a pure sample of resolved all-hadronic top-quark pair events. First, events are removed if detector defects or data corruption are identified, or if the events do not contain a primary vertex with at least two associated tracks. Events must contain at least six jets withpT >55 GeV and|η| <2.4 to be in a regime where the trigger fires with high efficiency. Exactly twob-tagged jets must be found.
A veto is applied on events containing at least one electron or muon withpT >15 GeV, or aτ-jet with pT> 25 GeV.
Subsequently, att¯reconstruction procedure is implemented, to suppress backgrounds from multi-jet production and to calculate the observables to be measured (see Section7).
5.1 Kinematic reconstruction of thett¯system
The identification of two top-quark candidates from the many jets in the event is a combinatorially complex problem. Eachb-jet is assigned to one top-quark candidate, and permutations are formed for each set of four jets, selected from the remaining jets in the event. These four “light” jets are paired-up to formW-boson candidates and eachWcandidate is, in turn, matched with one of theb-jets to form a top-quark candidate.
For theW-boson pairings andb−Wpairings, all unique permutations are considered. A chi-square (χ2) discriminant is computed for each permutation to judge whether the considered permutation is compatible with the hypothesis of a top-quark pair; the permutation with the smallest chi-square χ2
minis chosen as the one best describing the event as production of a top-quark pair decay.
The χ2discriminant is defined as:
χ2= (mb1j1j2−mb2j3j4)2
σt2 + (mj1j2−mW)2
σW2 + (mj3j4−mW)2
σW2 , (1)
wheremt,1 = mb1j1j2 andmt,2 = mb2j3j4 are the invariant masses of the jets associated with the decay products of the leading and sub-leading top quark, sorted inpT, respectively.2 Similarly,mj1j2andmj3j4 are the invariant masses of the jets associated with the decay products of theWbosons from the top quarks.
TheW-boson mass is taken to bemW = 80.4 GeV [68]. Finally, σt = 10.7 GeV and σW = 5.9 GeV respectively represent the resolutions on the top quark andW-boson masses assuming the correct jet matching, as determined in simulatedt¯tevents in which the jet assignments were fixed unambiguously by matching jets to decay partons. The χ2minimisation successfully matches all jets to top decay partons in approximately 60% oft¯tevents with exactly 6 jets, while combinatorial confusion in events with up to three additional jets can cause the matching to degrade by 10-20%.
5.2 Multi-jet background rejection The χ2
minis used as a first discriminant to reject background events; multi-jet events produce larger χ2
min
values, hence events are rejected if they have χ2
min> 10. In addition, the mass of the two reconstructed top quarks is required to be in the range 130< mt,1,mt,2 <200 GeV.
The top-antitop quarks are normally produced back-to-back in the transverse plane, hence the twob-tagged jets are produced at large angles. In contrast, the dominant mechanism for producingb-jets in background multi-jet events isg→bb¯which typically results in collinearb-jets. Therefore the∆Rdistance between the twob-jets,∆Rbb, is required to be larger than 2. Similarly, the larger of the two angles between a b-tagged jet and its associatedWboson,∆RbWmax, has good discriminating power due to the tendency for the top-quark decay products to be slightly collimated, thus the requirement∆RbWmax<2.2 is imposed.
Table2summarises the selection criteria defining the signal region at reconstruction level. The fiducial phase space used for unfolding to particle level is defined by the same selections, with two exceptions.
First, no trigger selection need be applied, as the six-jet selection ensures full efficiency. Second, in place of theb-tagging requirements, the truthb-hadron labelling is used, as described in Section4.2.
In the data, 44 573 events pass the full event selection. The signal purity is predicted to be 68% for the nominal all-hadronictt¯sample, with an uncertainty of 8.4%.
2In this paper, “leading”, “sub-leading”etc.are always taken to refer topT-ordering, for brevity.
Requirement Event selection Multi-jet trigger 6 jets,pT > 45 GeV Exactly 0 isolated leptons µ: pT >15 GeV,|η|<2.5
e: pT > 15 GeV,|η|<2.47, excluding 1.37<|η|<1.52 τ: pT > 25 GeV,|η|<2.5
At least 6 jets 6 leading jets: pT >55 GeV Subleading jets: pT >25 GeV Exactly 2b-jets b-tagging at 70% efficiency
Top mass 130 GeV< mt,1,mt,2 <200 GeV Reconstructed χ2
min χ2
min< 10.0
∆Rbetweenb-jets ∆Rbb> 2.0
Maximum∆Rbetweenb-jet andW ∆Rmax
bW <2.2 Table 2: Summary of selection requirements.
6 Background estimation
The signal region of the resolved all hadronic topology is contaminated by two major sources of background, as shown in Table6. The contribution of top-quark pair production decaying to non-hadronic final states is expected to be 5% of the selected all-hadronic prediction and 3% of the total data yield. The non-hadronic contribution is estimated using the same MC simulated samples as for the signal, but filtering instead for at least one leptonicWdecay. The total single-top-quark contribution was estimated to be below 2% of the selected data and well within both MC and data statistical error. For this reason it is not considered further.
Multi-jet production forms the most significant source of background contamination at about a third of the total selected number of events. This is estimated using a data-driven procedure, as described below.
6.1 Data-driven estimate of multi-jet background
The estimate of the multi-jet background component is performed using the “ABCD Method”, which can be applied whenever two variables exist that each provide good signal–background discrimination, while their distributions in the background process are uncorrelated. A similar method was used in previous measurements [17,69]. The best performing pair of discriminating variables were found to be theb-jet multiplicity (Nb-jets) and a combination of the two top-quark-candidate masses. The masses of the two top-quark candidates are used to define two different mass regions as described in Table3.
Mass region Condition
Tail At least one top quark withmt <120 GeV ormt >250 GeV Peak Both top quarks have 130 GeV <mt <200 GeV
Table 3: Definition of the mass region based on themtof the two top quark candidates.
The two variables identify six different regions as shown in Table4. The region corresponding to the signal region is regionD, defined by Nb-jets= 2 and 130 GeV< mt <200 GeV for both top quark candidates, together with the other criteria in Table 2. Background control regions are defined by a lower b-jet multiplicity and/or in the sidebands of the top-quark candidate mass distribution. In the control regions, at least one top-quark candidates must satisfymt <120 GeV ormt > 250 GeV. Excluding events where one top-quark candidate is in the signal region mass window and the other falls in either of the intermediate ranges 120 GeV<mt < 130 GeV or 200 GeV< mt <250 GeV strongly reduces the signal contamination in the control regions with a negligible increase in the total statistical uncertainty (at 1% level), improving the overall robustness of the estimate.
Tail Peak Nb-jets=0 A0 B0 Nb-jets=1 A1 B1
Nb-jets=2 C D
Table 4: Division into orthogonal regions according to theNb-jetsparameter and a combination of the two top-quark masses as defined in Table3.
The background estimate is carried out for each bin in the measured distributions. The differential background estimate D in one bin of a generic observableXis defined as:
D(X)= B1(X) ·C(X)
A1(X) , (2)
where the control region background yields{A1,B1,C}are determined by subtracting the MCt¯tpredictions (of all decay modes) from the data yields in each region.
A parallel estimateD0is made using regions A0andB0to assess the systematic uncertainty of the method, which accounts for potential differences in the kinematic properties for the various flavour components of the multi-jet background. This is defined as:
D0(X)= B0(X) ·C(X)
A0(X) , (3)
such that∆D= D0−Dgives the systematic uncertainty on the nominal predictionD.
Table5shows the fraction of signal and backgroundtt¯events estimated from MC in the various regions.
More signal contamination is observed in regions withb-tagged jets, but sufficient background purity is observed in all regions such that signal mismodelling should not substantially bias the background prediction.
The spectra of observables used to define the signal region, namely χ2
min,∆Rbb and∆RmaxbW are presented in Figure1. These plots are done in an “N−1” requirement configuration; the plot for a particular variable
Region Definition All-hadronict¯t/Data Non all-hadronictt¯/Data
A0 Nb-jets=0 tail 1.87 % 0.19 %
B0 Nb-jets=0 peak 0.96 % 0.08 %
A1 Nb-jets=1 tail 3.35 % 0.69 %
B1 Nb-jets=1 peak 16.10 % 1.16 %
C Nb-jets=2 tail 16.14 % 2.90 %
D Nb-jets=2 peak 66.09 % 3.35 %
Table 5: Fractional yields from top-quark pair production processes in the different regions, defined by the values assumed byNb-jetsand the two top quarksmtas defined in Table3.
is made after applying all signal region requirements except that on the variable being displayed. The mt,1andmt,2spectra are not shown since those observables are used to define the control regions in the multi-jet estimation.
Although the total predictions do not perfectly reproduce the data distributions everywhere they are compatible with data within the total uncertainties, given for illustrative purposes by the sum of statistical and dominant systematic components. The dominant source of uncertainties in the six-jet case is thet¯t theoretical modelling (parton shower and initial-state radiation), whereas the systematic uncertainty on the multi-jet estimate dominates the inclusive jet distributions. Together, the comparisons indicate an adequate description of the signal and background processes.
The event yields after this selection are shown in Table6for data, simulated MC signal and background (as estimated following the procedure described in Section6).
Process Event yield Fraction (%) tt¯(all-hadronic) 29 500+2000−2500 68%
t¯t(non all-hadronic) 1490+140−120 3%
Multijet background 12 600+1900−1900 29%
Total prediction 43 500+2800−3000
Data 44 573
Table 6: Event yields for data, signal and background processes after the signal region selection. Uncertainties are quoted as the sum in quadrature of statistical and detector-level systematic uncertainties. The composition of the selected events is also given in terms of the fractional contribution of the signal and background processes to the total yield.
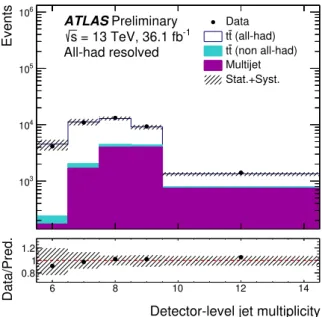
Figure2shows the jet multiplicity distribution for selected events in data compared to the total SM prediction.
This demonstrates that the 6-jet bin is essentially puret¯t, with negligible background contamination, and in fact the nominal signal MC slightly exceeds the data yield. In higher jet multiplicity bins the combinatorial difficulty for correctly identifying the jets from the top-quark decays increases, resulting in a growing multi-jet background contribution.
0 2 4 6 8
10 12 14 16 18 20
2 4 6 8 10 12 14 16 18 103
×
Events / 1.2
= 13 TeV, 36.1 fb-1
s
ATLASPreliminary All-had resolved
Data (all-had) t t
(non all-had) t t Multijet Stat.+Syst.
0 5 10 15 20
min
χ2
Detector-level 0.60.81
1.21.4
Data/Pred.
(a)
0
0.5 1.5 2.5 3.5 4.5 2 3 4 5 1
0 10 20 30 40 50 60 103
×
Events / 0.2
= 13 TeV, 36.1 fb-1
s
ATLASPreliminary All-had resolved
Data (all-had) t t
(non all-had) t t Multijet Stat.+Syst.
0 2 4
Rbb
∆ Detector-level 0.5
1 1.5
Data/Pred.
(b)
0
0.5 1.5 2.5 3.5 2 3 1
0 10 20 30 40 50 60 70 103
×
Events / 0.2
= 13 TeV, 36.1 fb-1
s
ATLASPreliminary All-had resolved
Data (all-had) t t
(non all-had) t t Multijet Stat.+Syst.
0 1 2 3
max
RbW
∆ Detector-level 0
0.5 1 1.5 2
Data/Pred.
(c)
0 2 4 6 8
10 12 14 16 18 20
200 400 600 800 1000 1200 1400 1600 1800
Events / 1.2
= 13 TeV, 36.1 fb-1
s
ATLASPreliminary All-had resolved
Data (all-had) t t
(non all-had) t t Multijet Stat.+Syst.
0 5 10 15 20
min
χ2
Detector-level 0.60.81
1.2 1.4
Data/Pred.
(d)
0
0.5 1.5 2.5 3.5 4.5 2 3 4 5 1
0 1000 2000 3000 4000 5000 6000 7000
Events / 0.2
= 13 TeV, 36.1 fb-1
s
ATLASPreliminary All-had resolved
Data (all-had) t t
(non all-had) t t Multijet Stat.+Syst.
0 2 4
Rbb
Detector-level ∆ 0.5
1 1.5
Data/Pred.
(e)
0
0.5 1.5 2.5 3.5 2 3 1
0 2 4 6 8 10 103
×
Events / 0.2
= 13 TeV, 36.1 fb-1
s
ATLASPreliminary All-had resolved
Data (all-had) t t
(non all-had) t t Multijet Stat.+Syst.
0 1 2 3
max
RbW
Detector-level ∆ 0
0.5 1 1.5 2
Data/Pred.
(f) Figure 1: Detector-level distributions in the signal regions as a function of the (left) χ2
min, (middle)∆Rbband (right)
∆RmaxbW, for (top) all selected events and (bottom) exclusive six-jet events. The signal prediction is based on the Powheg+Pythia8 generator. The background is the sum of the data-driven multi-jet estimate and the MC-based expectation for the contributions of non all-hadronictt¯production process. Statistical uncertainties combined with the dominant systematics for the applied selection are shown in hatching. In the inclusiveNjetsselection, only the systematic uncertainty on the multi-jet background estimate is included, while for the six-jet selection only thet¯t modelling uncertainties are considered.
12
6 8
10 12 14
103
104
105
106
Events -1 = 13 TeV, 36.1 fbs
ATLASPreliminary All-had resolved
Data (all-had) t t
(non all-had) t
t Multijet Stat.+Syst.
6 8 10 12 14
Detector-level jet multiplicity
0.8 1 1.2
Data/Pred.
Figure 2: Jet multiplicity in the SR. The signal prediction is based on the Powheg+Pythia8 generator. The background is the sum of the data-driven multi-jet estimate (purple histogram) and the MC-based expectation for the contributions of non-all-hadronictt¯production process (light blue histogram). Statistical uncertainties combined with relevant systematics are shown in hatching.
13