A TLAS-CONF-2018-032 11/07/2018
ATLAS CONF Note
ATLAS-CONF-2018-032
July 11, 2018
Combination of the searches for pair-produced vector-like partners of the third generation quarks
at √
s = 13 TeV with the ATLAS detector
The ATLAS Collaboration
A combination of the searches for pair-produced vector-like partners of the top and bottom quarks in various decay channels ( T →Zt/W b/Ht , B→Z b/Wt/Hb ) is performed using 36.1 fb
−1of pp collision data at
√ s = 13 TeV with the ATLAS detector at the Large Hadron Collider. The observed data are found to be in good agreement with the Standard Model background prediction and upper limits are set at 95% confidence level on the production cross-section for a range of vector-like quark scenarios, significantly extending the reach of the individual searches. A singlet T is excluded for masses below 1.31 TeV and a singlet B is excluded for masses below 1.22 TeV. Assuming a weak isospin (T, B) doublet, T masses below 1.37 TeV and B masses below 1.37 TeV are excluded.
This version includes a textual correction on the additional S
Tselection applied in the
Z (νν)t + X analysis (page 4).
1 Introduction
Naturalness arguments [1] suggest there should be a mechanism that cancels the quadratic divergence of the Higgs boson mass caused by radiative corrections from Standard Model (SM) particles. Several explanations have been proposed in theories beyond the SM. Little Higgs [2, 3] and Composite Higgs [4, 5]
models introduce a spontaneously broken global symmetry, with the Higgs boson emerging as a pseudo–
Nambu–Goldstone boson [6]. Such models predict the existence of vector-like quarks (VLQs), color-triplet spin-1/2 fermions whose left- and right-handed chiralities transform the same under weak-isospin [7, 8].
In these models, VLQs are expected to couple preferentially to third-generation quarks [7, 9] and can have flavor-changing neutral-current decays, in addition to charged-current decays. An up-type VLQ T with charge +2 / 3 can decay to W b , Zt , or Ht . Similarly, a down-type quark B with charge − 1 / 3 can decay to Wt , Z b , or Hb . To be consistent with results from precision electroweak measurements, the mass splitting between VLQs belonging to the same SU(2) multiplet is required to be small [10], forbidding cascade decays such as T →W B . Couplings between the VLQs and the first and second generation quarks, although not favored, are not excluded [11, 12].
At the Large Hadron Collider (LHC), VLQs with masses below approximately 1 TeV would mainly be pair-produced, a process dominated by the strong interaction (QCD pair-production). The corresponding predicted cross-section ranges from 195 fb to 2.0 fb for quark masses from 800 GeV to 1500 GeV [13]
and depends only on the quark mass. Production of single VLQs via the electroweak interaction is also possible, but depends on the strength of the interaction between the new quarks and the weak gauge bosons. Unlike the SM quarks, VLQs can have both charge-current and neutral-current decays at tree-level.
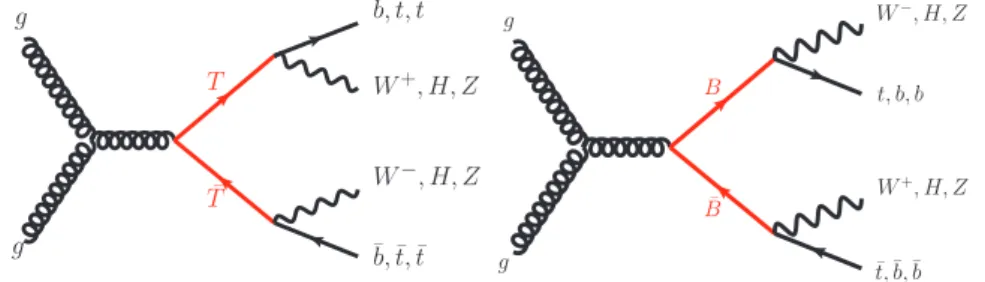
Representative Feynman diagrams for B B ¯ and T T ¯ production and decay are shown in Figure 1.
T
T¯ W−, H, Z
¯b,¯t,t¯ b, t, t W+, H, Z
g g
B
B¯ W+, H, Z
t,¯¯b,¯b t, b, b W−, H, Z
g g
Figure 1: Representative leading-order Feynman diagrams for (left) T T ¯ and (right) B B ¯ pair-production. The studied VLQ decays are also displayed.
The branching ratio ( B ) for each decay mode ( T →W b, Zt, Ht and B→Wt, Z b, Hb ) depends on the VLQ mass and weak-isospin quantum numbers, as calculated in Ref. [8]. For a singlet T , all three decay modes have sizable branching ratios, while the charged-current decay mode T →W b is absent if T is part of a doublet. The doublet prediction is valid for a (X, T ) doublet, where X is a VLQ with a charge of +5 / 3, or a (T , B) doublet with |V
T b| |V
t B| , where V
i jare the elements of a generalized Cabibbo–Kobayashi–
Maskawa matrix [8]. Since the T quark branching ratios are identical in both doublets, no distinction is made between them when referring to the doublet T results. A singlet B will have a sizable branching ratio to all three decay channels, while the branching ratios for a doublet B depend on whether it is in a (T , B) doublet or (B, Y ) doublet, where Y is a VLQ with a charge of − 4 / 3. For a (B, Y ) doublet, only neutral current couplings to SM quarks are allowed at leading-order (LO), so the B→Wt decay is forbidden.
Conversely, for a (T , B) doublet with |V
T b| |V
t B| , B→Wt is the only allowed decay. Therefore, the
specific B doublet scenario will be stated when interpreting the results.
2 Contributing analyses
Searches for pair-produced VLQ partners of the third generation quarks have been performed by AT- LAS [14–20] and CMS [21–23] at the LHC at
√ s = 13 TeV. Presented in this note is the full combination of the ATLAS searches using 36.1 fb
−1of data collected in 2015 and 2016. The ATLAS detector is described in Ref. [24]. Below is a brief description of each contributing analysis and the most sensitive decay channel for each analysis is summarized in Table 1.
‘ H(bb)t + X ’ [14]: The primary targets of this analysis are T T ¯ events with at least one VLQ decaying to Ht and H → b b ¯ . Events must have at least six jets [25] and either one lepton (electron [26] or muon [27]) or missing transverse momentum [28] E
missT
> 200 GeV with zero leptons. The analysis uses b -tagging [29, 30] as well as dedicated top and Higgs jet tagging to classify the events into 22 and 12 search regions for the zero-lepton and one-lepton selections, respectively. The final discriminant is the scalar sum of the transverse momenta of the selected jets, lepton, and missing transverse momentum ( S
T). The dominant background is the associated production of a t¯ t pair with b - and c -quark jets, which is modeled via Monte Carlo (MC) simulation and assigned dedicated modeling uncertainties.
‘ W(`ν)b + X ’ [15]: This analysis primarily targets T T ¯ →W bW b events with one W decaying leptonically and the other hadronically. Event selection requires one lepton, ≥ 3 jets, at least one of them being b - tagged, and a hadronically-decaying W boson identified using jet substructure techniques [31]. The final discriminant is the reconstructed mass of the T→W b → `νb candidate. The dominant background is from t¯ t pair production, which is modeled using MC simulation with dedicated modeling uncertainties.
‘ W(`ν)t + X ’ [16]: Very similar to the ‘ W(`ν)b + X ’ analysis, this analysis is optimized to target B B ¯ signals, especially in the case where B→Wt . This analysis discriminates between the signal and the dominant t t ¯ background using a boosted decision tree discriminant.
‘ Z(νν)t + X ’ [17]: This analysis targets T T ¯ →Zt Zt events with an invisible Z decay. Events must have E
missT
> 300 GeV, ≥ 4 jets, and one charged lepton from the decay of a top quark. The analysis defines a single-bin signal region that capitalizes on various E
missT
-based variables and requires at least two high- mass large-radius jets due to the hadronically decaying top and/or heavy bosons from the two VLQ decays.
The dominant backgrounds are t t ¯ +jets, W +jets and single-top, which are estimated from MC simulation and normalized using dedicated control regions.
‘ Z(``)t/b + X ’ [18]: This analysis is searching for both T T ¯ and B B ¯ events containing a leptonically decaying Z boson ( Z → `
+`
−). The analysis requires at least two b -jets and contains an opposite-sign dilepton channel and a trilepton channel. The dominant backgrounds for the dilepton channels are t¯ t and Z +jets, while the trilepton channels are dominated by diboson ( W Z ) and t t Z ¯ events, each modeled by MC simulation.
‘trilepton/same-sign dilepton’ [19]: This analysis targets T T ¯ and B B ¯ decays with multilepton final states,
with particular emphasis on events containing a pair of charged leptons with the same electric charge. Eight
single-bin signal regions are defined based on the number of leptons and b -tagged jets. The background
composition for this analysis varies between signal regions. Contributions from instrumental backgrounds
(fake/non-prompt leptons and charge-flipped electrons) are estimated using data-driven techniques, while
background processes with prompt leptons, originating mostly from t¯ t + W and diboson events, are
modeled from MC simulations.
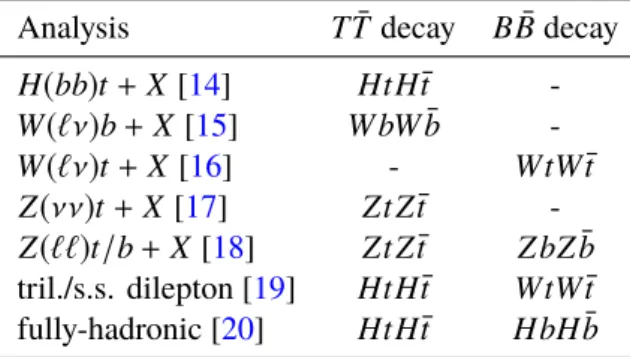
Table 1: The most sensitive decay channel for each analysis entering the combination. A ‘-’ indicates that the analysis was not used for that signal process.
Analysis T T ¯ decay B B ¯ decay H(bb)t + X [14] HtH t ¯ - W(`ν)b + X [15] W bW b ¯ - W(`ν)t + X [16] - WtW t ¯ Z (νν)t + X [17] Zt Z t ¯ - Z (``)t/b + X [18] Zt Z t ¯ Z bZ b ¯ tril./s.s. dilepton [19] HtH t ¯ WtW t ¯ fully-hadronic [20] HtH t ¯ HbH b ¯
‘fully-hadronic’ [20]: This analysis focuses on final states with zero leptons, low- E
missT
, and multiple jets and is the only analysis with significant sensitivity to B B ¯ → HbH b ¯ . Small-radius jets are reclustered [32]
into large-radius jets and identified as top quarks, W/Z , and H bosons using a multi-class deep neural network [33]. The final discriminant is the distribution of the signal likelihood calculated using the matrix element method [34]. The dominant background is from multijet production, which is estimated using a data-driven technique.
Most of the analyses were designed to be complementary, with consistent definitions for the reconstructed physics objects, so only a few additional selection requirements were needed to suppress overlap. Relative to the standalone analyses, the W(`ν)b + X and Z(νν)t + X analyses removed events with ≥ 6 jets and ≥ 3 b -jets to avoid overlap with the H(bb)t + X selection. The Z(νν)t + X analysis also requires S
T< 1 . 8 TeV in a control region to mitigate the overlap with a signal region in the W(`ν)b + X analysis. To reduce overlap with the Z (``)t/b + X analysis, the trilepton/same-sign dilepton analysis removed events with more than three leptons or events with a lepton pair having an invariant mass compatible with a Z boson ( Z -veto).
This Z -veto is the only added selection requirement with significant impact on the individual analysis sensitivity; however, that sensitivity is recovered by the Z(``)t/b + X analysis. After applying these additional selection requirements, the remaining fraction of overlaping events between analysis regions was evaluated to be less than 1% between any two signal regions and less than 3% in general and has negligible impact on the results.
The VLQ signal samples used by the analyses were generated with the LO generator Protos v2.2 [35]
using the NNPDF2.3 LO [36] set of parton distribution functions (PDF) and passed to Pythia 8.186 [37]
for parton showering and fragmentation. The samples are normalized using cross-sections computed with Top++ v2.0 [13] at next-to-next-to-leading order (NNLO) in QCD, including resummation of next-to- next-to-leading logarithmic soft gluon terms [38–42], and using the MSTW 2008 NNLO [43, 44] PDF.
Further details on simulated events and details of the background estimations for each analysis can be found in the respective publications.
3 Statistical analysis
The statistical analysis is the same as in the individual analyses and is based on a binned likelihood
function constructed as the product of the Poisson probabilities of all bins entering the combination. This
function depends on the signal-strength parameter µ , a factor multiplying the theoretical signal cross- section ( µ ≡ σ/σ
theory), and a set of nuisance parameters that encode the effect of systematic uncertainties on the signal and background expectations, which are implemented in the likelihood function by Gaussian or log-normal auxiliary measurements. Additional unconstrained nuisance parameters are included to control the normalization of the main backgrounds, following the settings used in the standalone searches.
The combination is achieved by performing the fit with all bins from all the regions considered from each analysis.
The detector-related uncertainties are treated as fully correlated across analyses, with the following exceptions. The central values and uncertainties on the b -tagging and the luminosity measurement were updated after the publication of the Z (νν)t + X and W(`ν)b + X analyses. Therefore, these uncertainties are correlated between the Z(νν)t + X and W(`ν)b + X analyses, but uncorrelated with the other searches, which are correlated among themselves. Although some background processes are common to multiple analyses, the phase space and the techniques used to estimate those backgrounds can be quite different.
Residual correlations are therefore expected to be negligible, thus modeling uncertainties and background normalization parameters are treated as uncorrelated between analyses. That said, the analysis is limited by statistical uncertainties, so the precise correlation model for the systematic uncertainties was found to not significantly affect the results.
4 Results
The behavior of the combination is consistent with the fits from the individual analyses. The post-fit values of all nuisance parameters are compatible with the standalone analyses, with the constraints generally determined by the analysis most sensitive to the given nuisance parameter. Similarly, the background predictions in each analysis after the combined fit are very close to the results from the standalone analyses. After the combination, no significant excess is observed in the data, so 95% confidence level (CL) limits are set on the cross-section of a VLQ signal. To increase the applicability and usefulness of this combination, limits are evaluated both for benchmark scenarios with specific branching ratios and for general combinations of branching ratios.
For an assumed set of branching ratios, upper limits are set on the production cross-sections for T T ¯ and B B ¯ as a function of the VLQ mass using the CL
smethod [45, 46] with the asymptotic approximation [47].
Observed and expected upper limits on the T T ¯ cross-sections as a function of mass are shown in Figure 2 for the benchmark scenarios of an isospin singlet or doublet T . Analogous limits on the B B ¯ cross-section are shown in Figure 3 for an isospin singlet B or B in a (T , B) doublet. The observed limits from the individual analyses are also shown. For a singlet T , masses below 1.31 TeV are excluded, while a T in an isospin doublet is excluded for masses below 1.37 TeV. A singlet B is excluded for masses below 1.22 TeV, B in the (T , B) doublet is excluded for masses below 1.37 TeV, and B in the (B, Y ) doublet is excluded for masses below 1.14 TeV.
Although the individual analyses are typically designed to target specific decays, they generally have
sensitivity to a much wider range of decay configurations. As a result, the combination is significantly
more sensitive than any one analysis. For example, in the case of the SU(2) singlet, the limit on the T T ¯
cross-section is improved by up to a factor of ∼ 1 . 7, which translates to an increase in the mass limit of
110 GeV.
[GeV]
mT
700 800 900 1000 1100 1200 1300 1400
) [pb]T T→(pp σ
−3
10
−2
10
−1
10 1 10
σ)
±1 Theory (NNLO prediction 95% CL combined observed 95% CL combined expected σ
±1 95% CL expected limit
σ
±2 95% CL expected limit
H(bb)t+X W(lν)b+X Z(ll)t/b+X
Tril./s.s. dilep. Fully-had. Z(νν)t+X
ATLAS Preliminary = 13 TeV, 36.1 fb-1
s SU(2) singlet
[GeV]
mT
700 800 900 1000 1100 1200 1300 1400
) [pb]T T→(pp σ
−3
10
−2
10
−1
10 1 10
σ)
±1 Theory (NNLO prediction 95% CL combined observed 95% CL combined expected σ
±1 95% CL expected limit
σ
±2 95% CL expected limit
H(bb)t+X W(lν)b+X Z(ll)t/b+X
Tril./s.s. dilep. Fully-had. Z(νν)t+X
ATLAS Preliminary = 13 TeV, 36.1 fb-1
s SU(2) doublet
Figure 2: Observed (solid line) and expected (dashed line) 95% CL upper limits on the T T ¯ cross-section versus mass for the combination and the standalone analyses for the (left) singlet and (right) doublet scenarios [8]. The shaded bands correspond to ± 1 and ± 2 standard deviations around the combined expected limit. The thin red line and band show the theory prediction and corresponding uncertainty [13], respectively.
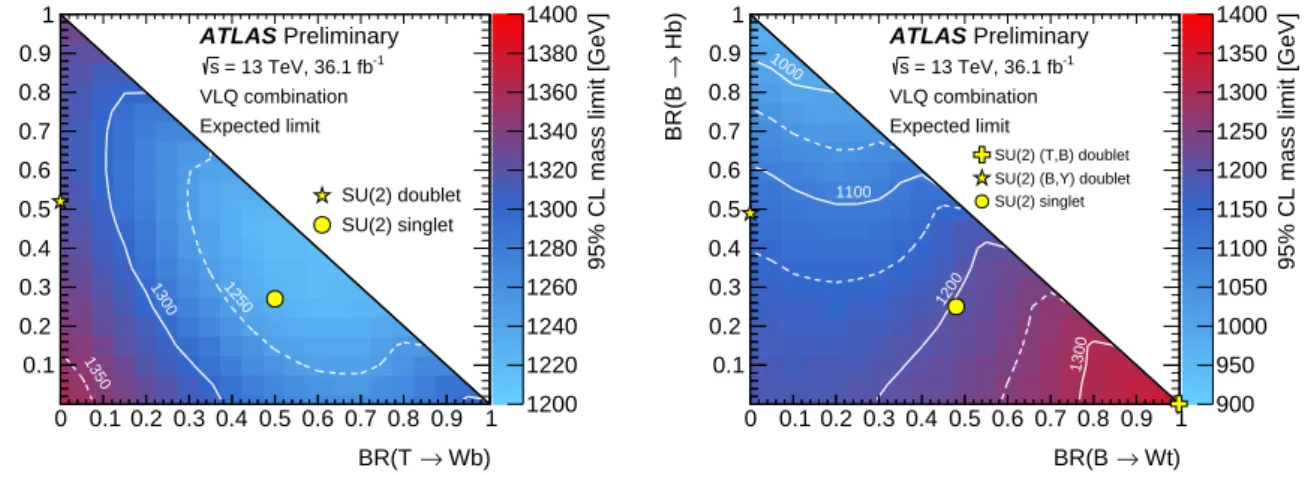
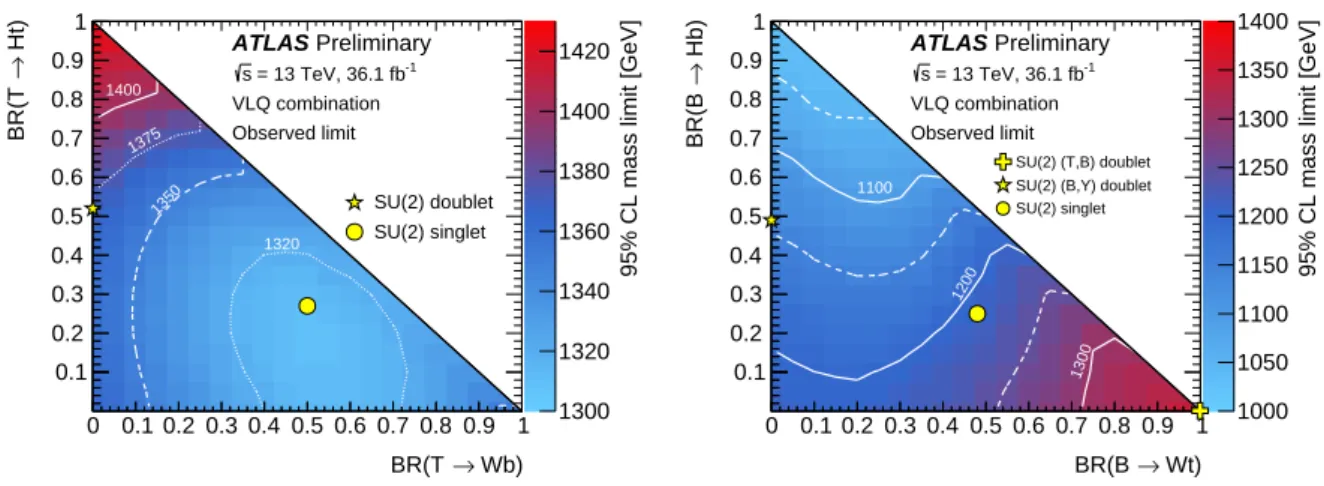
In addition, model-independent lower limits are set on the VLQ mass also for all combinations of branching ratios, assuming B(T→Ht) + B(T →Zt) + B(T →W b) = 1 and B(B→Hb) + B(B→Z b) + B(B→Wt) = 1.
The resulting lower limits on the VLQ mass as a function of branching ratio are presented in Figure 4.
Limits corresponding to B(T →W b) = 1 and B(B→Wt) = 1 are found to also be applicable to Y Y ¯ →W bW b and X X→WtWt ¯ , respectively. The high degree of complementarity between the analyses is clearly demonstrated in Figure 4. For any combination of branching ratios, the combination leads to observed (expected) lower mass limits of 1.31 (1.22) TeV for T and 1.03 (0.98) TeV for B .
5 Conclusion
A combination was performed of seven individual analyses searching for pair-produced VLQ by the
ATLAS experiment. Upper limits on the cross-section are calculated and used to set lower limits on
the VLQ mass for various benchmark scenarios and for general combinations of branching ratios. This
combination results in the most stringent limits to date on VLQ pair-production. Due to the high degree
of complementarity between the analyses, the combination is able to significantly improve the sensitivity
compared to the standalone analyses, for the first time excluding T ( B ) masses below 1.31 (1.03) TeV for
any combination of decays to SM particles.
[GeV]
mB
700 800 900 1000 1100 1200 1300 1400
) [pb]B B→(pp σ
−3
10
−2
10
−1
10 1 10
σ)
±1 Theory (NNLO prediction 95% CL combined observed 95% CL combined expected σ
±1 95% CL expected limit
σ
±2 95% CL expected limit
ν)t+X
W(l Z(ll)t/b+X Tril./s.s. dilep. Fully-had.
ATLAS Preliminary = 13 TeV, 36.1 fb-1
s SU(2) singlet
[GeV]
mB
700 800 900 1000 1100 1200 1300 1400
) [pb]B B→(pp σ
−3
10
−2
10
−1
10 1 10
σ)
±1 Theory (NNLO prediction 95% CL combined observed 95% CL combined expected σ
±1 95% CL expected limit
σ
±2 95% CL expected limit
ν)t+X
W(l Z(ll)t/b+X Tril./s.s. dilep. Fully-had.
ATLAS Preliminary = 13 TeV, 36.1 fb-1
s SU(2) (T,B) doublet
Figure 3: Observed (solid line) and expected (dashed line) 95% CL upper limits on the B B ¯ cross-section versus mass for the combination and the standalone analyses for the (left) singlet and (right) (T , B) doublet scenarios [8].
The shaded bands correspond to ± 1 and ± 2 standard deviations around the combined expected limit. The thin red line and band show the theory prediction and corresponding uncertainty [13], respectively.
0 0.1 0.2 0.3 0.4 0.5 0.6 0.7 0.8 0.9 1
→ Wb) BR(T 0.1
0.2 0.3 0.4 0.5 0.6 0.7 0.8 0.9 1
Ht)→BR(T
1300 1320 1340 1360 1380 1400 1420
95% CL mass limit [GeV]
ATLAS Preliminary = 13 TeV, 36.1 fb-1
s
VLQ combination Observed limit
1320 1350
1375 1400
SU(2) doublet SU(2) singlet
0 0.1 0.2 0.3 0.4 0.5 0.6 0.7 0.8 0.9 1
→ Wt) BR(B 0.1
0.2 0.3 0.4 0.5 0.6 0.7 0.8 0.9 1
Hb)→BR(B
1000 1050 1100 1150 1200 1250 1300 1350 1400
95% CL mass limit [GeV]
ATLAS Preliminary = 13 TeV, 36.1 fb-1
s
VLQ combination Observed limit 1100
1200
1300 SU(2) (T,B) doublet SU(2) (B,Y) doublet SU(2) singlet
Figure 4: Observed lower limits at 95% CL on the mass of the (left) T and (right) B as a function of branching ratio
assuming B(T →Ht) + B(T →Zt) + B(T → W b) = 1 and B(B→Hb) + B(B→Z b) + B(B→Wt) = 1. The yellow
markers indicate the branching ratios for the SU(2) singlet and doublet scenarios with masses above 800 GeV for
which they are approximately independent of the VLQ mass [8].
References
[1] L. Susskind, Dynamics of spontaneous symmetry breaking in the Weinberg-Salam theory , Phys.
Rev. D 20 (1979) 2619.
[2] N. Arkani-Hamed, A. G. Cohen, E. Katz, and A. E. Nelson, The Littlest Higgs , JHEP 0207 (2002) 034, arXiv: hep-ph/0206021 .
[3] M. Schmaltz and D. Tucker-Smith, Little Higgs Theories , Ann. Rev. Nucl. Part. Sci. 55 (2005) 229, arXiv: hep-ph/0502182 .
[4] D. B. Kaplan, H. Georgi, and S. Dimopoulos, Composite Higgs scalars , Phys. Lett. B 136 (1984) 187.
[5] K. Agashe, R. Contino, and A. Pomarol, The minimal composite Higgs model , Nucl. Phys. B 719 (2005) 165, arXiv: hep-ph/0412089 .
[6] C. T. Hill and E. H. Simmons, Strong dynamics and electroweak symmetry breaking , Phys. Rept.
381 (2003) 235, arXiv: hep-ph/0203079 .
[7] F. del Aguila and M. J. Bowick, The Possibility of new fermions with ∆ I = 0 mass , Nucl. Phys. B 224 (1983) 107.
[8] J. A. Aguilar-Saavedra, Identifying top partners at LHC , JHEP 0911 (2009) 030, arXiv: 0907.3155 [hep-ph] .
[9] J. A. Aguilar-Saavedra, Mixing with vector-like quarks: constraints and expectations , EPJ Web Conf. 60 (2013) 16012, arXiv: 1306.4432 [hep-ph] .
[10] J. A. Aguilar-Saavedra, R. Benbrik, S. Heinemeyer, and M. Perez-Victoria, Handbook of vector- like quarks: Mixing and single production , Phys. Rev. D 88 (2013) 094010, arXiv: 1306.0572 [hep-ph] .
[11] A. Atre, M. Carena, T. Han, and J. Santiago, Heavy quarks above the top at the Tevatron , Phys.
Rev. D 79 (2009) 054018, arXiv: 0806.3966 [hep-ph] .
[12] A. Atre, G. Azuelos, M. Carena, T. Han, E. Ozcan, et al., Model-independent searches for new quarks at the LHC , JHEP 1108 (2011) 080, arXiv: 1102.1987 [hep-ph] .
[13] M. Czakon and A. Mitov, Top++: A program for the calculation of the top-pair cross-section at hadron colliders , Comput. Phys. Commun. 185 (2014) 2930, arXiv: 1112.5675 [hep-ph] . [14] ATLAS Collaboration, Search for pair production of up-type vector-like quarks and for four-top-
quark events in final states with multiple b-jets with the ATLAS detector , (2018), arXiv: 1803.09678 [hep-ex] .
[15] ATLAS Collaboration, Search for pair production of heavy vector-like quarks decaying to high-p
TW bosons and b quarks in the lepton-plus-jets final state in pp collisions at √
s=13 TeV with the ATLAS detector , JHEP 10 (2017) 141, arXiv: 1707.03347 [hep-ex] .
[16] ATLAS Collaboration, Search for pair production of heavy vector-like quarks decaying into high- p
TW bosons and top quarks in the lepton-plus-jets final state in pp collisions at √
s=13 TeV with the ATLAS detector , (2018), arXiv: 1806.01762 [hep-ex] .
[17] ATLAS Collaboration, Search for pair production of vector-like top quarks in events with one lepton, jets, and missing transverse momentum in √
s = 13 TeV pp collisions with the ATLAS
detector , JHEP 08 (2017) 052, arXiv: 1705.10751 [hep-ex] .
[18] ATLAS Collaboration, Search for pair- and single-production of vector-like quarks in final states with at least one Z boson decaying into a pair of electrons or muons in pp collision data collected with the ATLAS detector at √
s = 13 TeV , (2018), arXiv: 1806.10555 [hep-ex] .
[19] ATLAS Collaboration, Search for physics beyond the Standard Model in events with same-charge lepton pairs and b-jets with 36.1 fb
−1of √
s = 13 TeV ATLAS data , CERN-EP-2018-171 (In preparation).
[20] ATLAS Collaboration, Search for pair production of heavy vector-like quarks decaying into hadronic final states in pp collisions at √
s=13 TeV with the ATLAS detector , CERN-EP-2018- 176 (In preparation).
[21] CMS Collaboration, Search for single production of a vector-like T quark decaying to a Z boson and a top quark in proton-proton collisions at √
s = 13 TeV , Phys. Lett. B781 (2018) 574, arXiv:
1708.01062 [hep-ex] .
[22] CMS Collaboration, Search for pair production of vector-like quarks in the bWbW channel from proton-proton collisions at √
s = 13 TeV , Phys. Lett. B779 (2018) 82, arXiv: 1710 . 01539 [hep-ex] .
[23] CMS Collaboration, Search for vector-like T and B quark pairs in final states with leptons at √ s = 13 TeV , (2018), arXiv: 1805.04758 [hep-ex] .
[24] ATLAS Collaboration, The ATLAS Experiment at the CERN Large Hadron Collider , JINST 3 (2008) S08003.
[25] ATLAS Collaboration, Jet energy scale measurements and their systematic uncertainties in proton- proton collisions at √
s = 13 TeV with the ATLAS detector , Phys. Rev. D 96 (2017) 072002, arXiv:
1703.09665 [hep-ex] .
[26] ATLAS Collaboration, Electron and photon energy calibration with the ATLAS detector using LHC Run 1 data , Eur. Phys. J. C 74 (2014) 3071, arXiv: 1407.5063 [hep-ex] .
[27] ATLAS Collaboration, Muon reconstruction performance of the ATLAS detector in proton–proton collision data at √
s = 13 TeV , Eur. Phys. J. C 76 (2016) 292, arXiv: 1603.05598 [hep-ex] . [28] ATLAS Collaboration, Performance of missing transverse momentum reconstruction with the
ATLAS detector using proton–proton collisions at √
s = 13 TeV , (2018), arXiv: 1802 . 08168 [hep-ex] .
[29] ATLAS Collaboration, Performance of b-jet identification in the ATLAS experiment , JINST 11 (2016) P04008, arXiv: 1512.01094 [hep-ex] .
[30] ATLAS Collaboration, Optimisation of the ATLAS b-tagging performance for the 2016 LHC Run , ATL-PHYS-PUB-2016-012, 2016, url: https://cds.cern.ch/record/2160731 .
[31] ATLAS Collaboration, Identification of Boosted, Hadronically-Decaying W and Z Bosons in
√ s = 13 TeV Monte Carlo Simulations for ATLAS , ATL-PHYS-PUB-2015-033, 2015, url: https:
//cds.cern.ch/record/2041461 .
[32] B. Nachman, P. Nef, A. Schwartzman, M. Swiatlowski, and C. Wanotayaroj, Jets from Jets: Re- clustering as a tool for large radius jet reconstruction and grooming at the LHC , JHEP 1502 (2015) 075, arXiv: 1407.2922 [hep-ph] .
[33] J. Schmidhuber, Deep learning in neural networks: An overview , Neural Networks 61 (2015) 85,
issn: 0893-6080, url: http://www.sciencedirect.com/science/article/pii/S0893608014002135 .
[34] K. Kondo, Dynamical Likelihood Method for Reconstruction of Events with Missing Momentum. I.
Method and Toy Models , J. Phys. Soc. Jap. 57 (1988) 4126.
[35] J. A. Aguilar-Saavedra, PROTOS, a PROgram for TOp Simulations , http://jaguilar.web.
cern.ch/jaguilar/protos/ .
[36] R. D. Ball et al., Parton distributions with LHC data , Nucl. Phys. B 867 (2013) 244, arXiv:
1207.1303 [hep-ph] .
[37] T. Sjöstrand, S. Mrenna, and P. Z. Skands, A brief introduction to PYTHIA 8.1 , Comput. Phys.
Commun. 178 (2008) 852, arXiv: 0710.3820 [hep-ph] .
[38] M. Cacciari, M. Czakon, M. Mangano, A. Mitov, and P. Nason, Top-pair production at hadron collid- ers with next-to-next-to-leading logarithmic soft-gluon resummation , Phys. Lett. B 710 (2012) 612, arXiv: 1111.5869 [hep-ph] .
[39] P. Bärnreuther, M. Czakon, and A. Mitov, Percent-Level-Precision Physics at the Tevatron: Next- to-Next-to-Leading Order QCD Corrections to q q ¯ → t t ¯ + X , Phys. Rev. Lett. 109 (2012) 132001, arXiv: 1204.5201 [hep-ph] .
[40] M. Czakon and A. Mitov, NNLO corrections to top-pair production at hadron colliders: the all- fermionic scattering channels , JHEP 1212 (2012) 054, arXiv: 1207.0236 [hep-ph] .
[41] M. Czakon and A. Mitov, NNLO corrections to top pair production at hadron colliders: the quark-gluon reaction , JHEP 1301 (2013) 080, arXiv: 1210.6832 [hep-ph] .
[42] M. Czakon, P. Fiedler, and A. Mitov, Total Top-Quark Pair-Production Cross Section at Hadron Colliders Through O(α
S4) , Phys. Rev. Lett. 110 (2013) 252004, arXiv: 1303.6254 [hep-ph] . [43] A. D. Martin, W. J. Stirling, R. S. Thorne, and G. Watt, Parton distributions for the LHC , Eur. Phys.
J. C 63 (2009) 189, arXiv: 0901.0002 [hep-ph] .
[44] A. D. Martin, W. J. Stirling, R. S. Thorne, and G. Watt, Uncertainties on α
Sin global PDF analyses and implications for predicted hadronic cross sections , Eur. Phys. J. C 64 (2009) 653, arXiv:
0905.3531 [hep-ph] .
[45] T. Junk, Confidence level computation for combining searches with small statistics , Nucl. Instrum.
Meth. A 434 (1999) 435, arXiv: hep-ex/9902006 .
[46] A. L. Read, Presentation of search results: the CL
stechnique , J. Phys. G 28 (2002) 2693.
[47] G. Cowan, K. Cranmer, E. Gross, and O. Vitells, Asymptotic formulae for likelihood-based tests of
new physics , Eur. Phys. J. C 71 (2011) 1554, arXiv: 1007.1727 [physics.data-an] .
Appendices
[GeV]
mT
700 800 900 1000 1100 1200 1300 1400
) [pb]T T→(pp σ
−3
10
−2
10
−1
10 1 10
σ)
±1 Theory (NNLO prediction 95% CL combined observed 95% CL combined expected
H(bb)t+X W(lν)b+X Z(ll)t/b+X
Tril./s.s. dilep. Fully-had. Z(νν)t+X
ATLAS Preliminary
= 13 TeV, 36.1 fb
-1s SU(2) singlet
[GeV]
mT
700 800 900 1000 1100 1200 1300 1400
) [pb]T T→(pp σ
−3
10
−2
10
−1
10 1 10
σ)
±1 Theory (NNLO prediction 95% CL combined observed 95% CL combined expected
H(bb)t+X W(lν)b+X Z(ll)t/b+X
Tril./s.s. dilep. Fully-had. Z(νν)t+X
ATLAS Preliminary
= 13 TeV, 36.1 fb
-1s SU(2) doublet
Figure 5: Observed (solid line) and expected (dashed line) 95% CL upper limits on the T T ¯ cross-section as a
function of the T quark mass for the combination and the standalone analyses for the (left) singlet and (right) doublet
scenarios [8]. The thin red line and band show the theory prediction and its ± 1 standard deviation uncertainty [13].
[GeV]
mB
700 800 900 1000 1100 1200 1300 1400
) [pb]B B→(pp σ
−3
10
−2
10
−1
10 1 10
σ)
±1 Theory (NNLO prediction 95% CL combined observed 95% CL combined expected
ν)t+X
W(l Z(ll)t/b+X Tril./s.s. dilep. Fully-had.
ATLAS Preliminary
= 13 TeV, 36.1 fb
-1s SU(2) singlet
[GeV]
mB
700 800 900 1000 1100 1200 1300 1400
) [pb]B B→(pp σ
−3
10
−2
10
−1
10 1 10
σ)
±1 Theory (NNLO prediction 95% CL combined observed 95% CL combined expected
ν)t+X
W(l Z(ll)t/b+X Tril./s.s. dilep. Fully-had.
ATLAS Preliminary
= 13 TeV, 36.1 fb
-1s SU(2) (T,B) doublet
Figure 6: Observed (solid line) and expected (dashed line) 95% CL upper limits on the B B ¯ cross-section as a function of the B quark mass for the combination and the standalone analyses for the (left) singlet and (right) (T , B) doublet scenarios [8]. The thin red line and band show the theory prediction and its ± 1 standard deviation uncertainty [13].
[GeV]
mB
700 800 900 1000 1100 1200 1300 1400
) [pb]B B→(pp σ
−3
10
−2
10
−1
10 1 10
σ)
±1 Theory (NNLO prediction 95% CL combined observed 95% CL combined expected σ
±1 95% CL expected limit
σ
±2 95% CL expected limit
ν)t+X
W(l Z(ll)t/b+X Tril./s.s. dilep. Fully-had.
ATLAS Preliminary
= 13 TeV, 36.1 fb
-1s SU(2) (B,Y) doublet
[GeV]
mB
700 800 900 1000 1100 1200 1300 1400
) [pb]B B→(pp σ
−3
10
−2
10
−1
10 1
10 Theory (NNLO prediction ±1σ) 95% CL combined observed 95% CL combined expected
ν)t+X
W(l Z(ll)t/b+X Tril./s.s. dilep. Fully-had.
ATLAS Preliminary
= 13 TeV, 36.1 fb
-1s SU(2) (B,Y) doublet
Figure 7: Observed (solid line) and expected (dashed line) 95% CL upper limits on the B B ¯ cross-section versus mass
for the combination and the standalone analyses for the (B, Y ) doublet scenario [8]. The shaded bands correspond
to ± 1 and ± 2 standard deviations around the combined expected limit. The thin red line and band show the theory
prediction and corresponding uncertainty [13].
0 0.1 0.2 0.3 0.4 0.5 0.6 0.7 0.8 0.9 1
→ Wb) BR(T 0.1
0.2 0.3 0.4 0.5 0.6 0.7 0.8 0.9 1
Ht)→BR(T
1200 1220 1240 1260 1280 1300 1320 1340 1360 1380 1400
95% CL mass limit [GeV]
ATLAS Preliminary = 13 TeV, 36.1 fb-1
s
VLQ combination Expected limit
1250 1300
1350
SU(2) doublet SU(2) singlet
0 0.1 0.2 0.3 0.4 0.5 0.6 0.7 0.8 0.9 1
→ Wt) BR(B 0.1
0.2 0.3 0.4 0.5 0.6 0.7 0.8 0.9 1
Hb)→BR(B
900 950 1000 1050 1100 1150 1200 1250 1300 1350 1400
95% CL mass limit [GeV]
ATLAS Preliminary = 13 TeV, 36.1 fb-1
s
VLQ combination Expected limit 1000
1100
1200
1300 SU(2) (T,B) doublet SU(2) (B,Y) doublet SU(2) singlet
Figure 8: Expected lower limits at 95% CL on the mass of the (left) T and (right) B as a function of branching ratio
assuming B(T → Ht) + B(T → Zt) + B(T → W b) = 1 and B(B → Hb) + B( B → Z b) + B(B → Wt) = 1. The
yellow markers indicate the branching ratios for the SU(2) singlet and doublet scenarios with masses above 800 GeV
for which they are approximately independent of the VLQ mass [8].
0 0.2 0.4 0.6 0.8 0
0.2 0.4 0.6 0.8
Unphysical
= 1200 GeV m
T0 0.2 0.4 0.6 0.8
Unphysical
= 1300 GeV m
T0 0.2 0.4 0.6 0.8 1
Unphysical
= 1400 GeV m
T0.2 0.4 0.6 0.8
Unphysical
= 1050 GeV m
TUnphysical
= 1100 GeV m
TUnphysical
= 1150 GeV m
T0.2 0.4 0.6 0.8
Unphysical
= 950 GeV m
TUnphysical
= 1000 GeV m
T0.2 0.4 0.6 0.8
Unphysical
= 800 GeV m
TUnphysical
= 900 GeV m
T1
→ Wb) BR(T
Ht) → BR(T
ATLAS Preliminary
= 13 TeV, 36.1 fb
-1s
VLQ Combination
SU(2) doublet SU(2) singlet
95% CL expected exclusion
95% CL observed exclusion
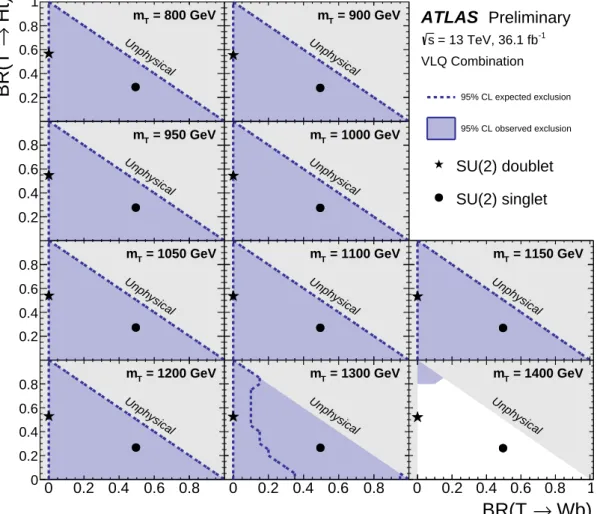
Figure 9: Observed (blue filled area) and expected (blue dashed line) 95% CL exclusion in the plane of B(T → Ht) versus B(T → W b) , for different values of the vector-like T quark mass for the T T ¯ combination, assuming that the visible branching ratios sum to unity. In the figure, the branching ratio is denoted “BR”. The grey (light shaded) area corresponds to the unphysical region where the sum of branching ratios exceeds unity, or is smaller than zero.
The default branching ratio values from the Protos event generator [35] for the weak-isospin singlet and doublet
cases are shown as plain circle and star symbols, respectively.
0 0.2 0.4 0.6 0.8 0
0.2 0.4 0.6 0.8
Unphysical
= 1200 GeV m
T0 0.2 0.4 0.6 0.8
Unphysical
= 1300 GeV m
T0 0.2 0.4 0.6 0.8 1
Unphysical
= 1400 GeV m
T0.2 0.4 0.6 0.8
Unphysical
= 1050 GeV m
TUnphysical
= 1100 GeV m
TUnphysical
= 1150 GeV m
T0.2 0.4 0.6 0.8
Unphysical
= 950 GeV m
TUnphysical
= 1000 GeV m
T0.2 0.4 0.6 0.8
Unphysical
= 800 GeV m
TUnphysical
= 900 GeV m
T1
→ Wb) BR(T
Ht) → BR(T
ATLAS Preliminary
= 13 TeV, 36.1 fb
-1s
SU(2) doublet SU(2) singlet Exp. exclusion Obs. exclusion
[arXiv:1707.03347]
)b+X ν W(l
[arXiv:1803.09678]
H(bb)t+X
[arxiv:1705.10751]
)t+X ν ν Z(
[CERN-EP-2018-171]
Trilep./same-sign
[arXiv:1806.10555]
Z(ll)t/b+X
[CERN-EP-2018-176]
All-had
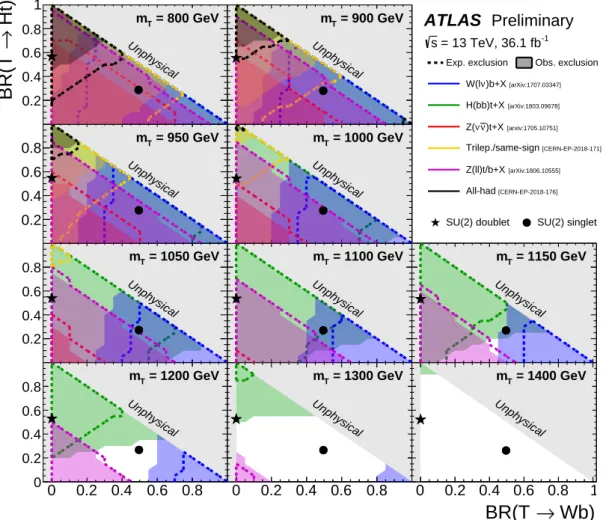
Figure 10: Observed (filled area) and expected (dashed line) 95% CL exclusion in the plane of B(T → Ht) versus B(T → W b) , for different values of the vector-like T quark mass for the various analyses contributing to the T T ¯ combination, assuming that the SM branching ratios sum to unity. In the figure, the branching ratio is denoted “BR”.
The grey (light shaded) area corresponds to the unphysical region where the sum of branching ratios exceeds unity,
or is smaller than zero. The default branching ratio values from the Protos event generator [35] for the weak-isospin
singlet and doublet cases are shown as plain circle and star symbols, respectively.
0 0.2 0.4 0.6 0.8 0
0.2 0.4 0.6 0.8
Unphysical
= 1200 GeV m
B0 0.2 0.4 0.6 0.8
Unphysical
= 1300 GeV m
B0 0.2 0.4 0.6 0.8 1
Unphysical
= 1400 GeV m
B0.2 0.4 0.6 0.8
Unphysical
= 1050 GeV m
BUnphysical
= 1100 GeV m
BUnphysical
= 1150 GeV m
B0.2 0.4 0.6 0.8
Unphysical
= 950 GeV m
BUnphysical
= 1000 GeV m
B0.2 0.4 0.6 0.8
Unphysical
= 800 GeV m
BUnphysical
= 900 GeV m
B1
→ Wt) BR(B
Hb) → BR(B
ATLAS Preliminary
= 13 TeV, 36.1 fb
-1s
VLQ Combination
SU(2) (T,B) doublet SU(2) (B,Y) doublet SU(2) singlet
95% CL expected exclusion
95% CL observed exclusion
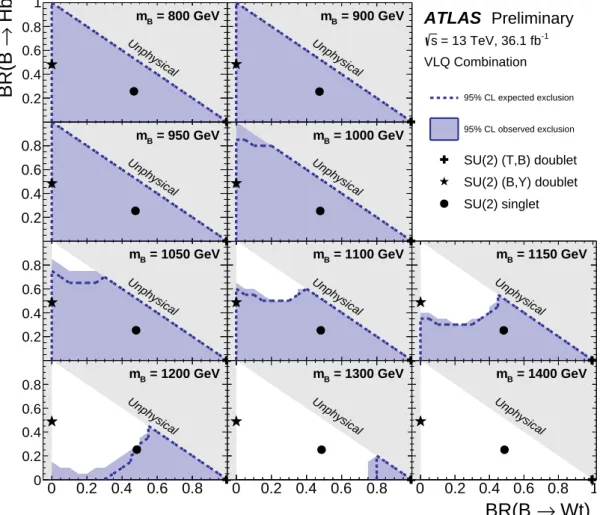
Figure 11: Observed (blue filled area) and expected (blue dashed line) 95% CL exclusion in the plane of B(B → Hb) versus BR (B → Wt) , for different values of the vector-like B quark mass for the B B ¯ combination, assuming that the visible branching ratios sum to unity. In the figure, the branching ratio is denoted “BR”. The grey (light shaded) area corresponds to the unphysical region where the sum of branching ratios exceeds unity, or is smaller than zero.
The default branching ratio values from the Protos event generator [35] for the weak-isospin singlet, (T , B) and
B,Y doublet cases are shown as plain circle, cross and star symbols, respectively.
0 0.2 0.4 0.6 0.8 0
0.2 0.4 0.6 0.8
Unphysical
= 1200 GeV m
B0 0.2 0.4 0.6 0.8
Unphysical
= 1300 GeV m
B0 0.2 0.4 0.6 0.8 1
Unphysical
= 1400 GeV m
B0.2 0.4 0.6 0.8
Unphysical
= 1050 GeV m
BUnphysical
= 1100 GeV m
BUnphysical
= 1150 GeV m
B0.2 0.4 0.6 0.8
Unphysical
= 950 GeV m
BUnphysical
= 1000 GeV m
B0.2 0.4 0.6 0.8
Unphysical
= 800 GeV m
BUnphysical
= 900 GeV m
B1
→ Wt) BR(B
Hb) → BR(B
ATLAS Preliminary
= 13 TeV, 36.1 fb
-1s
SU(2) (T,B) doublet SU(2) (B,Y) doublet SU(2) singlet
Exp. exclusion Obs. exclusion
[arXiv:1806.01762]
)t+X ν W(l
[CERN-EP-2018-171]
Trilep./same-sign
[arXiv:1806.10555]
Z(ll)t/b+X
[CERN-EP-2018-176]
All-had
![Figure 2: Observed (solid line) and expected (dashed line) 95% CL upper limits on the T T ¯ cross-section versus mass for the combination and the standalone analyses for the (left) singlet and (right) doublet scenarios [8]](https://thumb-eu.123doks.com/thumbv2/1library_info/4002307.1540583/6.892.165.760.153.441/figure-observed-expected-section-combination-standalone-analyses-scenarios.webp)
![Figure 5: Observed (solid line) and expected (dashed line) 95% CL upper limits on the T T ¯ cross-section as a function of the T quark mass for the combination and the standalone analyses for the (left) singlet and (right) doublet scenarios [8]](https://thumb-eu.123doks.com/thumbv2/1library_info/4002307.1540583/11.892.136.789.230.543/figure-observed-expected-function-combination-standalone-analyses-scenarios.webp)
![Figure 6: Observed (solid line) and expected (dashed line) 95% CL upper limits on the B B ¯ cross-section as a function of the B quark mass for the combination and the standalone analyses for the (left) singlet and (right) (T , B) doublet scenarios [8]](https://thumb-eu.123doks.com/thumbv2/1library_info/4002307.1540583/12.892.138.786.189.503/figure-observed-expected-function-combination-standalone-analyses-scenarios.webp)