ATLAS-CONF-2012-107 13August2012
ATLAS NOTE
ATLAS-CONF-2012-107
August 11, 2012
A general search for new phenomena with the ATLAS detector in pp collisions at √
s = 7 TeV
The ATLAS Collaboration
Abstract
This note presents a model-independent general search for new physics in proton proton collisions at a centre-of-mass energy of 7 TeV with the ATLAS detector at the LHC. The data set, recorded by the ATLAS experiment during 2011, corresponds to a total integrated luminosity of 4.7 fb
−1. Event topologies involving isolated electrons, photons, muons, jets, b-jets and missing transverse momentum are investigated. The events are subdivided ac- cording to their final states into 655 exclusive analysis channels. For each channel, a search algorithm tests the compatibility of the e
ffective mass distribution in data against the dis- tribution in the Monte Carlo simulated background. Although this search approach is less sensitive than optimized searches for specific models it provides a more comprehensive in- vestigation for new physics signals. No significant deviations between data and the Standard Model expectations have been observed.
c
Copyright 2012 CERN for the benefit of the ATLAS Collaboration.
Reproduction of this article or parts of it is allowed as specified in the CC-BY-3.0 license.
1 Introduction
It is well known that the Standard Model (SM) of particle physics cannot be a complete theory of fun- damental interactions. It is instead likely to be a low energy manifestation (or an effective theory) of an underlying theory which would manifest itself at higher energies. There are many compelling rea- sons to believe that first signs of new physics may appear at LHC energies. In particular, new particles could be found, which might provide a solution for the cancelation of quadratic mass divergences that would accompany a SM Higgs boson or might point to the possibility that Dark Matter is made of new fundamental particles with a mass below the TeV scale. The LHC data have been used to search for various signals of new physics and stringent limits have been set on several models of Supersymme- try and other new phenomena. Although these searches cover already a wide variety of possible event topologies, they do not explore them all. Events caused by new interactions or new particles might still be hidden in the LHC data. The approach described in this note adresses this important issue with a model-independent search strategy. The search is designed to be comprehensive for new physics signals appearing at high transverse momenta rather than being optimized for specific channels or signals. The approach is not sensitive to final states with low transverse momentum or small signals in channels with large backgrounds.
Model-independent searches have been performed already at the D0 [1], H1 [2], CDF [3] and CMS [4] experiments. The strategy presented here is based on the approach taken by the H1 experiment. All event topologies involving electrons, photons, muons, jets, b-tagged jets and missing transverse momen- tum are investigated in a single analysis. The e
ffective mass distribution of each final state is scanned for deviations from the Standard Model prediction. A statistical search algorithm looks for the region of largest deviation between data and the Standard Model prediction. The Standard Model prediction is constructed purely from Monte Carlo simulations. The approach identifies the largest deviations from the Monte Carlo implementation of the Standard Model prediction at ATLAS. If a significant deviation is found, a dedicated analysis will be required to determine if the deviation is caused by a mismodelling of the Standard Model prediction, a signal of new physics or other effects.
The note is organized as follows. Section 2 includes a description of the ATLAS detector. Sec- tion 3 describes the Monte Carlo prediction, section 4 the event selection and section 5 the systematic uncertainties. The statistical scanning algorithm and the results are presented in section 6.
2 The ATLAS experiment
ATLAS [5] is a multipurpose particle physics apparatus with a forward-backward symmetric cylindri- cal geometry and nearly 4π coverage in solid angle.
1The layout of the detector is dominated by four superconducting magnet systems, which comprise a thin solenoid surrounding inner tracking detectors (ID) and three large toroids supporting a large muon tracker (MS). In the pseudorapidity region
|η|<3.2, high-granularity liquid-argon (LAr) electromagnetic (EM) sampling calorimeters surround the solenoid magnet. An iron-scintillator tile calorimeter provides hadronic coverage over
|η| <1.7. The end-cap and forward regions, spanning 1.5
<|η|<4.9, are instrumented with LAr calorimetry for both EM and hadronic measurements.
The data sample used in this analysis was recorded in 2011 at a centre-of-mass energy of 7 TeV with single muon, electron, jet, or combined jet and missing transverse momentum triggers. Application of beam, detector and data-quality requirements results in a data set with a total integrated luminosity of 4.7
±0.2 fb
−1[6].
1ATLAS uses a right-handed coordinate system with its origin at the nominal interaction point in the centre of the detector and thez-axis along the beam pipe. Cylindrical coordinates (r, φ) are used in the transverse plane,φbeing the azimuthal angle around the beam pipe. The pseudorapidityηis defined in terms of the polar angleθbyη=−ln tan(θ/2).
3 Monte Carlo samples
In this search the Standard Model prediction is modelled by Monte Carlo (MC). In general good agree- ment is found between ATLAS data and Monte Carlo simulations. All dominant processes are considered for the Standard Model estimate: W
+jets,Z
+jets, top quark pair, multijet, prompt photon, diboson andsingle top production. Non-collision backgrounds were studied in several ATLAS analyses with identical object selection criteria and these backgrounds were found to give a negligible contribution [7].
Multijet production
Simulated multi-jet events are generated with
PYTHIA[8] v6.4.21, which uses 2
→2 leading order (LO) matrix elements (ME) with the
MRSTMCalPDF set [9]. The large uncertainty in the cross section of multi-jet processes is discussed in section
5.2.W+jet and Z+jet production
Electroweak gauge boson production in association with jets is generated using
ALPGEN[10], which includes LO electroweak and QCD contributions for multipartons hard processes. Jet production is generated with up to six parton matrix elements and the samples are generated with the MLM matching scheme. The generator is interfaced to
HERWIG[11] for showering and fragmentation and
JIMMY[12]
for the underlying event. All samples use the
CTEQ6L1[13] parton density. The obtained cross-sections are scaled to the next-to-next-to-leading order (NNLO) FEWZ [14] prediction. Contributions from Wbb, Wcc, Wc, and Zbb are included with separate
ALPGENsamples. As
ALPGENdoes not match heavy flavour quark jets explicitly, the same final state is included in multiple samples. An overlap removal scheme is applied to avoid double counting of events. This is accomplished by a simple
∆R matching scheme.
Additional scaling factors of 1.63
±0.76 and 1.11
±0.35 are applied to the Wbb/Wcc and the Wc samples respectively to account for the measured cross-section of W in association with b jets [15,
16].γ+jets andγpairs
Photon plus jets samples are generated with
PYTHIAin a similar way to the multi-jet samples. Prompt diphoton samples are generated with
PYTHIAin bins of m
γγ. These samples include the hard matrix elements
gg → γγand q q ¯
→ γγ. A filter is applied to select only events were the two photons havep
T>15 GeV.
W/Z+γ
The Wγ samples are generated using
ALPGENin a similar way to the W
+jets samples. A generator level filter requiring at least one photon with p
T >10 GeV is applied. The Zγ process is generated with
MadGraph[17] with parton showering and fragmentation simulated by
PYTHIA. A generator level filterrequiring at least one lepton with p
T >10 GeV and
|η| <2.5 and one photon with p
T >7 GeV and
|η| <
2.5 is applied. The PDF set
CTEQ6L1is used for these samples. No scaling of the cross sections is applied.
Madgraphis also used to generate V
+γγsamples, with a leading-order matrix element. A K-factor of 2.0
±0.3 is chosen for Z
+γγ, based on Ref.[18]; and a K-factor of 3±3 for Wγγ based on the observed differences between the LO and next-to-leading order (NLO) calculations, as discussed in [19].
Top quark pair and single top production
The primary t¯ t samples, with fully leptonic or semileptonic decays, are produced with
ALPGEN, includingup to 5 partons in the matrix element. Separate samples for t¯ tb b ¯ and t¯ tc¯ c are used, after removing their overlap with the light flavour samples. Fully hadronic t¯ t decays are simulated using MC@NLO [20,
21].All samples are normalized to the NLO plus next-to-leading log (NLL) calculation [22]. Single top
events are generated using the MC@NLO program which includes full NLO corrections to the matrix element for the hard process. Final state parton showering and underlying event simulation is performed through interfaces to
HERWIGand
JIMMYrespectively. A top quark mass of 172.5 GeV is assumed. The
CT10PDF set [23] is used in both the single top and top quark pair samples for the matrix element, the parton shower, and the underlying event.
Top and vector boson production
Top quark pair production may also occur with an additional boson (t¯ t
+V). These samples are generated using the
MadGraph[17] LO generator withPYTHIAfor showering. Cross sections are normalized to NLO [24,
25]. An additional sample, generated withWHIZARD[26] is used for t¯ t
+γproduction. Both samples use the
CTEQ6L1parton density functions.
Diboson production
WW , WZ and ZZ events are simulated using
HERWIG, including off-shell boson contributions. A filter is applied to select events with at least one lepton with p
T >10 GeV and
|η| <2.8 and the mass of the o
ff-shell W or Z boson greater than 20 GeV. The
HERWIGWW sample only describes opposite sign WW production. An additional sample, generated at tree-level with
MadGraphis used for same sign production, and is not filtered at generator level. The
HERWIGsamples do not include in their computation diagrams with internal conversions and their interference.
Supersymmetric signal events
Benchmark signals were generated with
HERWIG++[27] v2.4.2 in the CMSSM/MSUGRA model. These samples are normalised using NLO cross sections determined by
PROSPINO[28] v2.1. For all non-
PYTHIAsamples
HERWIG++or
HERWIG-6.510[11] is used to simulate parton showering and fragmen- tation, while
JIMMY[12] v4.31 is used to generate the underlying event. All samples are produced using an ATLAS ‘tune’ [29] and a full detector simulation [30].
4 Event Selection and classification
4.1 Object definition
Jet candidates are reconstructed using the anti-k
tjet clustering algorithm [31,
32] with a distance param-eter of 0.4. The jet algorithm uses clusters of calorimeter cells seeded by those with energy significantly above the measured noise. Jet momenta are constructed by performing a four-vector sum over these cell clusters, treating each as an (E, ~ p) four-vector with zero mass. These jets are corrected for the effects of calorimeter non-compensation and inhomogeneities by using p
T- and
η-dependent calibration factorsbased on MC corrections validated with extensive test-beam and collision-data studies [33]. Only jet candidates with p
T >20 GeV and
|η|<4.9 are subsequently retained.
Jets arising from b-quarks are identified using information about track impact parameters and recon- structed secondary vertices [34]; the b-tagging algorithm is based on a neural network using the output weights of various b-tagging algorithms as input. A tight operating point at a b-tagging efficiency of 60%
is used for which the algorithm provides a rejection factor of approximately 200-400 for light-quark and gluon jets and a rejection of approximately 7-10 for charm jets.
Electron candidates are required to have p
T >10 GeV, to have
|η| <2.47, to pass the ‘medium’
electron shower shape and track selection criteria of Ref. [35], and to be outside problematic regions of
the calorimeter. Muon candidates are reconstructed by combining tracks in the ID and MS. Muons are
required to have p
T >10 GeV and
|η|<2.4. Photon candidates are required to pass the tight identification
criteria [36]. Photons are required to lie in the fiducial region
|η|<1.37 or 1.52
<|η|<2.37 and to have a p
T >20 GeV.
Following the steps above, overlaps between candidate jets with
|η| <2.5, leptons and photons are resolved using the method of Ref. [37] as follows. First, any such jet candidate lying within a distance
∆
R
= p(
∆η)2+(
∆φ)2 <0.2 of an electron or photon is discarded. Then the whole event is rejected if any electron candidate remains in the calorimeter transition region 1.37
< |η| <1.52 between barrel and end-cap. Finally, any lepton or photon candidate remaining within a distance
∆R
=0.4 of such a jet candidate is discarded.
The measurement of the missing transverse momentum two-vector P
~Tmiss(and its magnitude E
missT) is then based on the transverse momenta of all remaining jet and lepton candidates and all calorimeter clusters not associated to such objects. Thereafter, the remaining lepton and jet candidates are consid- ered “reconstructed”, and the term “candidate” is dropped. The same object identification and selection criteria are applied to data and Monte Carlo events.
4.2 Event selection
The ATLAS experiment records events in di
fferent physics streams depending on the sets of trigger criteria used. All events in the jet and missing transverse momentum (JetTauEtmiss) stream, the electron and photon (EGamma) stream and the Muon stream are considered for this analysis. The same event can be contained in more than one stream.
The detailed trigger specification varies throughout the stream and data-taking period. To remain at a high trigger efficiency events are only selected if they fulfill one of the cuts listed in Table
1. Thetrigger efficiency for events in the jet stream is above 98% for E
missT >160 GeV and a reconstructed jet with p
T >130 GeV [7]. In the electron stream, the electron trigger selects events containing one or more electron candidates, based on the presence of a cluster in the electromagnetic calorimeter, with a shower shape consistent with that of an electron. The transverse energy threshold at the trigger level ranges between 20-22 GeV, depending on the luminosity. The trigger e
fficiency is above 95% [38]. In the muon stream, the muon trigger selects events containing one or more muon candidates based on tracks identified in the MS and ID. The muon trigger p
Tthreshold is 18 GeV. The plateau efficiency ranges from about 70% in the barrel region to 88% in the endcaps.
Following the object reconstruction described above, events are discarded if they have any jets failing quality selection criteria designed to suppress detector noise and non-collision backgrounds [7], or if they lack a reconstructed primary vertex associated with five or more tracks.
4.3 Event classification
The events are subdivided, depending on the number and types of objects reconstructed in the event, into exclusive classes. Events with an isolated calorimetric object in the considered phase space which is not identified as a photon, electron or jet are discarded from the analysis in order to minimise wrong classifications. The subdivision can be regarded as a classification according to the most important features of the data. The lower p
Tcuts and labels used for each object are summarized in Table
2. A lowercut on the p
Tof the leading jet of 500 GeV is applied for the JetTauEtmiss stream if E
missT <130 GeV, to reduce the analysis sensitivity to the limited number of multi-jet Monte Carlo events generated at low
p
T.
5 Systematic uncertainties
The following sources of systematic uncertainties are taken into account.
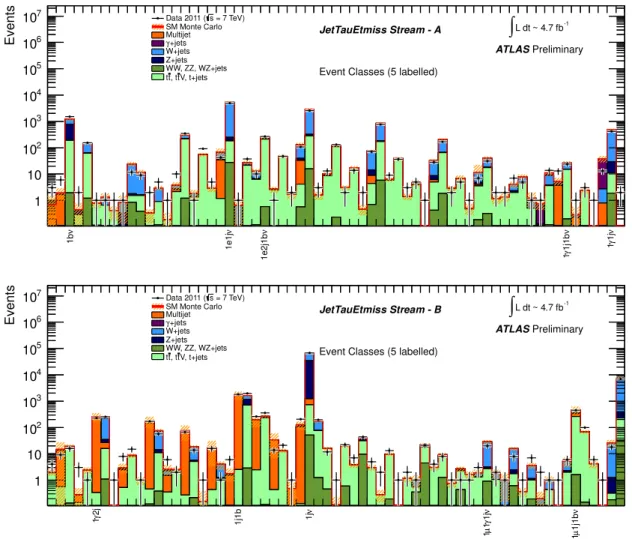
Stream trigger requirement
Muon muon p
T >20 GeV
EGamma electron p
T>25 GeV
JetTauEtmiss jet p
T>130 GeV & E
missT >160 GeV or jet p
T>350 GeV
Table 1: List of the p
Tcuts used for each object in order to have a fully efficient trigger.
object jet b-jet electron muon photon E
missTlabel j b e
µ γ νlower p
Tcut 50 GeV 50 GeV 25 GeV 20 GeV 40 GeV 130 GeV
Table 2: List of objects used for the event classification with their labels and lower p
Tcuts. A lower cut on the leading jet of 500 GeV is applied for the JetTauEtmiss stream if E
Tmiss<130 GeV.
5.1 Experimental uncertainties
The uncertainty on the luminosity is 3.9% [6]. The jet energy scale uncertainty estimate is based on Monte Carlo studies and in-situ measurements and is provided in bins of
|η|and p
T. The scale is varied up and down within its uncertainty. The jet energy resolution uncertainty is also considered. It can impact the background predictions, mainly by changing the number of reconstructed jets in each event class.
The b-tagging systematics considers the uncertainty on the b-tagging e
fficiency for b, c and light jets.
MC events have been re-weighted to match the expected number of interactions per bunch crossing in data. A systematic uncertainty related to the pileup uncertainty is determined by comparing the nominal reweighting with a shift in the weight scale of 10%.
The experimental uncertainties and the uncertainty due to the limited number of MC events are in almost all channels the dominating uncertainties.
5.2 Theoretical uncertainties
All MC samples are normalized to their most accurate inclusive cross sections. Not using any data- driven technique to estimate the backgrounds, we rely purely on MC predictions. For the purpose of this general search, values have been chosen, which represent typical theoretical uncertainties of the models and generators used in the analysis. Those values are motivated by studies and results of dedicated searches and measurements by the ATLAS collaboration at high transverse momenta. As outlined in the introduction of this paper, any significant difference between data and SM Monte Carlo expectation will require a dedicated study of the backgrounds with control regions and data driven techniques. Such studies would be done a posteriori.
The following theoretical uncertainties are assigned per subprocess. Due to the tight requirements in the object selections, they are however of little importance for most of the event classes considered.
The multi-jet production process is available only at leading-order, but higher jet multiplicities are quite well modelled with the parton shower approach. We assigned a systematic uncertainty of 30% in agree- ment with Ref. [39]. These uncertainties do not include fake lepton production which might play a role for some lepton channels. We assigned therefore an uncertainty of 100% for the multi-jet production contribution in channels with leptons.
The same applies to the uncertainty of the gamma
+jets process. We assign a systematic uncertainty
of 30% inspired by Ref. [36]. The inclusive W/Z cross section is known at NNLO, with an uncertainty of
≈5%; we assign conservatively an uncertainty of 20% to the W
+jets and Z
+jets samples. Similar numbers are found in Ref. [40]. We assign for the W/Z
+gamma process a systematic uncertainty of 20%. This is a bit more conservative than the numbers quoted in Ref. [41]. For t¯ t and single top, known to NNLO and NLO respectively, an uncertainty of 20% is used [42,
43]. Diboson processes are known toNLO. An uncertainty of 20% is assigned for these processes. Due to the effect of possible jet production we quote a more conservative uncertainty than e.g. Ref. [44]. Finally the large K-factor uncertainty for Wγγ results in an uncertainty of 100% for this process.
All systematic uncertainties are added in quadrature.
6 Results
6.1 Event yields
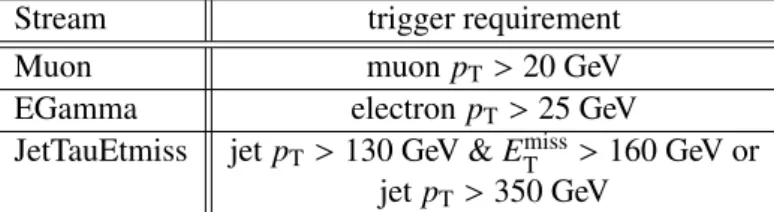
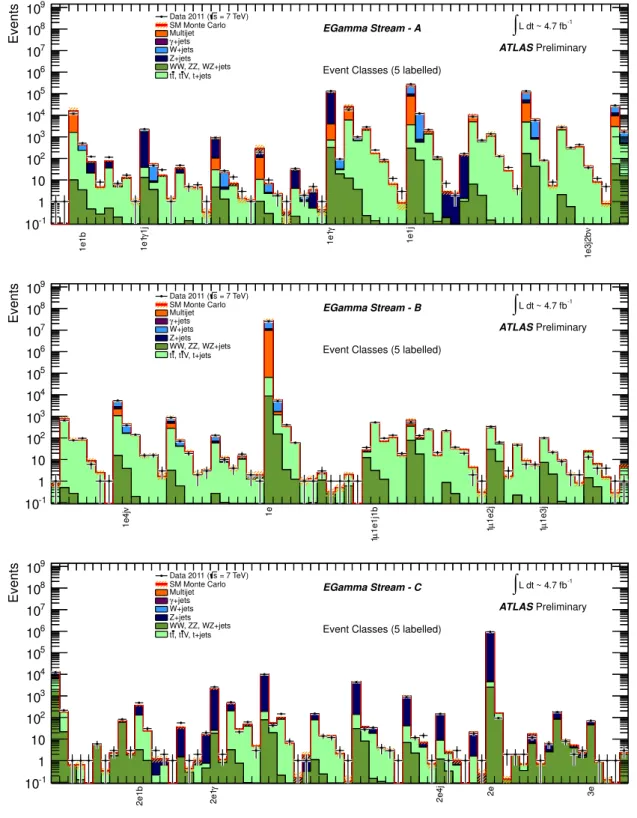
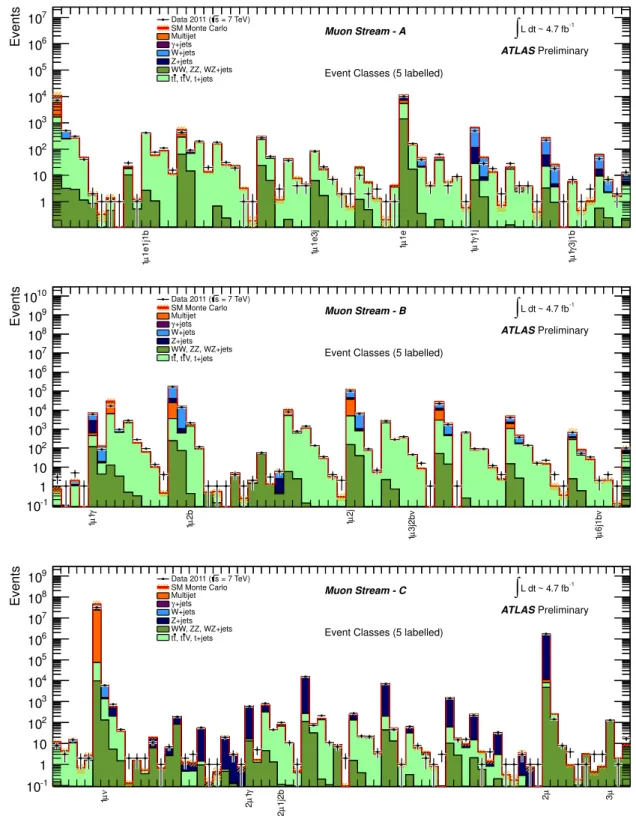
The event yields subdivided in channels are presented for the data and Monte Carlo expectations for all channels with at least one data event. Data events are found in 655 analysis channels. Each channel is exclusive, i.e. the list of studied channels includes all combinations with repetition which can be formed out of the electron, muon, photon, b-jet and jets object types. The list also includes classes with a missing transverse momentum object. The data and MC prediction are shown in Figure
1for the EGamma, in Figure
2for the Muon and in Figure
3and
4for the JetTauEtmiss streams. Only event classes are considered where, within the statistics of the SM Monte Carlo, at least 1 background event is generated.
For all channels good agreement between data and SM prediction is observed.
6.2 Search algorithm
In order to quantitatively determine the level of agreement between the data and the SM expectation and to identify regions of possible deviations we use a search algorithm, first developed for the H1 generic search [2]. As a compromise between maximizing the sensitivity and keeping the “look elsewhere”
e
ffect [45] at a manageable level, the algorithm is only applied to the e
ffective mass distributions of the events in the 655 channels. The effective mass, m
eff, is defined for each event class as the scalar sum of the transverse momenta of the objects defining the channel. This quantity has been widely used in the context of searches for new physics, as it is sensitive to a large class of new physics signals.
The search algorithm locates the region of largest deviation in a distribution of any shape. The bin size of the scanned distributions is chosen to reflect the expected resolution from the objects selected in the given channel. In every histogram the number of data events N
obsand the expectation N
S Mwith its total systematic uncertainty
δNS Mare determined for each possible connected bin region with at least two bins. A statistical estimator p is used to judge which region is of most interest. It is derived from the convolution of a Poisson probability density function (pdf) to account for statistical uncertainties with a Gaussian pdf, G(b; N
S M, δNS M), with mean N
S Mand width
δNS M, to include effects of non negligible systematic uncertainties. It is defined as
p
=A
Z ∞0
db G(b; N
S M, δNS M)
∞
X
i=Nobs
e
−bb
ii! (1)
The factor A
=1/
∞
R
0
db G(b; N
S M, δNS M)
∞
P
i=0 e−bbi
i!
ensures that the pdf is normalized to unity. If the Gaus-
sian pdf G is replaced by a Dirac delta function
δ(b−N
S M) the estimator p results in a usual Poisson
probability. The value of p gives an estimate of the probability that the SM expectation fluctuates up-
wards to the data in a given region. Here p is interpreted as the local p-value of this deviation. The region
1e1b 1jγ1e1 γ1e1 1e1j ν1e3j2b
Events
10-1
1 10 102
103
104
105
106
107
108
109 Data 2011 (s = 7 TeV)
SM Monte Carlo Multijet
+jets γ W+jets Z+jets WW, ZZ, WZ+jets
V, t+jets t , t t t
ATLAS Preliminary EGamma Stream - A
Event Classes (5 labelled)
L dt ~ 4.7 fb-1
∫
ν1e4j 1e 1e1j1bµ1 1e2jµ1 1e3jµ1
Events
10-1
1 10 102
103
104
105
106
107
108
109 Data 2011 (s = 7 TeV)
SM Monte Carlo Multijet
+jets γ W+jets Z+jets WW, ZZ, WZ+jets
V, t+jets t , t t t
ATLAS Preliminary EGamma Stream - B
Event Classes (5 labelled)
L dt ~ 4.7 fb-1
∫
2e1b γ2e1 2e4j 2e 3e
Events
10-1
1 10 102
103
104
105
106
107
108
109 Data 2011 (s = 7 TeV)
SM Monte Carlo Multijet
+jets γ W+jets Z+jets WW, ZZ, WZ+jets
V, t+jets t , t t t
ATLAS Preliminary EGamma Stream - C
Event Classes (5 labelled)
L dt ~ 4.7 fb-1
∫
Figure 1: Number of events for event classes in the EGamma stream (parts A, B, C). As an example, 5 classes in each part are labelled according to the frequency and the label type (e,
µ,γ, jetj, b-jet b, E
missT ν) of the reconstructed objects for this event class. The data are compared to several SM backgroundsources as described in the text.
.
1e1j1bµ1 1e3jµ1 1eµ1 1jγ1µ1 3j1bγ1µ1
Events
1 10 102
103
104
105
106
107 Data 2011 (s = 7 TeV)
SM Monte Carlo Multijet
+jets γ W+jets Z+jets WW, ZZ, WZ+jets
V, t+jets t , t t t
ATLAS Preliminary Muon Stream - A
Event Classes (5 labelled)
L dt ~ 4.7 fb-1
∫
γ1µ1 2bµ1 2jµ1 ν3j2bµ1 ν6j1bµ1
Events
10-1
1 10 102
103
104
105
106
107
108
109
1010 Data 2011 (s = 7 TeV)
SM Monte Carlo Multijet
+jets γ W+jets Z+jets WW, ZZ, WZ+jets
V, t+jets t , t t t
ATLAS Preliminary Muon Stream - B
Event Classes (5 labelled)
L dt ~ 4.7 fb-1
∫
νµ1 γ1µ2 1j2bµ2 µ2 µ3
Events
10-1
1 10 102
103
104
105
106
107
108
109 Data 2011 (s = 7 TeV)
SM Monte Carlo Multijet
+jets γ W+jets Z+jets WW, ZZ, WZ+jets
V, t+jets t , t t t
ATLAS Preliminary Muon Stream - C
Event Classes (5 labelled)
L dt ~ 4.7 fb-1
∫
Figure 2: Number of events for event classes in the Muon Stream (parts A, B, C). As an example, 5 classes in each part are labelled according to the frequency and the label type (e,
µ,γ, jetj, b-jet b, E
missT ν) of the reconstructed objects for this event class. The data are compared to several SM backgroundsources as described in the text.
.
ν1b ν1e1j ν1e2j1b ν1j1bγ1 ν1jγ1
Events
1 10 102
103
104
105
106
107 Data 2011 (s = 7 TeV)
SM Monte Carlo Multijet
+jets γ W+jets Z+jets WW, ZZ, WZ+jets
V, t+jets t , t t t
ATLAS Preliminary JetTauEtmiss Stream - A
Event Classes (5 labelled)
L dt ~ 4.7 fb-1
∫
2jγ1 1j1b ν1j ν1jγ1µ1 ν1j1bµ1
Events
1 10 102
103
104
105
106
107 Data 2011 (s = 7 TeV)
SM Monte Carlo Multijet
+jets γ W+jets Z+jets WW, ZZ, WZ+jets
V, t+jets t , t t t
ATLAS Preliminary JetTauEtmiss Stream - B
Event Classes (5 labelled)
L dt ~ 4.7 fb-1
∫
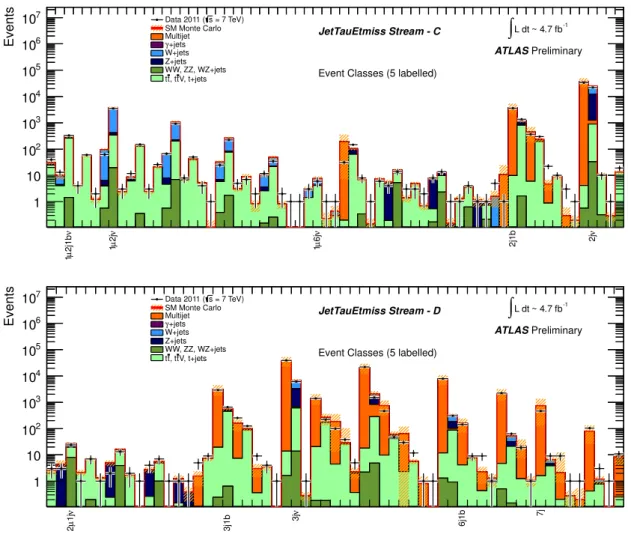
Figure 3: Number of events for event classes in the JetTauEtmiss stream (parts A, B). As an example,
5 classes in each part are labelled according to the frequency and the label type (e,
µ,γ, jetj, b-jet b,
E
missT ν) of the reconstructed objects for this event class. The data are compared to several SM backgroundsources as described in the text.
ν2j1bµ1 ν2jµ1 ν6jµ1 2j1b ν2j
Events
1 10 102
103
104
105
106
107 Data 2011 (s = 7 TeV)
SM Monte Carlo Multijet
+jets γ W+jets Z+jets WW, ZZ, WZ+jets
V, t+jets t , t t t
ATLAS Preliminary JetTauEtmiss Stream - C
Event Classes (5 labelled)
L dt ~ 4.7 fb-1
∫
ν1jµ2 3j1b ν3j 6j1b 7j
Events
1 10 102
103
104
105
106
107 Data 2011 (s = 7 TeV)
SM Monte Carlo Multijet
+jets γ W+jets Z+jets WW, ZZ, WZ+jets
V, t+jets t , t t t
ATLAS Preliminary JetTauEtmiss Stream - D
Event Classes (5 labelled)
L dt ~ 4.7 fb-1
∫
Figure 4: Number of events for event classes in the JetTauEtmiss stream (parts C, D). As an example,
5 classes in each part are labelled according to the frequency and the label type (e,
µ,γ, jetj, b-jet b,
E
missT ν) of the reconstructed objects for this event class. The data are compared to several SM backgroundsources as described in the text.
of greatest deviation found by the algorithm is the region with the smallest p-value. Such a method is able to find narrow resonances and single outstanding events as well as signals spread over large regions of phase space in distributions of any shape. To avoid being sensitive to the effect of poor Monte Carlo statistics, regions where the total background prediction has a relative uncertainty of 100% are discarded by the algorithm.
The probability that somewhere in the event class distribution a statistical fluctuation occurs is mod- elled by toy experiments. In this procedure, the data are replaced by pseudo data which are generated with the probability density of the Monte Carlo expectation.
6.3 Search Results
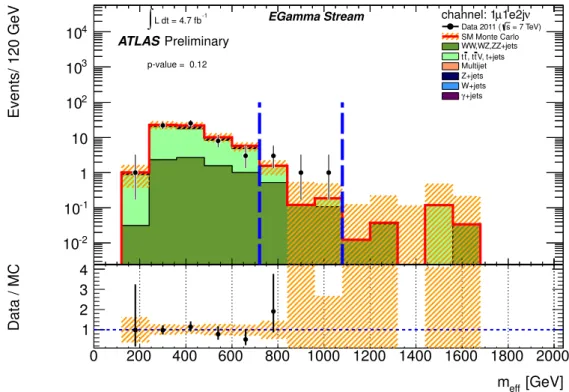
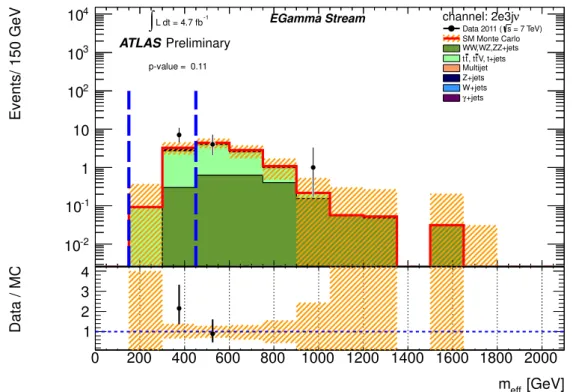
Effective mass distributionsTwo example distributions of the effective mass are presented for the EGamma stream. Figure
5shows the event class with one muon, one electron, two jets and E
Tmiss(1µ1e2 jν) and Figure
6the channel with with two electrons, 3 jets and E
Tmiss(2e3 jν). The region of greatest deviation as found by the search algorithm is indicated with vertical lines.
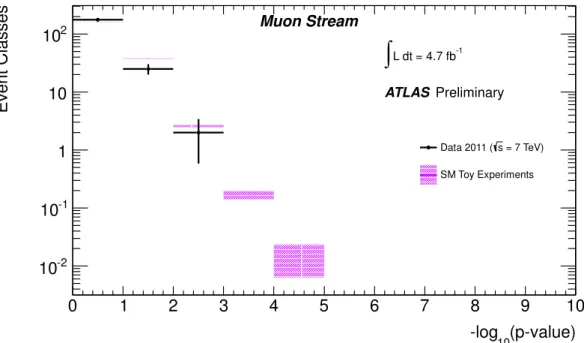
P-value distributions for data and for SM only (toys)
The distribution of the local p-value observed in data, compared to the expectation from the SM hypoth- esis as obtained from toys, is shown in Figures
7,8and
9for each stream separately. In these figures the statistical uncertainty of the SM toys is shown as a shaded band. No event class is found with a local p- value below 10
−3, corresponding roughly to a 3 sigma deviation. This is consistent with the expectation from toy experiments. At least one class with a local p-value below 10
−3is expected to be found in about 10
−20% of the toy experiments per analyzed stream. The analysis has therefore not observed a hint of a signal of new physics. In general, remarkably good agreement between data and Standard Model expectation is found.
It must be stressed that this analysis presents a tool to search for signals of new physics seen as deviations from a pure SM Monte Carlo prediction. If deviations were to be found, they would require more dedicated analyses pursuing a more detailed determination of the Standard Model backgrounds.
Also, due to the nature of the general search, this analysis might miss possible deviations from the SM if the MC prediction is too high in a phase space region or if new physics contributions are present on top of a large background.
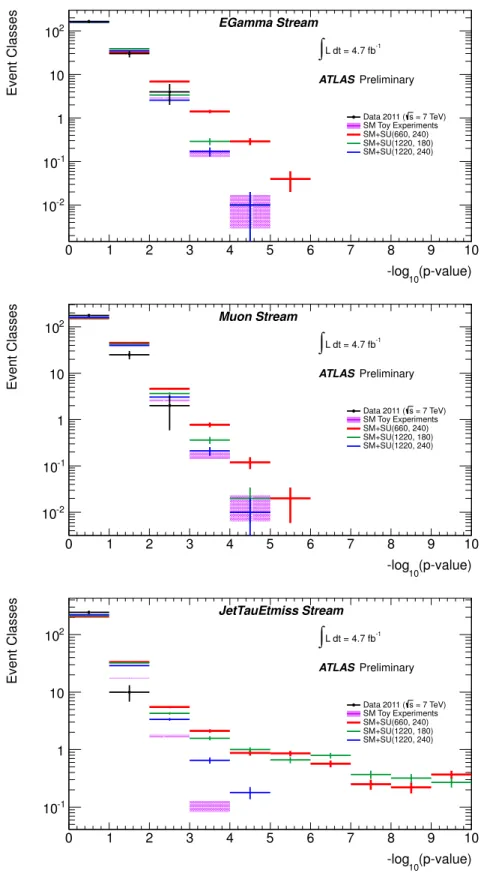
6.4 Sensitivity to new physics signals
A set of pseudo data samples is generated to test the sensitivity of the analysis procedure to some selected signals of new physics. The prediction of a specific new physics model is added on top of the SM prediction and the sum is used to generate pseudo data samples. A Monte Carlo technique is used to vary the distribution of signal events and to generate many pseudo experiments. The algorithm is run on those pseudo experiments and the distribution of local p-values is derived. A few model supersymmetric points with di
fferent sparticle masses on the CMSSM
/MSUGRA plane with tan
β =10, A
0 =0 and
µ >0 have been tested with different values for the common GUT scale boson and fermion masses (m
0, m
1/2). The model point (660, 240), with squark masses of 700 GeV and gluino masses of 600 GeV, has a cross section of about 0.8 pb. The point (1220, 180) with gluinos at 500 GeV and squarks at 1200 GeV, has a cross section of 1.12 pb, whereas (1220, 240) has gluinos at 600 GeV and squarks at 1200 GeV with a cross section of 0.2 pb. These supersymmetric models have been excluded already by a previous ATLAS analysis [7].
Figure
10shows the effect that the additional signal contribution would have on the p-value distribu-
tion. A supersymmetric signal would show up in a large number of classes, modifying the shape of the
0 200 400 600 800 1000 1200 1400 1600 1800 2000
Events/ 120 GeV
10-2
10-1
1 10 102
103
104 Data 2011 (s = 7 TeV)
SM Monte Carlo WW,WZ,ZZ+jets
V, t+jets t , t t t Multijet Z+jets W+jets
+jets γ
ν µ1e2j channel: 1
L dt = 4.7 fb-1
∫
ATLASPreliminary
EGamma Stream
p-value = 0.12
[GeV]
meff
0 200 400 600 800 1000 1200 1400 1600 1800 2000
Data / MC 1
2 3 4
Figure 5: m
effdistribution for the event class with one muon, one electron, two jets and E
Tmiss(1µ1e2 jν)
in the EGamma stream. The dashed vertical lines indicate the region of interest which has the smallest
p-value (0.12) for this event class.
0 200 400 600 800 1000 1200 1400 1600 1800 2000
Events/ 150 GeV
10-2
10-1
1 10 102
103
104
= 7 TeV) s Data 2011 ( SM Monte Carlo WW,WZ,ZZ+jets
V, t+jets t , t t t Multijet Z+jets W+jets
+jets γ
ν channel: 2e3j
L dt = 4.7 fb-1
∫
ATLASPreliminary
EGamma Stream
p-value = 0.11
[GeV]
meff
0 200 400 600 800 1000 1200 1400 1600 1800 2000
Data / MC 1
2 3 4
Figure 6: m
effdistribution for the event class with two electrons, 3 jets and E
missT(2e3 jν) in the EGamma stream. The dashed vertical lines indicate the region of interest which has the smallest p-value (0.11) for this event class.
(p-value) -log10
0 1 2 3 4 5 6 7 8 9 10
Event Classes
10-2
10-1
1 10 102
= 7 TeV) s Data 2011 ( SM Toy Experiments L dt = 4.7 fb-1
∫
ATLAS Preliminary EGamma Stream
Figure 7: The figure show the observed and expected number of classes in the EGamma stream having
a given range in
−log
10(p
−value). The band for the SM toy experiments represents the uncertainty, due
to the statistics of the toy experiments, on the mean expected number of classes.
(p-value) -log10
0 1 2 3 4 5 6 7 8 9 10
Event Classes
10-2
10-1
1 10 102
= 7 TeV) s Data 2011 ( SM Toy Experiments L dt = 4.7 fb-1
∫
ATLAS Preliminary Muon Stream
Figure 8: The figure show the observed and expected number of classes in the Muon stream having a given range in
−log
10(p
−value). The band for the SM toy experiments represents the uncertainty, due to the statistics of the toy experiments, on the mean expected number of classes.
(p-value) -log10
0 1 2 3 4 5 6 7 8 9 10
Event Classes
10-1
1 10 102
= 7 TeV) s Data 2011 ( SM Toy Experiments L dt = 4.7 fb-1
∫
ATLAS Preliminary JetTauEtmiss Stream
Figure 9: The figure show the observed and expected number of classes in the JetTauEtmiss stream hav-
ing a given range in
−log
10(p
−value). The band for the SM toy experiments represents the uncertainty,
due to the statistics of the toy experiments, on the mean expected number of classes.
p-value distribution towards higher deviations. The signal point (660, 240), as well as the point (1220, 180) would be clearly visible, mainly in the JetTauEtmiss stream. The signal due to the (1220, 240) model has a smaller impact in the lepton streams, but would still predict in the JetTauEtmiss stream, compared to the SM, a higher number of event classes with large deviations.
7 Conclusion
The data collected with the ATLAS experiment during the year 2011 in pp collisions at
√s
=7 TeV, corresponding to an integrated luminosity of 4.7 fb
−1, have been used to search for deviations from the SM prediction at high transverse momentum. Event topologies involving isolated electrons, muons, photons, jets, b-jets and missing transverse momentum have been classified systematically. All channels have been scanned for deviations from the SM Monte Carlo prediction in the e
ffective mass distributions.
No significant excess above the Monte Carlo prediction has been observed.
(p-value) -log10
0 1 2 3 4 5 6 7 8 9 10
Event Classes
10-2
10-1
1 10 102
= 7 TeV) s Data 2011 ( SM Toy Experiments SM+SU(660, 240) SM+SU(1220, 180) SM+SU(1220, 240) L dt = 4.7 fb-1
∫
ATLASPreliminary EGamma Stream
(p-value) -log10
0 1 2 3 4 5 6 7 8 9 10
Event Classes
10-2
10-1
1 10 102
= 7 TeV) s Data 2011 ( SM Toy Experiments SM+SU(660, 240) SM+SU(1220, 180) SM+SU(1220, 240) L dt = 4.7 fb-1
∫
ATLASPreliminary Muon Stream
(p-value) -log10
0 1 2 3 4 5 6 7 8 9 10
Event Classes
10-1
1 10 102
= 7 TeV) s Data 2011 ( SM Toy Experiments SM+SU(660, 240) SM+SU(1220, 180) SM+SU(1220, 240) L dt = 4.7 fb-1
∫
ATLASPreliminary JetTauEtmiss Stream
Figure 10: Sensitivity of the search method to supersymmetric signal models, shown for each stream
separately. The figure shows the observed and expected number of classes in each stream having a given
range in
−log
10(p
−value). The band for the SM toy experiments represents the uncertainty, due to the
statistics of the toy experiments, on the mean expected number of classes. The predicted number of
classes are indicated for the three CMSSM
/MSUGRA models with tan
β=10, A
0=0 and
µ >0 and the
References
[1] D0 Collaboration, Abbott, B. et al., Search for new physics in eµX data at DØ using SLEUTH: A quasi-model-independent search strategy for new physics, Phys. Rev. D
62(2000) 092004.
[2] H1 Collaboration, A. Aktas et al., A General search for new phenomena in ep scattering at HERA, Phys.Lett.
B602(2004) 14–30, arXiv:hep-ex/0408044 [hep-ex].
[3] CDF Collaboration, Aaltonen, T. et al., Model-independent and quasi-model-independent search for new physics at CDF, Phys. Rev. D
78(2008) 012002, arXiv:0712.1311 [hep-ex].
[4] CMS Collaboration, Model Unspecific Search for New Physics in pp Collisions at sqrt(s)
=7 TeV , 2011. CMS-PAS-EXO-10-021.
[5] ATLAS Collaboration, The ATLAS Experiment at the CERN Large Hadron Collider, 2008. JINST
3(2008) S08003.
[6] ATLAS Collaboration, Luminosity Determination in pp Collisions at
√s
=7 TeV using the ATLAS Detector in 2011, 2011. ATLAS-CONF-2011-116.
[7] ATLAS Collaboration, Search for squarks and gluinos using final states with jets and missing transverse momentum with the ATLAS detector in
√s
=7 TeV proton-proton collisions, 2012.
ATLAS-CONF-2012-033.
[8] T. Sjostrand, S. Mrenna, and P. Z. Skands, PYTHIA 6.4 Physics and Manual, JHEP
0605(2006) 026, arXiv:hep-ph/0603175.
[9] A. Sherstnev and R. S. Thorne, Parton Distributions for LO Generators, Eur. Phys. J.
C55(2008) 553–575, arXiv:0711.2473 [hep-ph].
[10] M. L. Mangano et al., ALPGEN, a generator for hard multiparton processes in hadronic collisions, JHEP
07(2003) 001, arXiv:hep-ph/0206293.
[11] G. Corcella et al., HERWIG 6.5: an event generator for Hadron Emission Reactions With Interfering Gluons (including supersymmetric processes), JHEP
01(2001) 010,
arXiv:hep-ph/0011363.
[12] J. M. Butterworth, J. R. Forshaw, and M. H. Seymour, Multiparton interactions in photoproduction at HERA, Z. Phys.
C72(1996) 637–646, arXiv:hep-ph/9601371.
[13] D. Stump et al., Inclusive jet production, parton distributions, and the search for new physics, JHEP
0310(2003) 046, arXiv:hep-ph/0303013 [hep-ph].
[14] Anastasiou, C. et al., High precision QCD at hadron colliders: Electroweak gauge boson rapidity distributions at NNLO, Phys.Rev.
D69(2004) 094008, arXiv:hep-ph/0312266 [hep-ph].
[15] ATLAS Collaboration, Measurement of the cross-section for b-jets produced in association with a Z boson at sqrt(s)
=7 TeV with the ATLAS detector, Phys.Lett.
B706(2012) 295–313,
arXiv:1109.1403 [hep-ex].
[16] ATLAS Collaboration, Measurement of the cross section for the production of a W boson in association with b-jets in pp collisions at sqrt(s)
=7 TeV with the ATLAS detector, Phys.Lett.
B707
(2012) 418–437, arXiv:1109.1470 [hep-ex].
[17] J. Alwall et al., MadGraph 5 : Going Beyond, JHEP
1106(2011) 128, arXiv:1106.0522 [hep-ph].
[18] G. Bozzi, F. Campanario, M. Rauch, and D. Zeppenfeld, Zγγ production with leptonic decays and triple photon production at NLO QCD, Phys.Rev.
D84(2011) 074028, arXiv:1107.3149 [hep-ph].
[19] G. Bozzi, F. Campanario, M. Rauch, and D. Zeppenfeld, W
+−γγproduction with leptonic decays at NLO QCD, Phys.Rev.
D83(2011) 114035, arXiv:1103.4613 [hep-ph].
[20] S. Frixione and B. R. Webber, Matching NLO QCD computations and parton shower simulations, JHEP
06(2002) 029, arXiv:hep-ph/0204244.
[21] S. Frixione and B. R. Webber, The MC@NLO 3.2 event generator, arXiv:hep-ph/0601192 [hep-ph].
[22] S. Moch and P. Uwer, Heavy-quark pair production at two loops in QCD, Nucl.Phys.Proc.Suppl.
183