A TLAS-CONF-2016-082
08August2016ATLAS NOTE
ATLAS-CONF-2016-082
4th August 2016
Searches for heavy Z Z and ZW resonances in the `` q q and νν q q final states in pp collisions at √
s = 13 TeV with the ATLAS detector
The ATLAS Collaboration
Abstract
This note reports searches for heavy resonances decaying into a Z Z or ZW pair using proton- proton collision data at a centre-of-mass energy of
√ s = 13 GeV. The data, corresponding to an integrated luminosity of 13.2 fb
−1, were recorded with the ATLAS detector in 2015 and 2016 at the Large Hadron Collider. The searches are performed in final states in which one Z boson decays to either a pair of light charged leptons (electrons and muons) or a pair of neutrinos, and the associated W boson or the other Z boson decays hadronically. The data are found to be in good agreements with the background expectations and no evidence for the production of heavy resonances is observed. Upper bounds on the production cross sections times their decay branching ratios to Z Z or ZW pairs are derived for heavy resonances in the mass range of 300 − 5000 GeV, within the context of Standard Model extensions with an extended Higgs sector, a heavy vector triplet or warped extra dimensions.
© 2016 CERN for the benefit of the ATLAS Collaboration.
Reproduction of this article or parts of it is allowed as specified in the CC-BY-4.0 license.
1. Introduction
The discovery of a Higgs boson h with a mass of approximately 125 GeV in 2012 [1, 2] represents a major milestone in our understanding of electroweak symmetry breaking. Subsequent studies [3–6] have shown that the properties of the new particle are consistent with the expectations of the Standard Model (SM) Higgs boson. Nevertheless, the current experimental data cannot rule out the possibility that the particle is part of an extended Higgs sector, nor other extensions of the SM. Many of these models predict the existence of diboson resonances. In models with an extended Higgs sector such as the two-Higgs-doublet model (2HDM) [7] and the electroweak-singlet (EWS) model [8], a heavy spin-0 neutral Higgs boson can decay to a pair of Z bosons. In extended gauge models [9], a heavy W -boson like vector boson is predicted to decay to ZW , and in models with warped extra dimensions [10, 11], a spin-2 graviton is expected to decay to Z Z .
This note reports searches for heavy resonances decaying to a pair of bosons ZV (V = W, Z ) . Two ZV decay modes are considered: one in which the Z boson (or one of the two Z bosons in case of Z Z ) decays to a pair of light charged leptons (electrons or muons, referred to as ` ), Z → `` 1, and the other in which the Z boson decays to a pair of neutrinos, Z → νν . In both cases, the vector boson V is required to decay to a pair of quarks, V → qq , leading to decay modes ZV → ``qq and ZV → ννqq .
The reconstruction of the V → qq decay proceeds in two different ways. The resolved reconstruction attempts to identify two separate small-radius jets (small-R jet, or j ) of hadrons from the V → qq decay, while the merged reconstruction uses jet-substructure techniques to identify the V → qq decay reconstructed as a single large-radius jet (large- R jet, or simply J ). The latter is expected when the resonance mass is significantly higher than the V boson mass. In this case, the qq pair from the V boson decay can be collimated; hadrons from the two quarks overlap in the detector and are more efficiently reconstructed as a single large- R jet (“merged selection"). The ZV → ``qq searches utilise both reconstructions of the V → qq decay while the ZV → ννqq search uses only the merged reconstruction.
Production of heavy resonances will manifest themselves as resonant structures in the invariant-mass distributions of the ``qq final state and as broad enhancements in the transverse-mass distributions of the ννqq final state. Thus for the ZV → ``qq decay mode, the invariant masses of the `` J system ( m
``J) and of the `` j j system ( m
``j j) are used as the final discriminants for the signal-background separations for the merged and resolved reconstructions of the V → qq decays, respectively. For the ZV → ννqq decay mode, the final discriminant used is the transverse mass ( m
T) of the large- R jet and the missing transverse momentum.
Both the ATLAS and CMS Collaborations have searched for heavy resonances in ZV decays in the
√ s = 7 and 8 TeV datasets [12–16] and in the
√ s = 13 TeV datasets [17–20]. This note updates and extends previous ATLAS searches of ZV resonances at
√ s = 13 TeV in the ZV → ``qq [17, 21] and in the ZV → ννqq [18] final states using approximately a fourfold larger dataset.
2. ATLAS detector
The ATLAS detector [22] at the LHC [23] covers nearly the entire solid angle around the collision point, and
consists of an inner tracking detector surrounded by a thin superconducting solenoidal magnet producing
a 2 Tesla axial magnetic field, electromagnetic and hadronic calorimeters, and a muon spectrometer incorporating three large toroid magnet assemblies. The inner detector (ID) consists of a high-granularity silicon pixel detector, including the newly-installed Insertable B-layer (IBL) [24], and a silicon microstrip tracker, together providing precision tracking in the pseudorapidity2 range | η| < 2 . 5, complemented by a transition radiation tracker, providing tracking and electron identification information for |η | < 2 . 0. A lead liquid-argon (LAr) electromagnetic calorimeter covers the region |η| < 3 . 2, and hadronic calorimetry is provided by steel/scintillating tile calorimeters for |η | < 1 . 7 and by copper/LAr hadronic calorimeters for 1.7 < |η | < 3.2. The forward region is covered by additional LAr calorimeters with copper and tungsten absorbers. The muon spectrometer (MS) consists of precision tracking chambers covering the region
|η | < 2 . 7, and separate trigger chambers covering |η | < 2 . 4. A two-level trigger system, using custom hardware followed by a software-based level, is used to reduce the event rate to approximately 1 kHz for offline storage.
3. Data and Monte Carlo samples
The data used in the searches were collected with the ATLAS detector in 2015 and 2016 proton-proton collisions at a centre-of-mass energy of 13 TeV, corresponding to an integrated luminosity of 3.2 fb
−1in 2015 and 10.0 fb
−1in 2016.
Events used in the ZV → ``qq search were recorded with a combination of multiple single-electron or single-muon triggers with varying E
T(electron) and p
T(muon), quality, and isolation requirements.
The minimum E
Tthreshold for electrons is 24 GeV, while the minimum p
Tthreshold for muons is 20 GeV. These triggers are complemented by triggers with higher thresholds with no isolation requirement (60 GeV or 120 GeV for electrons and 50 GeV for muons). Events belonging to the ZV → ννqq channel are recorded using an E
missT
trigger with an online threshold of 80 GeV for 2015 data and of 100 GeV for 2016 data.
Three models of physics beyond the Standard Model are used as benchmarks for the interpretation of the results: a neutral heavy spin-0 Higgs boson H using the narrow-width approximation [25], a spin-1 W
0boson from heavy vector triplet (HVT) model A [26] and a spin-2 graviton G
∗(RS graviton) from bulk Randall-Sundrum model [27, 28]. Monte Carlo (MC) samples of H → Z Z are generated by Powheg-Box v1 r2856 [29–32] with the CTEQ6L1 [33] parton distribution function (PDF) assuming a Higgs boson width of 4.0 MeV, which is far smaller than the experimental resolutions. Both gluon-gluon fusion (ggF) and vector-boson fusion (VBF) production processes are considered. Benchmark samples of HVT W
0→ ZW and RS graviton G
∗→ Z Z are generated with MadGraph5 2.2.2 [34], using the NNPDF23LO [35] PDF. For the HVT model, assuming the coupling strength to the vector boson g
V= 1, the charged vector triplet W
0has a width approximately 2.5% of its mass while for κ/M
Pl= 1, the G
∗has a width relative to its mass of approximately 6%. Here κ is the curvature of the warped extra dimensions and M
Plis the reduced Planck mass. The parton showering and hadronisation are modelled with Pythia 8.186 [36] using the A14 set of the tuned parameters (tune) for the underlying event (UE) [37] for the W
0and G
∗samples and the AZNLO tune [38] for the Higgs samples. Potential signal and background interference effects are neglected in the signal modelling.
2ATLAS uses a right-handed coordinate system with its origin at the nominal interaction point in the centre of the detector, and thezaxis along the beam line. Pseudorapidity is defined in terms of the polar angleθasη=−ln tanθ/2, and transverse momentum and energy are defined relative to the beamline aspT=psinθandET=Esinθ. The azimuthal angle around the beam line is denoted byφ, and distances in(η, φ)space by∆R=q
∆η2+∆φ2.
MC simulated events are also used to model background processes. The main background sources are Z and W bosons produced in association with jets ( Z +jets and W +jets), followed by top-quark production (both t¯ t pair and single-top) and non-resonant vector-boson pair production ( Z Z , W Z and W W ). Z and W +jets events are simulated using the Sherpa 2.2 [39] generator. Matrix elements are calculated for up to two partons at NLO and up to four partons at LO using the Comix [40] and OpenLoops [41]
programs. Diboson processes with one of the bosons decaying hadronically and the other leptonically are simulated using Sherpa 2.2. They are simulated for up to one ( Z Z ) or zero ( W Z, W W ) additional partons at NLO and up to three additional partons at LO using the Comix and OpenLoops programs. For both Z +jets and diboson simulation, the matrix-element calculations are merged with the Sherpa parton shower using the ME+PS@NLO prescription [42]. The CT10 [43] PDF set is used in conjunction with dedicated parton shower tuning developed by the Sherpa authors. For the generation of top-quark pairs and single top-quarks in the W t− and s -channels, the PowhegBox v2 [44–46] generator with the CT10 PDF set is used. Electroweak t -channel single top-quark events are generated using the PowhegBox v1 generator. This generator uses the four-flavour scheme for the NLO matrix-element calculations together with the fixed four-flavour PDF set CT10f4 [43]. For all top processes, top-quark spin correlations are preserved (for t -channel, top-quarks are decayed using MadSpin). The parton shower, fragmentation, and underlying event are simulated using Pythia 6.428 with the CTEQ6L1 PDF set and the corresponding Perugia 2012 tune (P2012) [47]. The top mass is set to 172.5 GeV. The EvtGen v1.2.0 program [48] is used to decay bottom and charm hadrons.
Cross sections are calculated up to next-to-next-to-leading order (NNLO) QCD corrections for Z and W +jets production [49]. Cross sections for diboson production are calculated at NLO including LO contributions with two additional partons [39, 50]. The t t ¯ production cross section is calculated at NNLO in QCD, including resummation of next-to-next-to-leading logarithmic (NNLL) soft gluon terms [51, 52].
The single-top production cross sections are calculated to NLO in QCD [53], including the soft gluon resummation at NNLL [54] for the W t process.
For the ``qq in the simulation of the Z +jets events, jets are labelled according to the flavours of the hadrons with p
T> 5 GeV found within a cone of size ∆R = 0 . 4 around the reconstructed jet axes. If a b -hadron is found, the jet is labelled as a b -jet; if one is not found and a charmed hadron is found, the jet is labelled as a c -jet; if neither is found, the jet is labelled as a light (i.e., u -, d -, or s -quark, or gluon) jet, denoted by ‘ j ’. Simulated Z +jets events passing the selection of the resolved analysis are labelled according to the flavours of the jets identified from the Z → qq decays in the order of Z + bb , Z + bc , Z + b j , Z + cc , Z + c j , and Z + j j .
The simulation of the detector is performed with the full ATLAS detector simulation [55] based on Geant4 [56]. An average of 30 inelastic simulated pp collisions generated with Pythia 8.186 are overlaid to model the effects of both in- and out-of-time pileup, from additional pp collisions in the same and nearby bunch crossings. MC samples are reweighted to match the pile-up conditions in the data. All simulated events are processed using the same reconstruction algorithms as the data.
4. Object reconstruction and identification
Events are retained for analysis if they were recorded with all detector systems operating normally and pass event- and jet-level cleaning requirements [57]. Event vertices are formed from tracks with p
T> 400 MeV.
If an event contains more than one vertex candidate, the one with the highest P
p
2of its associated tracks
is selected as the primary vertex. All events are required to have one primary vertex with at least two associated tracks.
Electrons are reconstructed from isolated energy clusters in the electromagnetic calorimeter matched to ID tracks, within the fiducial region of transverse energy E
T> 25 GeV and pseudorapidity |η| < 2 . 47.
A likelihood-based (LH) requirement [58] is imposed to reduce the background from misidentified or non-prompt electrons. Electrons are classified as either ‘loose’, satisfying the loose LH identification criteria, or ‘medium’, satisfying the medium LH identification criteria described in Ref. [58].
Muons are reconstructed by fitting the ID and MS tracks together, and are required to have p
T> 25 GeV and |η | < 2 . 5. Muons must pass identification requirements, based on the number of hits in the different ID and MS subsystems, and the significance of the difference |q/p
MS− q/p
ID| [59], where q is the charge and p
MS( p
ID) is the momentum of the muon measured in the muon spectrometer (inner detector). Similar to electrons, muons are also classified as either ‘loose’ or ‘medium’, following the criteria of Refs. [59, 60].
All electrons and muons are required to be isolated using selections on the sum of track p
Tin a variable-size cone around their directions (excluding the track associated to the lepton); the cone size depends on the lepton p
T. The isolation selection criteria are designed to produce a flat efficiency of 99 % in the p
T− η plane for reconstructed leptons from Z → `` decays in Z +jets events, and to minimize efficiency loss for highly boosted Z bosons in the relevant kinematic range. Furthermore, to reject leptons not originating from the primary vertex the product of the longitudinal impact parameter z
0and the sine of the polar angle of the candidates ( θ ) must satisfy |z
0sin (θ) | < 0 . 5 mm. In addition, the ratio of the transverse impact parameter d
0to its uncertainty σ
d0must be less than five for electrons and less than three for muons.
Small- R jets are reconstructed using the anti- k
talgorithm [61] with a radius parameter of R = 0 . 4.
Energy- and η -dependent correction factors derived from MC simulations are applied to correct jets back to the particle level [62]. Jets are required to have p
T> 30 GeV and |η | < 4 . 5 and those with |η | < 2 . 5 are called ‘signal’ jets. To suppress contributions from pileup interactions, jets with p
T< 60 GeV and within the acceptance of the inner tracker ( |η | < 2 . 4) must have a value of the jet vertex tagger, based on tracking and vertexing information [63], above 59%.
The ‘signal’ jets containing b -hadrons are identified using a multivariate algorithm ( b -tagging) [64], which combines information such as the explicit reconstruction of secondary decay vertices and track impact-parameter significances. The chosen b -tagging algorithm has an efficiency of 70% for b -quark jets in the simulated t¯ t events, with a light-flavour jet rejection factor of about 380 and a c-jet rejection of about 12.
Large- R jets are reconstructed with the anti- k
talgorithm, but with the radius parameter increased to R = 1 . 0. The jets are groomed to reduce the effect of pileup and other noise sources on the resolution.
The chosen grooming technique is the trimming algorithm [65]. Trimming takes the original constituents of the jet and reclusters them using the k
talgorithm [66] with a smaller distance parameter, R
subjet, to produce a collection of subjets. These subjets are discarded if they carry less than a specific fraction ( f
cut) of the original jet p
T. The trimming parameters optimised for this search are R
subjet= 0 . 2 and f
cut= 5%. The large- R jet four-momenta are recomputed from the selected subjets, and the jet energies and masses are calibrated to particle-level using correction factors derived from MC simulations [67].
They are required to have p
T> 200 GeV and their rapidity range is limited to |η | < 2 . 0.
Boson tagging is applied to the large- R jets to select those from V → qq decays. The tagging is performed
through a two-step process [68, 69]. A p
T-dependent requirement is applied to the jet substructure variable
D
(β=1)2
, which is a ratio of energy correlation functions of subjets [70, 71]. The V boson jets are then selected by requiring the large- R jet mass m
Jto be in the ± 15 GeV window centred around the expected value of the boson mass from simulations. This boson tagging is approximately 50% efficient for the signals studied.
The missing transverse momentum ( E
missT
) is calculated as the negative vectorial sum of the transverse momenta of calibrated electrons, muons, and small- R jets. Energy depositions from the underlying event and other soft radiation are taken into account by constructing a “soft term” from ID tracks associated to the primary vertex that are not matched to any reconstructed object [72–74]. The ZV → ννqq search requires a minimum E
missT
of 250 GeV. The track-based missing transverse momentum, with magnitude p
missT
, is the negative vectorial sum of the transverse momenta of all good-quality tracks reconstructed in the ATLAS inner detector.
5. ZV → `` q q channel
The ZV → ``qq event selection begins with the identification of the Z → `` decays. Events with the selected Z → `` candidates are then subject to the selection of the “merged analysis”, and if they fail, to that of the “resolved analysis”. The order was chosen because of lower background expectations in the merged analysis. Signal events from the production of H → Z Z → ``qq through the ggF process, HVT W
0→ ZW → ``qq and RS graviton G
∗→ Z Z → ``qq are expected to have similar characteristics and consequently their selections are similar as well. These selections are described in Secs. 5.1.1 for the merged analysis and 5.1.2 for the resolved analysis. Events from the VBF Higgs boson production possess unique topologies, and hence are selected from the H → Z Z → ``qq candidates by applying additional criteria. This analysis, referred to as the “VBF analysis”, is described in Sec. 5.1.3.
5.1. Selection of ZV → `` q q events
Z → `` candidates are selected by requiring two isolated same-flavour leptons (electrons or muons) passing the ‘loose’ criteria. At least one of them must pass the ‘medium’ criteria. Opposite charges are required for the muon pairs; however, no such requirement is applied to the electron pairs, as the electron charge could be mismeasured due to photon conversions from bremsstrahlung radiation, especially at high E
T. The dilepton invariant mass m
``is required to be consistent with the Z → `` decay. For electron pairs, m
``must be between 83 − 99 GeV. For muon pairs, a dilepton transverse momentum p
``T
dependent mass window of [85 . 63 − 0 . 00117 p
``T
, 94 . 00 + 0 . 0185 p
``T
] GeV is applied to account for the expected degradation in the Z → µµ mass resolution at high p
``T
. The range is chosen such that the Z → µµ selection efficiency is approximately independent of the heavy resonance mass. Events with additional leptons passing the ‘loose’ criteria are vetoed.
5.1.1. Merged analysis
The candidates of the merged analysis, `` J , are selected from the Z → `` events by requiring at least one large-R jet. The large-R jet with the highest transverse momentum is assumed to be from the V → qq decay. Events are further required to have min( p
``T
, p
JT
)/m
``J> 0 . 3 for the H → Z Z search and
``
the dilepton and the large- R jet system. The looser requirement for the H → Z Z search is motivated by the expected softer p
``T
and p
JT
spectra resulting from the spin-0 nature of the resonance. This requirement suppresses background significantly at large m
``Jwhile maintaining high efficiencies for signals over the resonance mass ranges explored.
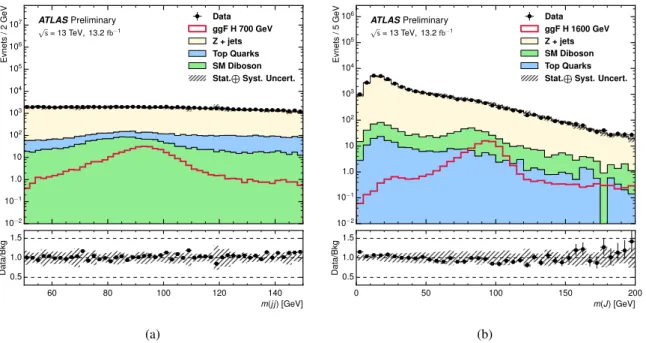
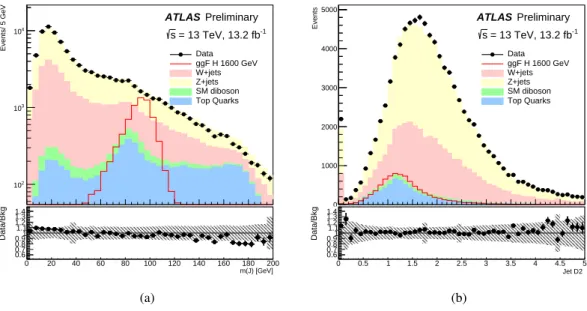
The large- R jet is subject to the boson tagging as discussed in Sec. 4. Figure 1 (b) shows the distribution of the large- R jet mass m
Jof the H → Z Z selection, comparing data with expectations from background and signal processes. Background contributions are mostly from Z +jets, top quark and diboson production (see Sec. 5.2). The distributions for the W
0→ ZW and G
∗→ Z Z selections are similar. The jet mass is required to be within the window of the Z boson mass for the H/G
∗→ Z Z search and within the window of the W boson mass for the W
0→ ZW search. Two signal regions (SR, also referred to as categories) are defined, one for events passing the jet-substructure requirement and the other for events failing the requirement. The former is called the high-purity SR whereas the latter is called the low-purity SR.
10−2 10−1 1.0 10 102 103 104 105 106 107
Evnets/2GeV ATLASPreliminary
√s= 13 TeV, 13.2fb−1
Data ggF H 700 GeV Z + jets Top Quarks SM Diboson Stat.LSyst. Uncert.
60 80 100 120 140
m(jj) [GeV]
0.5 1.0 1.5
Data/Bkg
(a)
10−2 10−1 1.0 10 102 103 104 105 106
Evnets/5GeV ATLASPreliminary
√s= 13 TeV, 13.2fb−1
Data ggF H 1600 GeV Z + jets SM Diboson Top Quarks Stat.LSyst. Uncert.
0 50 100 150 200
m(J) [GeV]
0.5 1.0 1.5
Data/Bkg
(b)
Figure 1: Observed and expected distributions of (a) the dijet mass
mj jof the resolved analysis and (b) the large-
Rjet mass
mJof the merged analysis, combining their respective signal regions. Both distributions are for the
H→ Z Zselection before the
V → qqselection. Background contributions in these distributions are estimated from MC simulations. The expected signal distributions from a Higgs boson at 700 GeV for the resolved analysis and at 1600 GeV for the merged analysis are overlaid for comparisons. The Higgs boson is assumed to have a
σ×BR
(H→ Z Z)value of 100 fb at 700 GeV and 10 fb at 1600 GeV. The bottom panes show the ratio of the observed data to the predicted background. The uncertainty on the total background prediction, shown as bands, combines statistical and systematic contributions. The blue triangles in the bottom panes indicate bins where the ratio is outside the vertical range of the plot.
The invariant mass m
``Jof the `` J system is used as the final discriminant to extract the potential signal.
To mitigate the impact of degrading muon momentum resolution at high p
T, a scale factor of m
Z/m
µ µis applied to the four-momentum of the dimuon system of the Z → µµ events, effectively constraining its mass to m
Z= 91 . 2 [75]. The scaling improves the resonance mass resolution of the dimuon final state by approximately 36% for a heavy resonance at 1600 GeV. However, the improvement is reduced to 5%
when combined with the dielectron final state, as the latter has a significant better resolution at high mass.
Figure 2 (b) shows the expected m
``Jdistribution from a 1600 GeV Higgs boson.
500 550 600 650 700 750 800 850 900
m(``jj) [GeV]
0.00 0.05 0.10 0.15 0.20 0.25
1 N·dN dm(``jj)
ATLASSimulation Preliminary ps= 13 TeV
gg!H(700 GeV)!Z Z!``qq WithZmass constraints,ee WithZmass constraints,µµ WithZmass constraints
(a)
1300 1400 1500 1600 1700 1800 1900
m(``J) [GeV]
0.00 0.05 0.10 0.15 0.20
1 N·dN dm(``J)
ATLASSimulation Preliminary
√s= 13 TeV
gg→H(1.6TeV)→Z Z→``qq WithZmass constraint,ee WithZmass constraint,µµ WithZmass constraint
(b)
Figure 2: Invariant mass distributions of the selected ggF
H → Z Z →``qqevents from MC simulations of (a) resolved analysis for a 700 GeV Higgs boson and (b) merged analysis for a 1600 GeV Higgs boson, after
Zboson mass constraints. The electron and muon channels are shown separately in dashed histograms while the combined is shown as a solid histogram.
5.1.2. Resolved analysis
The candidates of the resolved analysis, `` j j , are selected from the Z → `` events that failed the selection of the merged analysis by requiring at least two central (“signal”) small- R jets.
For the H/G
∗→ Z Z → ``qq search, about 21% of the Z → qq decays have two b -jets, whereas the dominant background, Z (``) +jets, has a smaller heavy-quark content. Thus `` j j events are divided into two categories: events with two b -tagged jets (tagged category) and events with fewer than two b -tagged jets (untagged category). Events with more than two b -tagged jets are rejected. The two b -tagged jets in the tagged category and the two highest- p
Tjets or one b -tagged jet plus one highest- p
Tjet in the untagged category are assumed to be from the Z → qq decay. For the W
0→ ZW search, no b -tagging is applied and the two leading jets are assumed to be from the W → qq decay. In all cases, the leading jet of the V → qq decay must have p
T> 60 GeV. To reduce backgrounds from non-resonance production, a requirement is added on the kinematic quantity
q p
2T
(``) + p
2T
( j j) / m
``j j, which must be > 0 . 4 for the H → Z Z search and > 0 . 5 for the W
0→ ZW and G
∗→ Z Z searches is imposed. Here p
T(``) and p
T( j j) are the transverse momenta of the dilepton and dijet system, respectively, and m
``j jis the invariant mass of the `` j j system.
The signal events are expected to have a dijet invariant mass m
j jconsistent with the V → qq decays.
Figure 1 (a) shows the m
j jdistributions of the H → Z Z search, combining tagged and untagged categories.
The dijet invariant mass must be in the window of 70 − 105 GeV for the H/G
∗→ Z Z search and in the window of 62 − 97 GeV for the W
0→ ZW search.
Similar to the merged analysis, the invariant mass of the `` j j system is used as the final discriminant. In
µµ /m
applied to the dijet four momentum to constrain the its mass to m
V, the PDG [75] value of the vector boson mass. Here V = W or Z depending on the final state under study. The boson mass constraints improve the mass resolution of the dimuon final state by approximately 17% for a 700 GeV Higgs boson.
The improvement is reduced to 8% when dielectron and dimuon final states are combined. The m
``j jdistribution from simulation for a 700 GeV Higgs boson is shown in Fig. 2 (a).
5.1.3. VBF analysis
A heavy neutral Higgs boson can also be produced through the vector-boson fusion process ( qq
0H ) in addition to the gluon-gluon fusion process. Events from VBF production are characterised by two additional jets (referred to as the tag jets) in addition to those from the V → qq decay. They typically have a large dijet invariant mass and a large separation in pseudorapidity.
Events passing the H → Z Z → ``qq selection above are further subject to VBF specific selections. Due to limited statistics, the b-tagged and non b-tagged categories of the resolved analysis are combined for the VBF analysis, leading to three signal regions. The tagged jets are selected from small- R jets. They are required to have a pseudorapidity separation of |∆ η| > 1 . 5 from the leading large- R jet for the merged analysis and are not those identified as the V → qq jets for the resolved analysis.
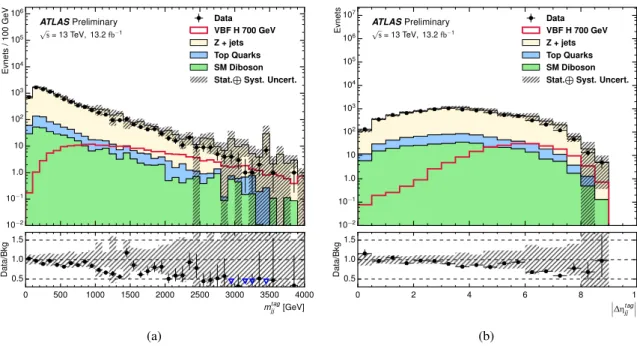
Figure 3 shows the distributions of the dijet invariant mass m
tagj jand pseudorapidity separation |∆η
tagj j| of the two tag jets, combining all categories of both merged and resolved analyses. There are noticeable differences between the data and the MC predictions in these distributions, however the differences are within the estimated systematic uncertainties. The VBF candidates are selected by requiring m
tagj j>
600 GeV and |∆η
tagj j| > 3 . 1. Events passing the H → Z Z → ``qq requirements but failing the VBF selection are kept as the ggF candidates.
5.2. Background estimation
Dominant backgrounds of the ZV → ``qq search are found to be from Z +jets, top-quark and diboson processes. Their contributions are estimated from a combination of MC and data-driven techniques. In all cases, the shapes of kinematic variables, including those of the final discriminants m
``Jand m
``j j, are taken from MC simulations. The multijet background is estimated to be negligible.
The Z (``) + jets events are expected to have smooth distributions of m
Jand m
j j, while the signal events should exhibit resonance structures at the mass of vector boson V . Thus, Z +jets control regions (CR) are defined for every signal region using side-bands of the m
Jor m
j jdistributions. Events in the control regions are selected in exactly the same way as those in their corresponding signal regions except for the requirement on m
Jor m
j j. For the merged analysis, the leading large- R jet is required to have its mass value outside the ± 15 GeV window of the vector boson mass. For the resolved analysis, a requirement of 50 < m
j j< 62 GeV or 105 < m
j j< 150 GeV is applied. A wider m
Jrange is chosen for the merged analysis to increase the number of events in the control region ( m
J< 65 GeV or m
J> 106 GeV). These control regions are used to constrain the Z +jets contributions in their corresponding signal regions through simultaneous fit to both regions as discussed in Sec. 8.
Top-quark production is a significant background in the tagged category of the resolved analysis. Its
contribution is normalised using a top-quark control region through a simultaneous fit including the signal
and Z+jets control regions. Events in this control region are selected by requiring two different-flavour
10−2 10−1 1.0 10 102 103 104 105 106
Evnets/100GeV ATLASPreliminary
√s= 13 TeV, 13.2fb−1
Data VBF H 700 GeV Z + jets Top Quarks SM Diboson Stat.LSyst. Uncert.
0 500 1000 1500 2000 2500 3000 3500 4000
mtagjj [GeV]
0.5 1.0 1.5
Data/Bkg
(a)
10−2 10−1 1.0 10 102 103 104 105 106 107
Evnets ATLASPreliminary
√s= 13 TeV, 13.2fb−1
Data VBF H 700 GeV Z + jets Top Quarks SM Diboson Stat.LSyst. Uncert.
0 2 4 6 8 ∆ηtagjj10
0.5 1.0 1.5
Data/Bkg
(b)
Figure 3: Observed and expected distributions of dijet (a) invariant mass and (b) pseudorapidity separation of the two tag jets of the VBF
H → Z Zanalysis, combining all categories of both merged and resolved analyses.
Background contributions in these distributions are estimated from MC simulations. All selections other than the VBF requirements are applied. The expected distributions for the production of a 700 GeV Higgs boson are overlaid for comparisons. The Higgs boson is assumed to have a
σ×BR
(H → Z Z)value of 100 fb. The bottom panes show the ratio of the observed data to the predicted background. The uncertainty on the total background prediction, shown as bands, combines statistical and systematic contributions. The blue triangles in the bottom panes indicate bins where the ratio is outside the vertical range of the plot.
leptons, e µ , with their invariant mass within 76 − 106 GeV, and two b -tagged jets with their invariant mass in the range of 50 − 150 GeV. The leading b -tagged jet is required to have p
T> 60 GeV. Similar to the selection of events in the signal regions, at least one of the leptons must pass the ‘medium’ criteria. This selection yields a sample of top-quark events with a purity of > 99%. This top-quark control region is used to constrain top-quark contributions for both tagged and untagged categories of the ggF Higgs boson and RS graviton searches. For all others, the top-quark backgrounds are estimated from MC.
Diboson production, mainly the SM Z Z and ZW processes, is also a significant background source. Their contributions are estimated completely from MC simulations.
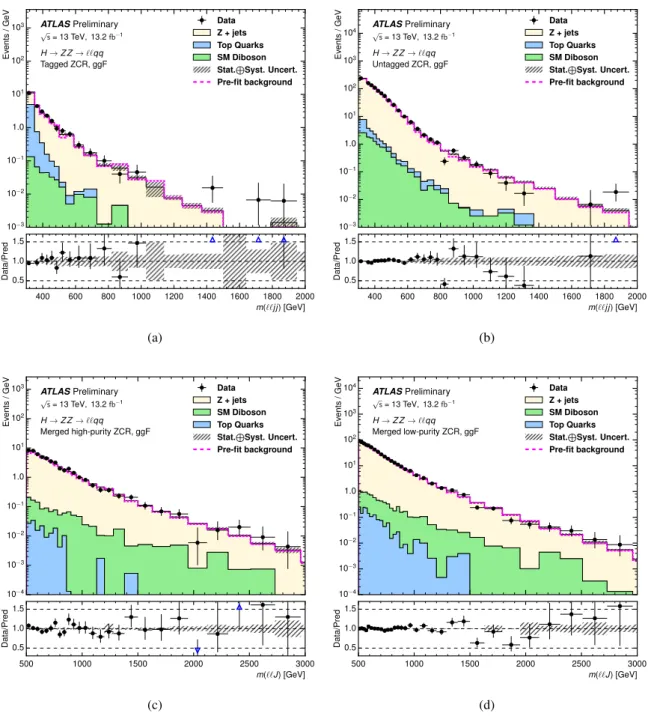
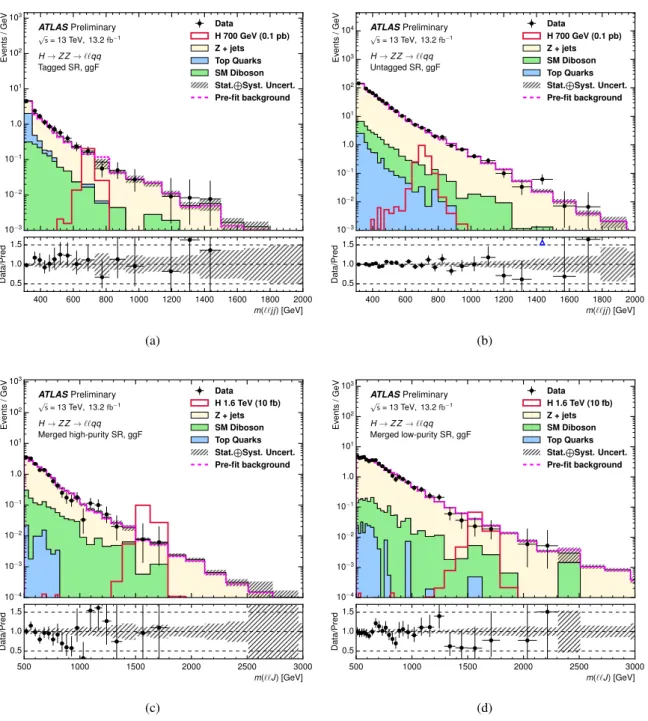
The invariant mass distributions of the Z Z decay products of the ggF, H → Z Z search in the Z +jets control regions are shown in Fig. 4. Distributions for the W
0→ ZW and G
∗→ Z Z searches are similar.
The background contributions in these distributions are from simultaneous fits to both signal and control
regions as discussed in Sec. 8. The background models discussed above describe the observed distributions
well in these control regions.
10−3 10−2 10−1 1.0 101 102 103
Events/GeV ATLASPreliminary
√s= 13 TeV, 13.2fb−1 H→Z Z→``qq Tagged ZCR, ggF
Data Z + jets Top Quarks SM Diboson Stat.LSyst. Uncert.
Pre-fit background
400 600 800 1000 1200 1400 1600 1800 2000
m(``jj) [GeV]
0.5 1.0 1.5
Data/Pred
(a)
10−3 10−2 10−1 1.0 101 102 103 104
Events/GeV ATLASPreliminary
√s= 13 TeV, 13.2fb−1 H→Z Z→``qq Untagged ZCR, ggF
Data Z + jets Top Quarks SM Diboson Stat.LSyst. Uncert.
Pre-fit background
400 600 800 1000 1200 1400 1600 1800 2000
m(``jj) [GeV]
0.5 1.0 1.5
Data/Pred
(b)
10−4 10−3 10−2 10−1 1.0 101 102 103
Events/GeV ATLASPreliminary
√s= 13 TeV, 13.2fb−1 H→Z Z→``qq Merged high-purity ZCR, ggF
Data Z + jets SM Diboson Top Quarks Stat.LSyst. Uncert.
Pre-fit background
500 1000 1500 2000 2500 3000
m(``J) [GeV]
0.5 1.0 1.5
Data/Pred
(c)
10−4 10−3 10−2 10−1 1.0 101 102 103 104
Events/GeV ATLASPreliminary
√s= 13 TeV, 13.2fb−1 H→Z Z→``qq Merged low-purity ZCR, ggF
Data Z + jets SM Diboson Top Quarks Stat.LSyst. Uncert.
Pre-fit background
500 1000 1500 2000 2500 3000
m(``J) [GeV]
0.5 1.0 1.5
Data/Pred
(d)
Figure 4: Distributions of the
Z+jets control regions of the ggF
H → Z Z → ``qqsearch:
m``j jof the resolved analysis for (a) the tagged and (b) untagged categories;
m``Jof the merged analysis for (c) the high-purity and (d) low-purity regions. These control regions are used to constrain the
Z+jets contributions as discussed in the text. The magenta dashed lines represent the total background contributions expected purely from MC simulations.
The bin widths are chosen to be comparable to the detector resolutions. The bottom panes show the ratios of the
observed data to the predicted background. The uncertainty on the total background prediction, shown as bands,
combines statistical and systematic contributions. The blue triangles in the bottom panes indicate bins where the
ratio is outside the vertical range of the plot.
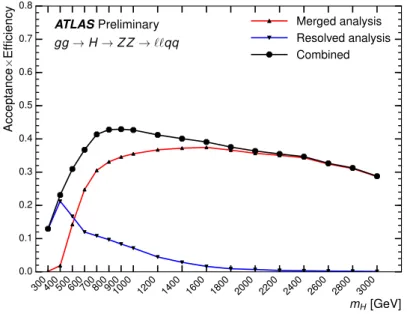
5.3. Signal selection efficiencies and mass resolutions
The signal selection efficiency is strongly dependent on the mass of the heavy resonance, as shown in Fig. 5 for the ggF H → Z Z → ``qq signal. The merged analysis dominates the selection efficiency at high mass whereas the resolved analysis contributes significantly at low mass. This reflects the high priority of the merged analysis over the resolved analysis and the expected large Lorentz boost of the Z bosons from heavy Higgs boson decays.
3004005006007008009001000 1200 1400 1600 1800 2000 2200 2400 2600 2800 3000
mH[GeV]
0.0 0.1 0.2 0.3 0.4 0.5 0.6 0.7 0.8
Acceptance×Efficiency
ATLASPreliminary gg→H→Z Z→``qq
Merged analysis Resolved analysis Combined
Figure 5: Selection efficiencies of the ggF
H →Z Z→``qqevents from MC simulations as functions of the Higgs boson mass for both merged and resolved analyses, combining their respective categories.
The reconstructed m
``Jand m
``j jdistributions have widths of 3 − 4% of the resonance mass for the Higgs boson and HVT W
0signals for the entire mass range studied, as can be seen from Fig. 2, that shows the expected m
``Jand m
``j jdistributions of the gg → H → Z Z → ``qq production for a Higgs boson at 1600 GeV and 700 GeV, respectively. Given the negligible intrinsic widths of these signals, the widths reflect largely the detector resolution. The widths of the m
``Jand m
``j jdistributions for the RS graviton signal are 4.5% at 500 GeV and rise to 6.8% at 4000 GeV. The small increase can be attributed to the slight increase in the intrinsic width of the signal. For a given resonance mass, the m
``Jdistributions are generally narrower than those of m
``j j.
Table 1 summarises the number of events observed in the data and estimated from background processes
in the four signal regions of the ggF H → Z Z → ``qq search from the background-only fit of both signal
and control regions discussed in Sec. 8. The expected numbers of events from the production of a heavy
Higgs boson with a mass of 400, 700 and 1600 GeV are also included for comparison.
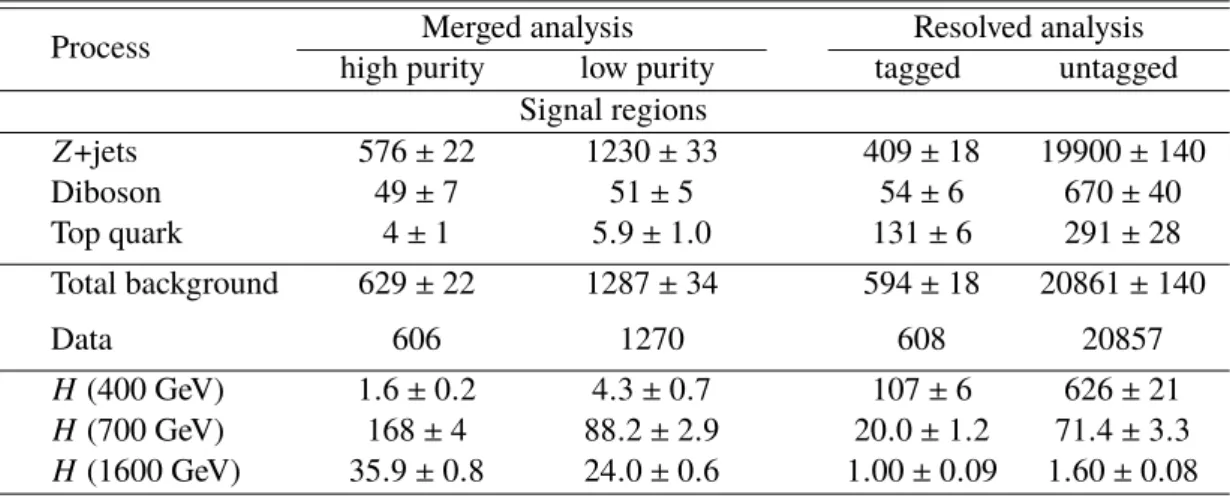
Table 1: Numbers of events predicted from background processes and observed in the data in the four signal regions of the ggF
H → Z Z →``qqsearch from the background-only fit of both signal and control regions, see Sec.
8.The numbers of signal events expected from a Higgs boson at 400 GeV, 700 GeV, and 1600 GeV are also shown.
The signal yields are calculated assuming
σ×BR values of 400 fb at 400 GeV, 100 fb at 700 GeV, and 20 fb at 1600 GeV. The uncertainties combine statistical and systematic contributions. The background uncertainties are posterior to the fit of Sec.
8.Process Merged analysis Resolved analysis
high purity low purity tagged untagged
Signal regions
Z +jets 576 ± 22 1230 ± 33 409 ± 18 19900 ± 140
Diboson 49 ± 7 51 ± 5 54 ± 6 670 ± 40
Top quark 4 ± 1 5 . 9 ± 1 . 0 131 ± 6 291 ± 28
Total background 629 ± 22 1287 ± 34 594 ± 18 20861 ± 140
Data 606 1270 608 20857
H (400 GeV) 1 . 6 ± 0 . 2 4 . 3 ± 0 . 7 107 ± 6 626 ± 21
H (700 GeV) 168 ± 4 88 . 2 ± 2 . 9 20 . 0 ± 1 . 2 71 . 4 ± 3 . 3
H (1600 GeV) 35 . 9 ± 0 . 8 24 . 0 ± 0 . 6 1 . 00 ± 0 . 09 1 . 60 ± 0 . 08
6. ZV → νν q q channel
6.1. Event selection
A set of criteria is imposed to select signal-like events in order to identify those events with large E
missT
resulting from the presence of a Z → νν decay and a hadronically decaying W or Z boson. Therefore, an initial selection is made by requiring E
missT
> 250 GeV and vetoing events with loose charged leptons.
The multijet background, originating primarily from the presence of mismeasured jets, and non-collision backgrounds are suppressed by imposing requirements on the magnitude of the track-based missing transverse momentum vector p ~
missT
( p
missT
> 50 GeV) and the azimuthal angle between E ~
missT
and ~ p
missT
, ( ∆φ( E ~
missT
, p ~
missT
) < 1. An additional requirement is imposed on the azimuthal distance between E ~
missT
and the nearest small- R jet (min[ ∆ φ( E ~
missT
, small −R jet ) ] > 0 . 4). The small- R jets considered here are required to have p
T> 30 GeV for |η | < 2 . 5. After this selection the multijet background is negligible.
The ννqq analysis uses only the merged selection. The hadronic boson decay is identified requiring that the leading (highest p
T) large- R jet in the event has a mass consistent with the W or Z boson mass as described in Section 4. Events are then split in two categories: high-purity and low-purity. Events where the leading large- R jet comes from a two-prong structure, as determined by the cut on the D
(β=1)2
variable, fall into the high-purity category. The remaining events that fail the D
(β=1)2
requirement fall into the low-purity signal region designed to recover the efficiency loss in the boosted regime . The pre-fit distribution of the mass of the leading- R jet distribution and the D
(β=1)2
are shown in Fig. 6.
Jet Mass [GeV]
0 20 40 60 80 100 120 140 160 180 200
Events/ 5 GeV
102
103
104
ATLAS Preliminary = 13 TeV, 13.2 fb-1
s Data ggF H 1600 GeV W+jets Z+jets SM diboson Top Quarks
m(J) [GeV]
0 20 40 60 80 100 120 140 160 180 200
Data/Bkg
0.60.7 0.80.91.11 1.21.3 1.4
(a)
Jet D2
0 0.5 1 1.5 2 2.5 3 3.5 4 4.5 5
Events
0 1000 2000 3000 4000 5000
ATLAS Preliminary = 13 TeV, 13.2 fb-1
s Data ggF H 1600 GeV W+jets Z+jets SM diboson Top Quarks
Jet D2
0 0.5 1 1.5 2 2.5 3 3.5 4 4.5 5
Data/Bkg
0.60.7 0.80.91.11 1.21.3 1.4
(b)
Figure 6: The mass of the large-
Rjet (a) and
D(β=1)2
of the large-
Rjet (b) are shown for the
ννqqanalysis.
All selections other than the requirement on the mass and
D(β=1)2
are applied. The Higgs boson is assumed to
have a
σ×BR
(H → Z Z)value of 1 pb. The bottom panel show the ratio of the observed data to the predicted
background. The uncertainty on the total background prediction, shown as bands, combines statistical and systematic
contributions.
It is not possible to fully reconstruct the invariant mass of the ZV system due to the neutrinos present in the final state, so the transverse mass is used as the final discriminant:
m
T= q
(E
T,J+ E
missT
)
2− ( ~ p
T,J+ E ~
missT
)
2(1)
where E
T,J= q
m
2J+ p
2T,J
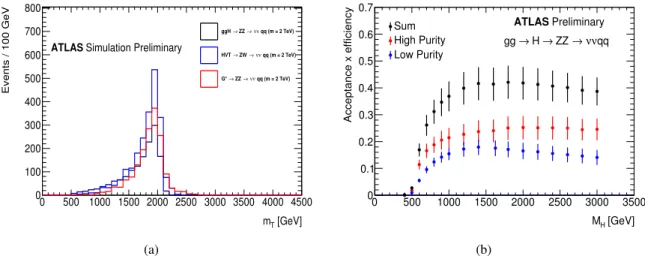
. This distribution is expected to show a Jacobian peak at the mass of the new particle for the signal while it is smooth for all of the background processes. The resolution on the transverse mass is about 25% of the signal mass for HVT, W
0and G
∗and 30% for the Heavy higgs as shown in Fig. 7 (a).
The efficiency of the selection for the H → ZV → ννqq signals is shown in Fig. 7 (b). The low-purity category helps recover around 10-20% efficiency depending on the mass considered and the boson p
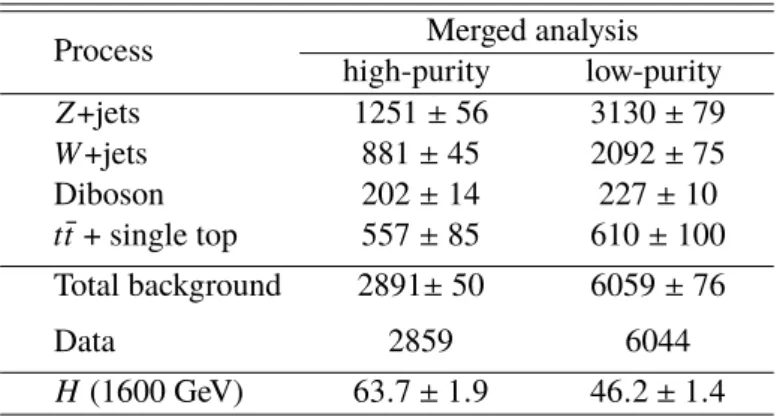
T. The efficiency drop at high mass is due to the degradation of the large R -jet mass resolution. Table 2 summarises the number of events observed in the data and estimated from background processes in the signal regions from the background-only fit of both signal and control regions discussed in Sec. 8.
[GeV]
mT
0 500 1000 1500 2000 2500 3000 3500 4000 4500
Events / 100 GeV
0 100 200 300 400 500 600 700 800
Simulation Preliminary ATLAS
qq (m = 2 TeV) ν ν ZZ → ggH →
qq (m = 2 TeV) ν ν ZW → HVT →
qq (m = 2 TeV) ν ν ZZ → G* →
(a)
[GeV]
MH
0 500 1000 1500 2000 2500 3000 3500
Acceptance x efficiency
0 0.1 0.2 0.3 0.4 0.5 0.6 0.7
Sum High Purity Low Purity
ATLASPreliminary qq ν ν ZZ → H → gg →
(b)
Figure 7: (a) Transverse mass distributions of the selected events from simulations for the ggF production of a Higgs boson, for HVT, W’ and
G∗at 2000 GeV. (b) Selection efficiencies of the
H → ZV → ννqqsignals from MC simulations as functions of the mass for the two signal region considered. The error bars include the statistical and the systematic uncertainties described in Sec.
7.6.2. Background estimation
The main backgrounds to this search in the ννqq channel are Z +jets, W +jets and t¯ t production, for which simulated samples are used. To test the modelling of each contribution, different control regions are defined. For all of them a modified version of the missing transverse momentum is introduced called E
missT,no mu
( p
missT,no mu
). This is computed by removing the muon p
Tcontribution from the calculation of the E
missT
.
An initial selection of E
missT,no mu
> 250 GeV is made to ensure that the E
missT
trigger used to record the events is fully efficient3 and selection of p
missT,no mu
> 50 GeV is made as in the signal region.
3At the trigger level, the measurement of theEmiss
T is performed considering only energy depositions in the calorimeter systems, effectively neglecting the contribution from muons.
Table 2: Numbers of events predicted from background processes and observed in the data in the signal regions of the
ννqqsearch from the background-only fit of both signal and control regions, see Sec.
8. The numbers of signalevents expected from a Higgs boson at 1600 GeV are also shown. The signal yields are calculated assuming
σ×BR values of 20 fb at 1600 GeV. The quoted uncertainties are the combined systematic and statistical uncertainties after the fit. Uncertainties in the normalization of individual backgrounds may be larger than the uncertainty on the total background due to correlations.
Process Merged analysis
high-purity low-purity
Z +jets 1251 ± 56 3130 ± 79
W +jets 881 ± 45 2092 ± 75
Diboson 202 ± 14 227 ± 10
t¯ t + single top 557 ± 85 610 ± 100 Total background 2891 ± 50 6059 ± 76
Data 2859 6044
H (1600 GeV) 63 . 7 ± 1 . 9 46 . 2 ± 1 . 4
The Z +jets background is studied by selecting dimuon decays of the Z boson. Events are selected with exactly two muons, one of which is required to have p
T> 25 GeV. The invariant mass of the dimuon system is required to be between 66 and 116 GeV. To ensure that this control region is fully depleted of any signal arising from resonant Z Z/W Z production in which the Z decays to a pair of muons, it is required that the mass of the selected large- R jet is outside of the region formed from the union of the W and Z boson mass regions ( m
J< 65 GeV or m
J> 106 GeV). Two control regions are introduced: a high-purity one containing events passing the D
(β=1)2
requirement and a low-purity one where such requirement is dropped, to mimic the corresponding signal regions.
The W + jets and the t¯ t processes are studied in events with exactly one muon candidate and at least one large- R jet. Both kinds of events are initially identified by the presence of one muon. The presence of b -jets, not overlapping with the large- R jet, in the final state is then used to obtain two independent samples of events. If the event contains at least one b -jet, it is considered to belong to the t¯ t control region; the remaining events are considered to belong to the W +jets control region. For the W +jets control region the jet mass requirement is inverted to ensure that there is no resonant diboson signal contamination, while for the t¯ t control region, the leading large- R jet is required to be consistent with the mass of the W . As in the Z +jet control region two regions are defined based on the D
(β=1)2
requirement, a high-purity control region and a low-purity one.
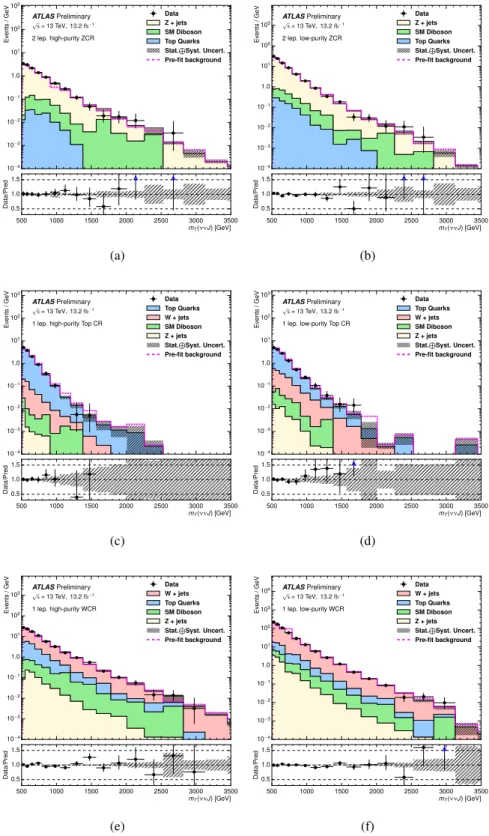
These control regions are included in the final likelihood fit to constrain the normalization of the major backgrounds, W +jets , Z +jets and t¯ t contribution, that are left free to float. The observable of interest in all control regions is the transverse mass built with the E
missT,no mu
and the leading large- R jet in analogy to
the transverse mass constructed in the signal region. The distributions in the control regions are shown in
Fig. 8.
10−4 10−3 10−2 10−1 1.0 101 102 103
Events/GeV ATLASPreliminary
√s= 13 TeV, 13.2fb−1 2 lep. high-purity ZCR
Data Z + jets SM Diboson Top Quarks Stat.LSyst. Uncert.
Pre-fit background
500 1000 1500 2000 2500 3000 3500
mT(ννJ) [GeV]
0.5 1.0 1.5
Data/Pred
(a)
10−4 10−3 10−2 10−1 1.0 101 102 103
Events/GeV ATLASPreliminary
√s= 13 TeV, 13.2fb−1 2 lep. low-purity ZCR
Data Z + jets SM Diboson Top Quarks Stat.LSyst. Uncert.
Pre-fit background
500 1000 1500 2000 2500 3000 3500
mT(ννJ) [GeV]
0.5 1.0 1.5
Data/Pred
(b)
10−4 10−3 10−2 10−1 1.0 101 102 103
Events/GeV ATLASPreliminary
√s= 13 TeV, 13.2fb−1 1 lep. high-purity Top CR
Data Top Quarks W + jets SM Diboson Z + jets Stat.LSyst. Uncert.
Pre-fit background
500 1000 1500 2000 2500 3000 3500
mT(ννJ) [GeV]
0.5 1.0 1.5
Data/Pred
(c)
10−4 10−3 10−2 10−1 1.0 101 102 103
Events/GeV ATLASPreliminary
√s= 13 TeV, 13.2fb−1 1 lep. low-purity Top CR
Data Top Quarks W + jets SM Diboson Z + jets Stat.LSyst. Uncert.
Pre-fit background
500 1000 1500 2000 2500 3000 3500
mT(ννJ) [GeV]
0.5 1.0 1.5
Data/Pred
(d)
10−4 10−3 10−2 10−1 1.0 101 102 103
Events/GeV ATLASPreliminary
√s= 13 TeV, 13.2fb−1 1 lep. high-purity WCR
Data W + jets Top Quarks SM Diboson Z + jets Stat.LSyst. Uncert.
Pre-fit background
500 1000 1500 2000 2500 3000 3500
mT(ννJ) [GeV]
0.5 1.0 1.5
Data/Pred
(e)
10−4 10−3 10−2 10−1 1.0 101 102 103 104
Events/GeV ATLASPreliminary
√s= 13 TeV, 13.2fb−1 1 lep. low-purity WCR
Data W + jets Top Quarks SM Diboson Z + jets Stat.LSyst. Uncert.
Pre-fit background
500 1000 1500 2000 2500 3000 3500
mT(ννJ) [GeV]
0.5 1.0 1.5
Data/Pred
(f)