ATLAS-CONF-2015-059 15December2015
ATLAS NOTE
ATLAS-CONF-2015-059
14th December 2015
Measurements of the Higgs boson production cross section at 7, 8 and 13 TeV centre-of-mass energies and search for new physics at
13 TeV in the H → Z Z ∗ → ` + ` − `
0+ `
0− final state with the ATLAS detector
The ATLAS Collaboration
Abstract
Preliminary results for Higgs boson production in pp collisions at a centre-of-mass energy of 13 TeV performed by the ATLAS Collaboration in the decay channel H → ZZ
∗→
`
+`
−`
0+`
0−, where `, `
0= e or µ, are presented. These results are based on an integrated luminosity of 3.2 fb
−1collected in 2015 by the ATLAS detector at the LHC. The fiducial cross section after the selection cuts is reported as well as the total cross section, compared to new and updated results obtained at centre-of-mass energies of 7 and 8 TeV, repectively.
Dark matter production in association with a Higgs boson decaying to H → ZZ
∗→ 4` is searched for in events with large missing transverse momentum. Moreover, a search for a heavy Higgs boson in the H → ZZ
∗→ 4` channel is performed for the mass range 200 to 1000 GeV assuming a narrow intrinsic width.
c
2015 CERN for the benefit of the ATLAS Collaboration.
Reproduction of this article or parts of it is allowed as specified in the CC-BY-3.0 license.
1. Introduction
The observation of a new particle in the search for the Standard Model (SM) Higgs boson by the ATLAS and CMS experiments [1, 2] with the data from LHC Run 1 taken during 2011 and 2012 has been an important step towards the clarification of the mechanism of the electroweak (EW) symmetry breaking [3–
5]. Further publications by the two experiments from LHC Run 1 have confirmed that the spin, parity and couplings of the new particle are consistent with those predicted for the SM Higgs boson [6–9].
The Higgs boson mass is not predicted by the SM, but once measured the production cross sections and branching ratios can be precisely calculated. The ATLAS and CMS collaborations have reported a combined measurement of the Higgs boson mass of m
H= 125.09 ± 0.21(stat) ±0.11(syst) [10].
The Higgs boson decay to four leptons, H → ZZ
∗→ 4`, where ` = e or µ, provides good sensitivity for the measurement of its properties due to its high signal-to-background ratio (S/B), which is about 2 for each of the four final states: µ
+µ
−µ
+µ
−(4µ), e
+e
−µ
+µ
−(2e2µ), µ
+µ
−e
+e
−(2µ2e), and e
+e
−e
+e
−(4e), where the first lepton pair is defined to be the one with the dilepton invariant mass closest to the Z boson mass. The largest background for this channel at the Higgs boson mass, and at higher mass when searching for an additional heavy Higgs boson, is due to continuum (Z
(∗)/γ
∗)(Z
(∗)/γ
∗) production, referred to as ZZ
∗hereafter. For the four-lepton events with an invariant mass m
4`below about 160 GeV there are also non-negligible background contributions from Z + jets and t¯ t production with two prompt leptons, where the additional charged lepton candidates arise from decays of hadrons with b- or c-quark content, from photon conversions or from misidentification of jets.
With the LHC Run 1 data, collected at centre-of-mass energies of √
s = 7 and 8 TeV, several meas- urements were performed in the H → ZZ
∗→ 4` channel: coupling and spin / CP measurements, cross section measurements and a search for an additional heavy Higgs boson [11–14]. The LHC Run 2 started in 2015 and provided collisions at √
s = 13 TeV. At this energy, the SM Higgs boson production cross section is expected to increase by about a factor of 2.3 relative to √
s = 8 TeV, a larger increase than for the ZZ
∗background, so that the signal to background ratio for this channel is supposed to improve.
This note presents preliminary ATLAS results for the H → ZZ
∗→ 4` decay mode using a data sample corresponding to an integrated luminosity of 3.2 fb
−1at √
s = 13 TeV. The results include measurements of the fiducial and total Higgs boson production cross sections and a search for an additional heavy Higgs boson in the mass window between 200 GeV and 1 TeV. In addition, a dark matter (DM) candidate search is performed where a pair of weakly interacting DM particles is posited, produced in association with a Higgs boson decaying into four leptons, referred to as the DM-Higgs search. The DM particles escape without detection leaving a characteristic signature of large missing transverse momentum of magnitude E
Tmiss. Finally, results for the fiducial and total cross sections are also provided for the √
s = 7 and 8 TeV data samples, where the former is a new measurement and the latter is an update of the previous measurement [13] to the new combined Higgs boson mass.
This note is organised as follows. The ATLAS detector is briefly described in Sec. 2, and the signal
and background simulation is presented in Sec. 3. The object reconstruction and identification, and the
event selection are presented in Sec. 4, and the background estimation in Sec. 5. The results of the event
selection are presented in Sec. 6, followed by the presentations of the cross section measurement, DM
search and heavy Higgs boson search in Secs. 7, 8, and 9, respectively.
2. The ATLAS Detector
The ATLAS detector [15] is a multipurpose particle detector with approximately forward-backward sym- metric cylindrical geometry.
1The inner tracking detector (ID) consists of a silicon pixel detector, which has an additional innermost layer (IBL) positioned at a radial distance of 3.3 cm from the beam line and installed since the end of Run 1 [16], and a silicon microstrip detector surrounding the pixel detector, both covering |η| < 2.5, followed by a transition radiation straw-tube tracker (TRT) covering |η| < 2. The ID is surrounded by a thin superconducting solenoid providing a 2 T axial magnetic field. A highly segmented lead/liquid-argon (LAr) sampling electromagnetic calorimeter measures the energy and the position of electromagnetic showers with |η| < 3.2. The LAr calorimeter includes a presampler (for |η| < 1.8) and three sampling layers, longitudinal in shower depth, for |η| < 2.5. LAr sampling calorimeters are also used to measure hadronic showers in the end-caps (1.5 < |η| < 3.2) and electromagnetic and hadronic showers in the forward (3.1 < |η| < 4.9) regions, while an iron / scintillator tile calorimeter measures hadronic showers in the central region (|η| < 1.7).
The muon spectrometer (MS) surrounds the calorimeters and is designed to detect muons in the pseu- dorapidity range up to |η| = 2.7. The MS consists of one barrel (|η| < 1.05) and two end-cap regions. A system of three large superconducting air-core toroid magnets, each with eight coils, provides a magnetic field with a bending integral of about 2.5 T·m in the barrel and up to 6 T·m in the end-caps. Monitored drift-tube chambers in both the barrel and end-cap regions and cathode strip chambers covering |η| > 2 are used as precision chambers, whereas resistive plate chambers in the barrel and thin gap chambers in the end-caps are used as trigger chambers, covering up to |η| = 2.4. The chambers are arranged in three layers, so particles with high transverse momentum traverse at least three stations with a lever arm of several meters.
A two-level trigger system selects events to be recorded for o ffl ine analysis.
1The ATLAS experiment uses a right-handed coordinate system with its origin at the nominal interaction point (IP) in the centre of the detector and thez-axis along the beam pipe. Thex-axis points from the IP to the centre of the LHC ring, and the y-axis points upward. Cylindrical coordinates (r, φ) are used in the transverse plane,φbeing the azimuthal angle around the beam pipe. The pseudorapidity is defined in terms of the polar angleθasη=−ln tan(θ/2).
3. Signal and Background Simulation
The H → ZZ
∗→ 4` signal is modelled using the POWHEG-BOX v2 Monte Carlo (MC) event gen- erator [17, 18], which calculates separately the gluon fusion (ggF) and vector-boson fusion (VBF) pro- duction mechanisms with matrix elements up to next-to-leading order (NLO). Parameters are tuned to adjust the Higgs boson transverse momentum (p
T) spectrum in the ggF process closely to the calculation in Ref. [19]. This calculation includes QCD corrections up to NLO and QCD soft-gluon resummations up to next-to-next-to-leading logarithm (NNLL). POWHEG-BOX is interfaced to PYTHIA 8 [20] for showering and hadronization, which in turn is interfaced to E vt G en v1.2.0 [21] for the simulation of b and c-hadron decays. PHOTOS ++ version 3.52 [22] is used for QED emissions from electroweak vertices and charged leptons. PYTHIA 8 is used to simulate the production of a Higgs boson in asso- ciation with a W or a Z boson. The production of a Higgs boson in association with a top quark pair is simulated using M ad G raph 5_ a MC@NLO [23] and is interfaced to H erwig++ [24] for showering and hadronization.
The Higgs boson production cross sections and decay branching ratios, as well as their uncertainties, are taken from Refs. [25–27]. The cross sections for the ggF process have been calculated to NLO [28–30]
and next-to-next-to-leading order (NNLO) [31–33] in QCD. In addition, NNLL soft-gluon resummation is applied for the ggF process [34]. NLO EW radiative corrections are also applied [35, 36]. These results are compiled in Refs. [37–39] assuming factorisation between QCD and EW corrections.
The cross sections for the VBF process are calculated with full NLO QCD and EW corrections [40–42], and approximate NNLO QCD corrections [43]. The cross sections for the associated W H/ZH production processes are calculated at NLO [44] and at NNLO [45] in QCD, and NLO EW radiative corrections [46]
are applied. The small contribution from the associated productions with a t¯ t pair (denoted t¯ tH) and a b b ¯ pair (b bH ¯ ) are also taken into account. The cross sections for the t¯ tH process are calculated up to NLO QCD [47–50]. The cross sections for the b bH ¯ process computed using the Santander matching between the five-flavour (NNLO) and four-flavour (NLO) schemes [51].
The Higgs boson decay branching ratio [52] to the four-lepton final state is predicted by prophecy 4 f [53, 54], which includes the complete NLO QCD + EW corrections, the interference e ff ects between identical final-state fermions, and the leading two-loop heavy Higgs boson corrections to the four-fermion width.
Table 1 summarises the production cross sections and branching ratios for H → ZZ
∗→ 4` at 13 TeV.
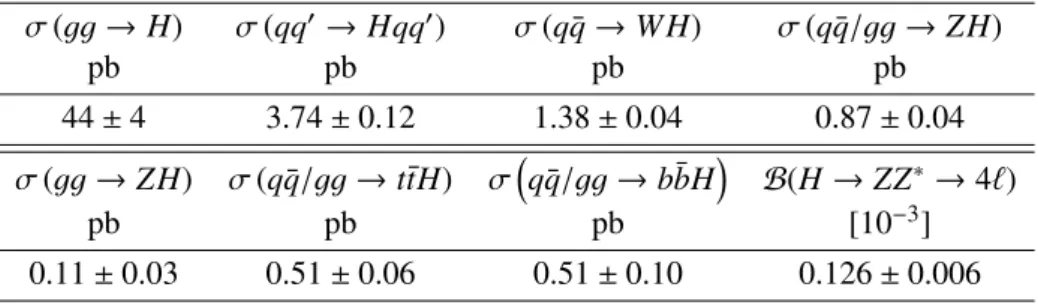
Table 1: Predicted SM Higgs boson production cross sections (σ) for ggF, VBF and associated production with aW or Z boson or with abb¯ or tt¯pair in ppcollisions formH = 125.09 GeV at √
s = 13 TeV [25–27]. The quoted uncertainties correspond to the total theoretical systematic uncertainties calculated by adding in quadrature the QCD scale and PDF+αsuncertainties. The decay branching ratio (B) with full uncertainty forH→ZZ∗→4`
with`=e, µ, is given in the last column.
σ (gg → H) σ (qq
0→ Hqq
0) σ (q q ¯ → W H) σ (q q/gg ¯ → ZH)
pb pb pb pb
44 ± 4 3.74 ± 0.12 1.38 ± 0.04 0.87 ± 0.04
σ (gg → ZH) σ (q q/gg ¯ → t¯ tH) σ
q q/gg ¯ → b bH ¯
B (H → ZZ
∗→ 4`)
pb pb pb [10
−3]
0.11 ± 0.03 0.51 ± 0.06 0.51 ± 0.10 0.126 ± 0.006
The ZZ
∗continuum background is modelled using POWHEG-BOX v2 for quark-antiquark annihilation and Sherpa 2.1.1 [55] for ggF including the off-shell Higgs boson signal and their interference for high m
ZZ∗. For low m
ZZ∗gg 2VV [56] has been used. The quark-antiquark annihilation and the low m
ZZ∗ggF are interfaced to PYTHIA 8 for parton shower and hadronization, and to E vt G en v1.2.0. For the quark-antiquark annihilation the CT10nlo [57] set is used as Parton Density Function (PDF) of the hard- processing while the CTEQL1 PDF set is used for the parton shower. The non–perturbative e ff ects are modelled using the AZNLO [58] tune. For the ggF the CT10 PDF set is used. NNLO QCD and NLO EW corrections are used for the quark-initiated ZZ
∗[59] and NLO QCD corrections for ggF [60]. The uncer- tainty on the expected ZZ
∗background, evaluated by varying the QCD normalisation and factorisation scales, varies with m
ZZ∗, from ±3 to ±5%. The e ff ect of the uncertainty on the PDF and α
svaries between
±2 and ±5% and is estimated using the envelop of 52 eigenvectors of CT10nlo, and two additional PDF sets, MSTW2008 nlo 68 cl [61] and NNPDF3.0 [62].
Events containing Z bosons with associated jets are simulated using the Sherpa 2.1.1 generator. Mat- rix elements are calculated for up to 2 partons at NLO and 4 partons at LO using the C omix [63] and O pen L oops [64] matrix element generators and merged with the S herpa parton shower [65] using the ME+PS@NLO prescription [66]. The CT10 PDF set is used in conjunction with dedicated parton shower tuning developed by the S herpa authors. The Z + jets events are normalised to the NNLO cross sections.
The t¯ t background is modelled using POWHEG-BOX v1 interfaced to PYTHIA 6 [67] for parton shower and hadronization, to PHOTOS [68] for QED radiative corrections, to Tauola [69, 70] for the simulation of τ lepton decays and to E vt G en v1.2.0.
The WZ background is modelled using POWHEG-BOX v2 interfaced to PYTHIA 8 and E vt G en v1.2.0, and to PHOTOS++ version 3.52 for QED radiative corrections. The triboson backgrounds ZZZ, WZZ, and WWZ with four or more genuine leptons are modelled using S herpa 2.1.1. For the all-leptonic t¯ t + Z background M ad G raph+ PYTHIA 8 is used.
For the DM-Higgs analysis, samples for the simplified models described in Sec. 8 are simulated at leading order in QCD with M ad G raph interfaced to PYTHIA 8 and E vt G en v1.2.0. The coupling parameters of the models have been chosen to maximise the production cross section.
Generated events are processed through the ATLAS detector simulation [71] within the G eant 4 frame-
work [72]. Additional pp interactions in the same and nearby bunch crossings (pileup) are included in
the simulation. The simulation samples are weighted to reproduce the observed distribution of the mean
number of interactions per bunch crossing in the data.
4. Object reconstruction and identification, and event selection
The objects reconstruction, their identification and the event selection follow closely those used in Run 1 [11] and are summarised below.
4.1. Object reconstruction and identification
Electrons are reconstructed using information from the ID and the electromagnetic calorimeter [73]. Elec- tron candidates are clusters of energy associated with ID tracks, where the final track-cluster matching is performed after the tracks have been fitted with a Gaussian-sum filter [74]. For electrons, background discrimination relies on the shower shape information available from the highly segmented calorimeter, high-threshold TRT hits, as well as compatibility of the tracking and calorimeter information. This in- formation is combined into a likelihood discriminant. Requirements on the hits in the silicon detectors, including a hit in the IBL, are added. For Run 2, the impact parameter in the transverse plane and its significance (|d
0|, and |d
0|/σ
d0) have been added to the likelihood discriminant, improving the sup- pression of heavy flavour background contributions. A “loose” likelihood selection is applied, which maintains a high efficiency and sufficient background suppression [74]. The electron transverse energy E
Tis computed from the cluster energy and the track direction at the interaction point. The cluster energy corrections and calibration are described elsewhere [75]. For the current measurement, the combined fit of the cluster E
Tand the track p
T, which was used in Run 1, is not applied.
Muons are reconstructed as tracks in the ID and MS, and their identification is primarily based on the presence of a matching track or tag in the MS [76]. If a complete MS track is present, the two independent momentum measurements are combined (combined muons), otherwise the momentum is measured using the ID, and the partial MS track serves as identification (segment-tagged muons). The segment-tagged muons are limited in Run 2 to the centre of the barrel region (|η| < 0.1) which lacks MS geometrical coverage. Furthermore in this central region, an ID track with p
T> 15 GeV is identified as a muon if its calorimetric energy deposition is consistent with a minimum ionising particle (calorimeter-tagged muons). The muon reconstruction and identification coverage is extended by using tracks reconstructed in the forward region (2.5 < |η| < 2.7) of the MS, which is outside the ID coverage (standalone muons).
The ID tracks associated with muons that are identified inside the ID acceptance are required to have a minimum number of associated hits in each of the ID subdetectors to ensure good track reconstruction.
The muon candidates outside the ID acceptance that are reconstructed only in the MS are required to have hits in each of the three MS stations they traverse. At most one standalone or calorimeter-tagged muon is used per event.
The QED process of radiative photon production in Z boson decays is well modelled by simulation.
Some of the Final State Radiation (FSR) photons can be identified in the calorimeter and incorporated into the four-lepton measurement. The same method to include the FSR photons in the reconstruction of Z bosons as for Run 1 has been applied [77]. This method includes a search for collinear (for muons) and noncollinear FSR photons (for both muons and electrons) with only one FSR photon allowed per event.
Jets are reconstructed from clusters of calorimeter cells using the anti-k
Talgorithm [78, 79] with a dis-
tance parameter R = 0.4. The algorithm for the clustering suppresses noise and pileup by keeping only
cells with a significant energy deposit and their neighbouring cells. The jets are calibrated using a ded-
icated scheme designed to adjust, on average, the energy measured in the calorimeter to that of the true
jet energy. To reduce the number of jet candidates originating from pileup vertices, jets within the ID
acceptance (|η| < 2.4) have requirements applied to the fraction of tracks which come from the primary vertex [80].
Di ff erent objects can be reconstructed from the same detector information, requiring an overlap ambiguity to be resolved. For an electron and a muon which share the same ID track, the muon is selected except for a calorimeter-tagged muon which does not have a MS track or tag in which case the electron is selected.
The reconstructed jets which overlap with electrons are removed.
Finally, E
Tmissis reconstructed from the selected electrons, muons and jets and a soft term using tracks (TST) [81]. The TST consists of all tracks coming from the primary vertex excluding those belonging to the reconstructed objects. The TST only includes tracks within the geometrical acceptance of the inner detector tracking volume and misses neutral particles, but it allows to remove contributions from additional interactions in the event.
4.2. Event selection
The data are subjected to quality requirements: if any relevant detector component is not operating cor- rectly during a period in which an event is recorded, the event is rejected. Events are required to have at least one vertex with two associated tracks with p
T> 400 MeV, and the primary vertex is chosen to be the reconstructed vertex with the largest track P
p
2T. Identical requirements are applied to all four-lepton final states. Four-lepton events are selected and classified according to their final state: 4µ, 2e2µ, 2µ2e, 4e.
Four-lepton events were selected with single-lepton, dilepton and trilepton triggers. A “loose” (mul- tilepton triggers) or “medium” (single-electron trigger) likelihood identification was applied to the elec- trons, and isolation requirements were applied only to the single-muon trigger. The p
T(E
T) thresholds for single-muon (single-electron) triggers were 20 GeV (24 GeV). The dilepton trigger thresholds were set at 10 and (8, 18) GeV p
Tfor muons, 12 GeV E
Tfor electrons and (8, 24), (24, 7) and (10, 12) GeV for (muon, electron) mixed-flavour pairs. The trilepton triggers thresholds were set at 6 and (4, 4, 18) GeV for the trimuon trigger, at (9, 9, 17) GeV for the trielectron trigger, and at (10, 12) GeV for (muon,electron) for the two possible mixed-flavour trilepton triggers. The trigger efficiency for events passing the final selection is above 99% for all channels.
Higgs boson candidates are formed by selecting two same-flavour, opposite-sign lepton pairs (a lepton quadruplet) in an event. Each lepton is required to have a projected longitudinal impact parameter (| ∆ z
0· sin(θ)|) less than 0.5 mm with respect to the primary vertex, and muons are required to have a transverse impact parameter of less than 1 mm to reject cosmic-ray muons. These requirements are not applied to standalone muons, which have no ID track. Each electron (muon) must satisfy E
T> 7 GeV (p
T> 6 GeV) and be measured in the pseudorapidity range |η| < 2.47 (|η| < 2.7). The highest- p
Tlepton in the quadruplet must satisfy p
T> 20 GeV, and the second (third) lepton in p
Torder must satisfy p
T> 15 GeV (p
T> 10 GeV).
Multiple quadruplets within a single event are possible: for four muons or four electrons there are two ways to pair the masses, and for five or more leptons there are multiple ways to choose the leptons.
Quadruplet selection is done separately in each subchannel: 4µ, 2e2µ, 2µ2e, 4e, keeping only a single
quadruplet per channel. For each channel, the lepton pair with the mass closest to the Z boson mass
is referred to as the leading dilepton and its invariant mass m
12is required to be between 50 GeV and
106 GeV. The second, subleading, pair of each channel is chosen from the remaining leptons as the pair
closest in mass to the Z boson and in the range m
min< m
34< 115 GeV, where m
minis 12 GeV for m
4`<
140 GeV, rises linearly to 50 GeV at m
4`= 190 GeV and then remains at 50 GeV for m
4`> 190 GeV.
Finally, if more than one channel has a quadruplet passing the selection, the channel with the highest expected signal rate is kept, i.e. in the order: 4µ, 2e2µ, 2µ2e, 4e. The rate of two quadruplets in one event is below the per mille level, as estimated from simulation.
Events with a selected quadruplet are required to have their leptons at a distance
2∆ R > 0.1 from each other if they are of the same flavour and ∆ R > 0.2 otherwise. For 4µ and 4e events, if an opposite-charge same-flavour lepton pair is found with m
``below 5 GeV, the event is removed.
The Z + jets and t¯ t background contributions are further reduced by applying impact parameter require- ments as well as track- and calorimeter-based isolation requirements to the leptons. The transverse impact parameter significance, defined as the impact parameter in the transverse plane divided by its uncertainty,
|d
0|/σ
d0, for all muons (electrons) is required to be lower than 3 (5). The normalised track isolation dis- criminant, defined as the sum of the transverse momenta of tracks, inside a cone of size ∆ R = 0.3 (0.2) around the muon (electron) candidate excluding the lepton track, divided by the lepton p
T, is required to be smaller than 0.15. The larger muon cone size corresponds to that used in the muon trigger. Contribu- tions from pileup are suppressed by requiring tracks in the cone to originate from the primary vertex. To retain efficiency at higher p
T, the track isolation cone size is reduced to 10 GeV/ p
Tabove 33 (50) GeV.
The relative calorimetric isolation is computed as the sum of the cluster transverse energies E
T, in the electromagnetic and hadronic calorimeters, with a reconstructed barycentre inside a cone of size ∆ R = 0.2 around the candidate lepton, divided by the lepton p
T. The clusters used for the isolation are the same as those for reconstructing jets. The relative calorimetric isolation is required to be smaller than 0.3 (0.2) for muons (electrons). The measured calorimeter energy around the muon and the cells within 0.125 × 0.175 in η × φ around the electron barycentre are excluded from the respective sums. The pileup and underlying event contribution to the calorimeter isolation is subtracted event by event [82]. For both the track- and calorimeter-based isolation requirements any contributions arising from other leptons of the quadruplet are subtracted.
A search is performed for FSR photons arising from any of the lepton candidates in the final quadruplet, and at most one FSR photon candidate is added to the 4` system. Priority is given to the search for collinear photons close to muons of the leading dilepton, and the correction is applied if 66 < m
µµ< 89 GeV and m
µµγ< 100 GeV. If the collinear-photon search fails then the noncollinear FSR photon with the highest E
Tis added to the leading pair for m
4`< 190 GeV, or to either pair for m
4`> 190 GeV, provided it satisfies the following requirements: m
``< 81 GeV and m
``γ< 100 GeV. The expected fraction of collinear (noncollinear) corrected events is 4% (1%).
After the FSR correction, the lepton four-momenta of the leading dilepton are recomputed by means of a Z-mass-constrained kinematic fit. The fit uses a Breit-Wigner Z line shape and a single Gaussian to model the lepton momentum response function with the Gaussian σ set to the expected resolution for each lepton. The Z-mass constraint improves the m
4`resolution by about 15%.
Events satisfying the above criteria are considered candidate signal events for the analysis, defining a signal region independent of the value of m
4`. The Higgs boson mass resolution is dependent on the final state and corresponds to 1.6 GeV, 1.7 GeV, 2.1 GeVand 2.4 GeV for 4µ, 2e2µ, 2µ2e and 4e at m
H= 125 GeV, respectively.
2∆R≡p
∆η2+ ∆φ2
5. Backgrounds
The main background component in the H → ZZ
∗→ 4` channel for all mass regions is the non-resonant ZZ
∗diboson production resulting in a final state of isolated leptons, as for the signal. Simulation is used for the prediction of this process while its rate is normalised to the SM cross section, as described in Sec.
3. The normalisation is checked in the phase space outside the signal region (sidebands) considered for the SM Higgs boson analysis, defined by m
4`< 110 GeV and m
4`> 140 GeV.
Smaller but non-negligible background contributions come from the Z +jets and t¯ t processes, referred to as reducible background hereafter. Their normalisation is extracted by data-driven methods in the full mass region and their composition depends on the flavour of the subleading dilepton pair. In the following, the methods used for the `` + µµ and `` + ee background determination are described. The results are summarised in Table 4. A smaller component from WZ production is included in the data-driven results for the `` + ee final states, while it is added from simulation for the `` + µµ ones. Contributions from t¯ tV and triboson processes are taken from simulation.
5.1. `` + µµ background
The `` + µµ background arises from semi-leptonic decays of heavy-flavour hadrons in the t¯ t and Z + heavy flavour quarks processes, and from π/K decays in-flight coming from Z + light-flavour quarks production.
Control Regions (CRs) enriched in specific components are used in combination with the shape of the leading dilepton invariant mass m
12to discriminate between the di ff erent background sources.
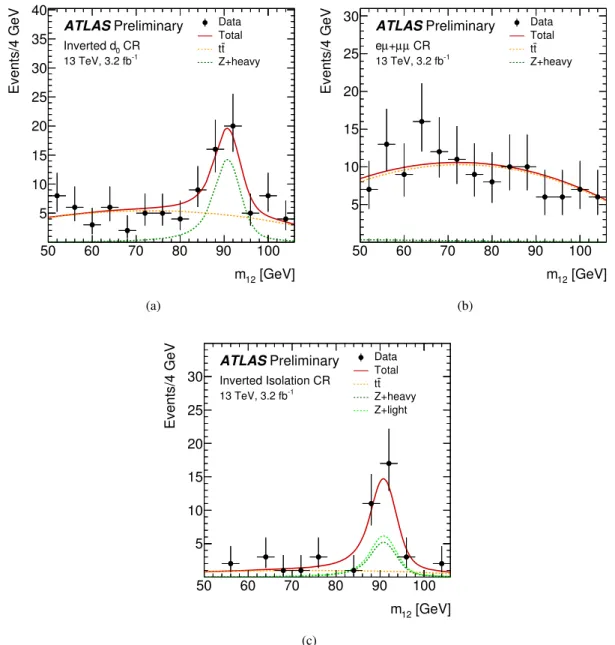
In the first step, an unbinned maximum-likelihood fit is performed in two CRs to determine the norm- alisation of the heavy-flavour background. These CRs are constructed to be orthogonal to each other but also to the signal region. The first CR (denoted inverted-d0 CR) has analogous requirements as the signal selection except for the isolation criteria on the subleading dimuon pair which are not applied.
In addition, the transverse impact parameter significance requirement is inverted. This CR is therefore enhanced in leptons from displaced vertices such as heavy-flavour hadron decays. The second CR (de- noted eµ + µµ CR) selects events with a different-flavour leading dilepton pair that passes the analysis requirements accompanied by a subleading dimuon pair with the isolation, transverse impact parameter and charge selections not applied. This CR is enriched in the t¯ t process.
The discriminant used in the fit is m
12described by a resonant distribution for the Z +jets (Breit-Wigner convoluted with a Crystal Ball) and a non-resonant continuum for t¯ t (second-order Chebychev polyno- mial). The small contributions from the ZZ
∗and WZ processes are included in the fit and described using simulation.
The fit results are expressed in terms of the yields in a reference control region defined by applying the analysis event selection except for the isolation and impact parameter significance requirements to the subleading dimuon pair. The uncertainties on the relative yields between the two fitted CRs and the reference one are introduced in the fit as nuisance parameters. The result of the simultaneous fit is shown in Figure 1(a) and Figure 1(b). In Table 2 the results of the simultaneous fit are given. The reference control region is also used for the validation of the estimates given its higher statistics as can be seen in Figure 3(a).
The fit results are extrapolated to the signal region (SR) using factors that correspond to the probability of
satisfying the isolation and impact parameter significance criteria of the analysis, estimated by the relevant
[GeV]
m12
50 60 70 80 90 100
Events/4 GeV
5 10 15 20 25 30 35 40
Data Total
t t Z+heavy
ATLASPreliminary
0 CR Inverted d 13 TeV, 3.2 fb-1
(a)
[GeV]
m12
50 60 70 80 90 100
Events/4 GeV
5 10 15 20 25
30 Data
Total t t Z+heavy
ATLASPreliminary CR
µ +µ eµ
13 TeV, 3.2 fb-1
(b)
[GeV]
m12
50 60 70 80 90 100
Events/4 GeV
5 10 15 20 25 30
Data Total
t t Z+heavy Z+light
ATLASPreliminary Inverted Isolation CR 13 TeV, 3.2 fb-1
(c)
Figure 1: Distributions ofm12for data in the three CRs used for the``+µµbackground estimate. The result of the simultaneous fit to the data (continuous line) for the inverted impact parameter significance (inverted-d0) and the eµ+µµCRs is shown in(a)and(b). The fit to data of the inverted-isolation CR is shown in(c). The dashed lines correspond to theZ+jets (green) andt¯t(yellow) components of the fit, where for(c)theZ+light jets has been fit with theZ+heavy yield scaled to the result of the simultaneous fit of the other two CRs.
simulation sample. The extrapolation factors are given in Table 2 together with their uncertainties derived from the simulation samples sizes. These simulation-based efficiencies are validated with data using muons accompanying Z candidates. Based on the data-simulation agreement in this Z + µ control sample, an additional systematic uncertainty of 30% is added.
The Z + light-flavour component is determined in a second step by fitting the m
12distribution in a third
CR (denoted inverted isolation CR). The analysis selection is applied to the leading dilepton pair while
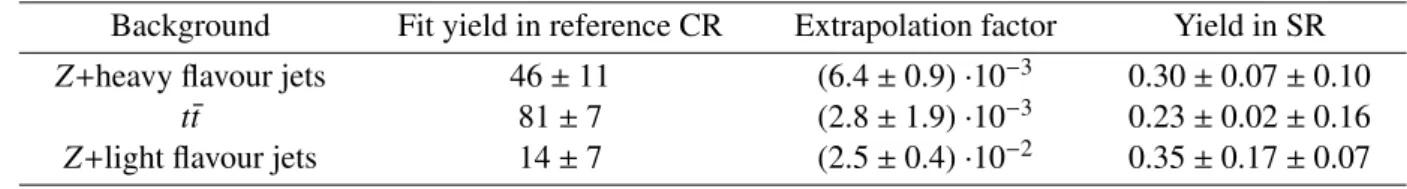
Table 2: Results of the fits to data for the``+µµfinal states in the three control regions for theZ+heavy flavour, tt¯andZ+light backgrounds as yields in the reference control region. The corresponding extrapolation factors and signal region yields are given. The uncertainties on the fit yields are statistical. Those on the extrapolation factors are derived from the simulation sample size and contribute to the systematic uncertainty on the SR yields. The statistical and systematic uncertainties are given for the extrapolated SR yields.
Background Fit yield in reference CR Extrapolation factor Yield in SR Z + heavy flavour jets 46 ± 11 (6.4 ± 0.9) ·10
−30.30 ± 0.07 ± 0.10
t¯ t 81 ± 7 (2.8 ± 1.9) ·10
−30.23 ± 0.02 ± 0.16
Z + light flavour jets 14 ± 7 (2.5 ± 0.4) ·10
−20.35 ± 0.17 ± 0.07
the isolation is inverted for at least one of the subleading muons which must both satisfy the impact parameter significance requirement. This selection enriches the sample with muons from π/K decays in-flight. The amount of the Z + heavy-flavour and t¯ t components is constrained, within the uncertainties, to the result of the previous (simultaneous) fit while ZZ
∗and WZ are estimated from simulation. The fit yield, presented in Table 2, is extrapolated to the signal region based on the probability of the events to satisfy the isolation requirements. The extrapolation e ffi ciency evaluated for heavy-flavour decays is used due to the higher simulation statistics available, and given the fact that the isolation efficiency is at the same level for these two components as measured in other enriched control regions. An uncertainty of 10% is applied to account for di ff erences in the extrapolation e ffi ciencies of the two components, derived from data-simulation comparisons with the Z + µ control sample.
The resulting `` + µµ background estimate in the signal region for the di ff erent components described above is given in Table 2, and the total estimate including WZ is summarised in Table 4. These results have been cross checked with a simultaneous fit in the three fit CRs mentioned above. The yields extracted in the reference CR are then extrapolated to the signal region using simulation, where the Z + light- and Z + heavy-flavour components have a combined extrapolation factor.
5.2. `` + ee background
The `` + ee background arises from misidentification of light-flavour jets as electrons ( f ), photon con- versions (γ), and semi-leptonic decays of heavy flavour hadrons (q). The unfolding of data into these components is performed using observables based on the IBL and the number of high-threshold hits in the TRT detector.
To obtain a control region enriched in the di ff erent background components, quadruplets are formed with three leptons satisfying the analysis selection and a fourth lepton which is an electron candidate with relaxed requirements: a track with a minimum number of silicon hits which matches a calorimeter energy cluster while the electron identification, the isolation and the impact parameter significance criteria are not applied. Only quadruplets with the fourth lepton being the lowest-p
Tone are retained. In addition, the subleading electron pair is required to have the same charge to suppress the contribution from ZZ
∗. This CR is referred to as 3` + X, hereafter.
By requiring only a single electron with relaxed selection, the composition of the control region is sim-
plified and the yields of the di ff erent background components can be extracted with a two-dimensional
fit. Two observables, the number of hits in the IBL (n
IBLhits) and the TRT electron probability based on the
nBL
0.5
− 0 0.5 1 1.5 2 2.5 3 3.5
Events
2
10− 1
10−
1 10 102
103
104 Data
Fit f (light jets)
(photons) γ
q (heavy flavour)
ATLASPreliminary + ee
µ ee/µ
13 TeV, 3.2 fb-1
(a)
TRT
pe
0 0.2 0.4 0.6 0.8 1
Events
2
10− 1
10−
1 10 102
103
Data Fit f (light jets)
(photons) γ
q (heavy flavour)
ATLASPreliminary + ee
µ ee/µ
13 TeV, 3.2 fb-1
(b)
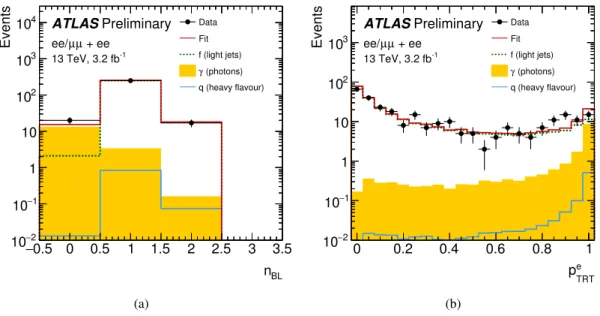
Figure 2: The results of a simultaneous fit to(a)nIBLhits, the number of hits in the innermost pixel layer, and(b)pHTTRT, the electron probability based on the number of high-threshold TRT hits, for the background components in the 3`+Xcontrol region. The sources of background electrons are denoted as: light-flavour jets faking an electron (f, green dashed histogram), photon conversions (γ, yellow filled histogram) and electrons from heavy-flavour quark semileptonic decays (q, blue histogram). The total background is given by the solid red histogram.
number of high-threshold hits
3(p
HTTRT) allow to statistically separate the f , γ and q components. Most photons convert after the IBL, and hadrons faking electrons have a lower p
HTTRTcompared to conversions and heavy-flavour electrons.
The two-dimensional fit is performed using templates for the different components. These templates are taken from simulation using Z + X events, where X is an electron candidate satisfying the selection described for X above. The templates are corrected to data in Z + X control samples with adjusted selections to enrich for each specific component. The small heavy-flavour component is constrained in the fit to expectation, imposing a 30% uncertainty. The contribution of ZZ
∗, concerning mainly f , is fixed according to expectation. The results of the fit are shown in Figure 2 for the `` + ee channels combined while the yields are quoted in Table 3.
To extrapolate the f , γ and q components from the 3` + X control region to the signal region, the e ffi ciency for the different components to satisfy all selection criteria obtained from the Z + X simulation is used.
Since the e ffi ciency is dependent on the p
Tof the lepton, the sPlot method [83] is used to subtract the p
Tspectrum from backgrounds.
The simulation efficiency for each component is corrected to data using the enriched Z + X control samples.
For the f component, the simulation e ffi ciency is corrected by a factor of 1.8 for a lepton p
Tup to 15 GeV, while it raises to 3.4 for higher p
T. The simulation is found to model the efficiency of the γ component, to within approximately 25% for p
Tsmaller than 15 while it is corrected with a factor of 2.7 for higher p
T. For the q component, the e ffi ciency is found to be well modelled by simulation, but there is an additional
3A large number of hits above a high signal pulse-height threshold is an indication of the presence of transition radiation, which is more probable for electrons than for pions.
Table 3: The fit results to data for the 3`+X control region, the extrapolation factors and the signal region yields for the reducible``+eebackground. The uncertainties on the fit yields are statistical and those on the extrapolation factors are systematic. The statistical and systematic uncertainties are given for the SR yields. For theqcomponent, the uncertainty is coming from the simulation statistics and is therefore accounted as systematic uncertainty in the estimate.
Type Fit yield in CR Extrapolation factor Yield in SR f 268 ± 17 (2.7 ± 1.0) ·10
−30.74 ± 0.05 ± 0.27
γ 17 ± 5 (8.0 ± 2.1) ·10
−30.15 ± 0.05 ± 0.04
q 0.97 ± 0.24 (30.9 ± 7.8) ·10
−20.30 ± 0.12
correction, obtained from simulation, to estimate the number of background opposite-sign (OS) events from the number of same-sign (SS) events, which is OS / SS ≈ 1.7.
The extrapolation efficiency and signal yields are also given in Table 3. The systematic uncertainty, which is dominated by the simulation efficiency corrections, corresponds to 37%, 26% and 40% for f, γ, q, respectively. The ratio of the number of high-threshold to low-threshold TRT hits (r
TRT) is used as an alternative discriminant. The difference in the background estimate has been assigned as additional systematic uncertainty and corresponds to 14% and 0.5% for the conversions and light jets components, accordingly. The method is also performed using the templates without corrections, which result in a systematic uncertainty of 2%. The final results for the total `` + ee reducible background are summarised in Table 4.
5.3. Summary of the reducible background estimates
The final background estimates in the full mass range are summarised in Table 4.
The shapes of the m
4`distributions of the reducible background are taken from simulation. Systematic variations of the shape are derived by tightening and relaxing the isolation and impact parameter selection criteria.
Table 4: Summary of the reducible background contamination in the SR for the fullm4` mass range. The uncer- tainties are split into statistical and systematic origins. The backgrounds are shown according to the flavour of the subleading pair, and are the combined background for two final states in each case.
Final state Background component Estimate in full mass range
`` + µµ
Z + jets 0.65 ± 0.18(stat) ± 0.12(syst) t¯ t 0.23 ± 0.02(stat) ± 0.16(syst)
WZ 0.08 ± 0.02
`` + ee Z + jets, t¯ t and WZ 1.19 ± 0.10(stat) ± 0.27(syst)
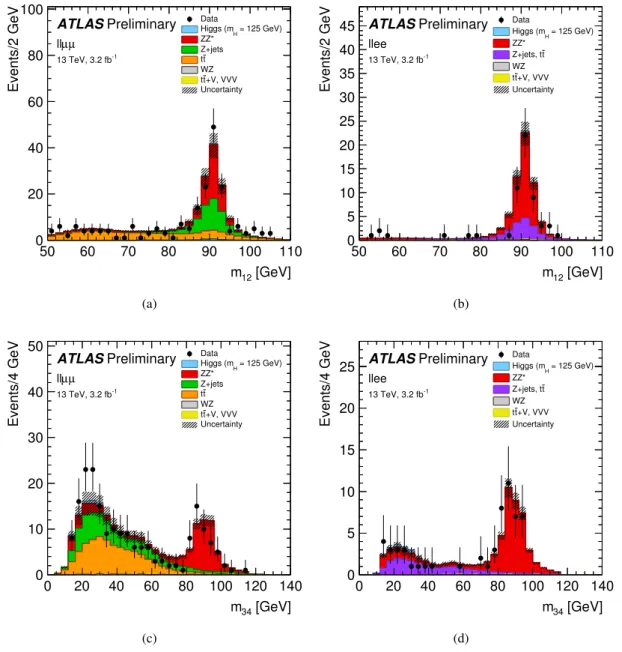
To validate the normalisation extracted by the data-driven methods, a control sample defined by a Z boson candidate and an additional same-flavour opposite-sign lepton pair where the isolation and transverse impact parameter requirements are not applied, is used. The invariant mass distributions of the lepton pairs in this control sample for the √
s = 13 TeV dataset is shown in Figure 3. The reducible backgrounds
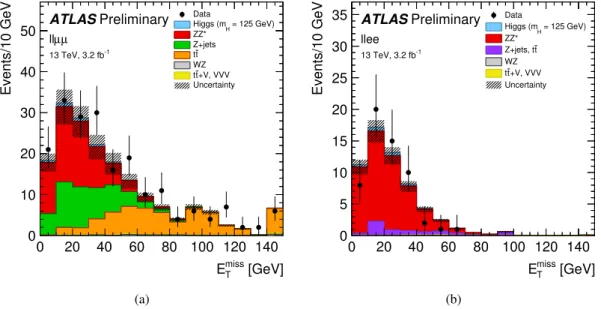
are normalised to the results from the data-driven methods with their shapes taken from simulation. The missing transverse energy distributions for this control sample are correspondingly shown in Figure 4.
[GeV]
m12
50 60 70 80 90 100 110
Events/2 GeV
0 20 40 60 80
100 Data
= 125 GeV) Higgs (mH
ZZ*
Z+jets t t WZ
+V, VVV t t Uncertainty
µ llµ
13 TeV, 3.2 fb-1
ATLASPreliminary
(a)
[GeV]
m12
50 60 70 80 90 100 110
Events/2 GeV
0 5 10 15 20 25 30 35 40
45 Data = 125 GeV)
Higgs (mH
ZZ*
t Z+jets, t WZ
+V, VVV t t Uncertainty
llee
13 TeV, 3.2 fb-1
ATLASPreliminary
(b)
[GeV]
m34
0 20 40 60 80 100 120 140
Events/4 GeV
0 10 20 30 40
50 Data
= 125 GeV) Higgs (mH
ZZ*
Z+jets t t WZ
+V, VVV t t Uncertainty
µ llµ
13 TeV, 3.2 fb-1
ATLASPreliminary
(c)
[GeV]
m34
0 20 40 60 80 100 120 140
Events/4 GeV
0 5 10 15 20 25
Data
= 125 GeV) Higgs (mH
ZZ*
t Z+jets, t WZ
+V, VVV t t Uncertainty
llee
13 TeV, 3.2 fb-1
ATLASPreliminary
(d)
Figure 3: Invariant mass distributions of the lepton pairs in the control sample defined by aZboson candidate and an additional same-flavour lepton pair, for the √
s=13 TeV dataset. The sample is divided according to the flavour of the additional lepton pair. In(a), them12and in(c), them34 distributions are shown for``(µ+µ−/e+e−)+µ+µ− events. In(b), them12and in(d), them34distributions are shown for``(µ+µ−/e+e−)+e+e−events. The kinematic selection requirements of the analysis are applied. Isolation and impact parameter significance requirements are applied to the first lepton pair only. Each component of the simulation is normalised to its data driven background estimation.
[GeV]
miss
ET
0 20 40 60 80 100 120 140
Events/10 GeV
0 10 20 30 40 50
Data
= 125 GeV) Higgs (mH
ZZ*
Z+jets t t WZ
+V, VVV t t Uncertainty
µ llµ
13 TeV, 3.2 fb-1
ATLASPreliminary
(a)
[GeV]
miss
ET
0 20 40 60 80 100 120 140
Events/10 GeV
0 5 10 15 20 25 30
35 Data
= 125 GeV) Higgs (mH
ZZ*
t Z+jets, t WZ
+V, VVV t t Uncertainty
llee
13 TeV, 3.2 fb-1
ATLASPreliminary
(b)
Figure 4: The missing transverse energy distributions in the control sample defined by aZ boson candidate and an additional same-flavour lepton pair for the √
s =13 TeV data sample. The sample is divided according to the flavour of the additional lepton pair. In(a), them4ldistributions is shown for``(µ+µ−/e+e−)+µ+µ−events. In(b), them4ldistributions is shown for``(µ+µ−/e+e−)+e+e−events. Isolation requirements are applied to the first lepton pair only. Each component of the simulation is normalised to its data driven background estimation. The last bin contains the integral of the overflow.
6. Results of the event selection
The number of observed candidate events for each of the four decay channels in the mass window 118–
129 GeV and the signal and background expectations are presented in Table 5. The signal and ZZ
∗background contributions are normalised to the SM expectation while the reducible backgrounds are normalised to the data-driven estimates described in Sec. 5. The uncertainties are combined linearly for the signal and the ZZ
∗/ t¯ tV / VVV background. For the reducible background the uncertainties are added linearly for the two channels with same-flavor subleading leptons and quadratically for the total reducible background.
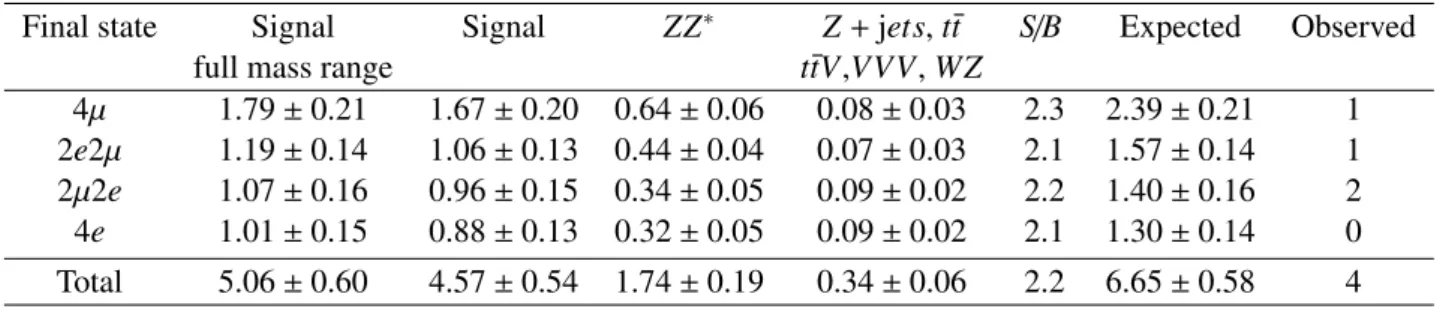
Table 5: The number of events expected and observed for amH=125 GeV hypothesis for the four-lepton final states.
The second column gives the expected signal for the full mass range. The other columns give for the 118–129 GeV mass range the number of expected signal events, the number of expectedZZ∗ and other background events, and the signal-to-background ratio (S/B), together with the number of observed events, for 3.2 fb−1 at √
s =13 TeV.
Full uncertainties are provided.
Final state Signal Signal ZZ
∗Z + jets, t¯ t S / B Expected Observed
full mass range t¯ tV,VVV, WZ
4µ 1.79 ± 0.21 1.67 ± 0.20 0.64 ± 0.06 0.08 ± 0.03 2.3 2.39 ± 0.21 1 2e2µ 1.19 ± 0.14 1.06 ± 0.13 0.44 ± 0.04 0.07 ± 0.03 2.1 1.57 ± 0.14 1 2µ2e 1.07 ± 0.16 0.96 ± 0.15 0.34 ± 0.05 0.09 ± 0.02 2.2 1.40 ± 0.16 2 4e 1.01 ± 0.15 0.88 ± 0.13 0.32 ± 0.05 0.09 ± 0.02 2.1 1.30 ± 0.14 0 Total 5.06 ± 0.60 4.57 ± 0.54 1.74 ± 0.19 0.34 ± 0.06 2.2 6.65 ± 0.58 4 The mass spectrum for m
4`is shown for the selected events in Fig. 5(a) in the low mass region together with the expected ZZ
∗and reducible backgrounds, and an expected SM Higgs signal at 125 GeV. Fig- ure 5(b) shows the distribution of m
12versus m
34, and their projections, for the candidates with m
4`within 110–140 GeV, are shown in Figs. 5(c) and 5(d). The Z-mass constrained kinematic fit is not applied. The event with m
4`= 129 GeV is consistent with VBF production of a Higgs boson decaying to four leptons.
It is displayed in Figs. 12 and 13.
The mass spectrum for the full mass range is shown in Fig. 6.
The number of observed candidate events for each of the four decay channels in a mass spectrum above
200 GeV along with the background expectations are presented in Table 6.
[GeV]
m4l
80 90 100 110 120 130 140 150 160 170
Events/2.5 GeV
0 2 4 6 8 10 12 14 16
Data
= 125 GeV) Higgs (mH
ZZ*
t Z+jets, t +V, VVV t t Uncertainty
4l ZZ* → H →
13 TeV, 3.2 fb-1
ATLASPreliminary
(a)
[GeV]
m12
60 80 100
[GeV]34m
20 40 60 80 100
0 0.01 0.02 0.03 0.04 0.05 0.06 0.07 Data
= 125 GeV) Higgs (mH
, VVV t ZZ*, Z+jets, t
ATLASPreliminary 4l ZZ* → H →
13 TeV, 3.2 fb-1 < 140 GeV
4l
110 < m
(b)
[GeV]
m12
50 55 60 65 70 75 80 85 90 95 100
Events/2.5 GeV
0 2 4 6 8
10 Data = 125 GeV)
Higgs (mH
ZZ*
t Z+jets, t +V, VVV t t Uncertainty
4l ZZ* → H →
13 TeV, 3.2 fb-1 < 140 GeV
4l
110 < m
ATLASPreliminary
(c)
[GeV]
m34
15 20 25 30 35 40 45 50 55 60
Events/4 GeV
0 1 2 3 4 5 6 7 8 9
Data
= 125 GeV) Higgs (mH
ZZ*
t Z+jets, t +V, VVV t t Uncertainty
4l ZZ* → H →
13 TeV, 3.2 fb-1 < 140 GeV
4l
110 < m
ATLASPreliminary
(d)
Figure 5:m4`distribution of the selected candidates, compared to the background expectation(a)in the low mass region. Distributions of data (filled circles) and the expected signal and backgrounds events in them34–m12plane with the requirement ofm4`in 110–140 GeV(b). The projected distributions are shown form12(c)andm34(d). The signal contribution is shown formH =125 GeV as blue histograms in(a),(c)and(d). The expected background contributions,ZZ∗ (red histogram),Z+jets plustt¯(purple histogram) andttV¯ plusVVV (yellow histogram), are shown in(a),(c)and(d); the systematic uncertainty associated to the total background contribution is represented by the hatched areas. The expected distributions of the Higgs signal (blue) and total background (red) are superimposed in(b), where the box size (signal) and colour shading (background) represent the relative density.
Table 6: The number of expected and observed events for the four-lepton final states in a range ofm4` >200 GeV, for 3.2 fb−1at √
s=13 TeV. In the second column the number of expectedZZ∗events are shown, and in the third column the expected number of events for the reducible background and thettV¯ and triboson processes is quoted.
The sum of the expected events and the observed ones are shown in the last two columns. Full uncertainties are provided.
Final state ZZ
∗Z + jets, t¯ t, WZ t¯ tV,VVV Expected Observed
4µ 22.1 ± 2.2 0.05 ± 0.02 0.23 ± 0.01 22.4 ± 2.2 20
2e2µ 16.9 ± 1.6 0.05 ± 0.02 0.21 ± 0.01 17.2 ± 1.6 17
2µ2e 18.1 ± 2.6 0.06 ± 0.02 0.19 ± 0.01 18.3 ± 2.6 13
4e 13.9 ± 2.1 0.06 ± 0.02 0.18 ± 0.01 14.1 ± 2.1 12
Total 71 ± 8 0.23 ± 0.04 0.81 ± 0.04 72 ± 8 62
[GeV]
m4l
200 300 400 500 600 700 800 900 1000
Events/20 GeV
2
10− 1
10−
1 10 102
Data
= 125 GeV) Higgs (mH
ZZ*
t Z+jets, t +V, VVV t t Uncertainty
4l ZZ* → H →
13 TeV, 3.2 fb-1
ATLASPreliminary
Figure 6:m4`distribution of the selected candidates, compared to the SM expectation between 160 and 1000 GeV.
The expected distributions of the Higgs signal (blue), theZZ∗background (red), the reducible background (purple) andt¯tVplusVVV(yellow histogram) are superimposed.
7. Fiducial and total cross section measurement
The total cross section σ
totcan be expressed as:
σ
tot= N
sA · C · B · L
int. (1)
where N
sis the number of observed signal events, L
intthe integrated luminosity, B is the branching ratio of the Higgs boson decay into the four lepton final state, H → ZZ
∗→ 4`, A is the kinematic and geometric acceptance in the fiducial region, and C is a detector correction factor which accounts for e ff ects such as trigger, reconstruction and identification e ffi ciencies and reconstruction resolution. The fiducial acceptance factor A corresponds to the theory dependent fraction of H → ZZ
∗→ 4` decays that pass the fiducial selection.
The fiducial cross section is defined by:
σ
fid4`= N
sC · L
int. (2)
The fiducial selection is given in Table 7. It is designed to closely replicate the analysis selection at the particle-level [84], while keeping it simple and easy to reproduce. The selection is applied to electrons and muons before they emit photon radiation, referred to as Born-level leptons. No isolation requirement is applied in the fiducial selection, so that any isolation ine ffi ciency is included in C.
Table 7: List of the selections which define the fiducial region of the cross section measurement. Same flavour opposite sign lepton pairs are denoted as SFOS, the leading lepton pair mass asm12, and the subleading lepton pair mass asm34.
Lepton definition
Muons: p
T> 6 GeV, |η| < 2.7 Electrons: p
T> 7 GeV, |η| < 2.47 Pairing
Leading pair: SFOS lepton pair with smallest |m
Z− m
``|
Sub-leading pair: Remaining SFOS lepton pair with smallest |m
Z− m
``| Event selection
Lepton kinematics: Leading lepton p
T> 20, 15, 10 GeV Mass requirements: 50 < m
12< 106 GeV; 12 < m
34< 115 GeV
Lepton separation: ∆ R(`
i, `
j) > 0.1(0.2) for same (opposite) flavour leptons J/ψ veto: m(`
i, `
j) > 5 GeV for all SFOS lepton pairs
Mass window: 118 < m
4`< 129 GeV For a SM Higgs boson mass of 125.09 GeV and √
s = 13 TeV, the values of the fiducial acceptance (with respect to the full phase space of H → ZZ
∗→ 4`) are shown in Fig. 7(a) for the four final states and as a function of the production mode. The inclusive fiducial acceptance averaged over final states and production modes is given in Table 8 for √
s = 7 TeV, 8 TeV and 13 TeV.
The detector correction factors are estimated from simulation and are given by the ratio of the number of
selected reconstructed events relative to the number of particle-level events with Born leptons falling in
the fiducial region. They include migration of events into and out of the fiducial region due to resolution
ggF+bbH VBF WH ZH ttH
AFiducial acceptance,
0.3 0.35 0.4 0.45 0.5 0.55 0.6 0.65
Preliminary ATLAS Simulation
= 125.09 GeV = 13 TeV, mH
s 4l ZZ* → H →
0.0024 = 0.4274 ± A
Inclusive 4µ
2e 2µ
2e2µ
4e
(a)
ggF+bbH VBF WH ZH ttH
CDetector correction factor,
0.3 0.4 0.5 0.6 0.7 0.8
0.9 ATLAS Preliminary Simulation
= 125.09 GeV = 13 TeV, mH
s 4l ZZ* → H →
0.0045 = 0.5271 ± C
Inclusive 4µ
2e 2µ
2e2µ
4e
(b)
Figure 7: Fiducial acceptance factors(a)and detector correction factors(b)formH=125.09 GeV at √
s=13 TeV for different production modes and separated by final state. Uncertainties are statistical only.
effects. The factors are shown in Fig. 7(b) for the four final states and as a function of the production mode for √
s = 13 TeV. The lower e ffi ciency for the ttH production mode is due to the isolation requirement and the higher jet activity. The inclusive detector correction factors averaged over final states and production modes are also given in Table 8 for √
s = 7 TeV, 8 TeV and 13 TeV.
Table 8: Summary of the inclusive acceptance factors (A) and the inclusive detector correction factors (C) in % as a function of the centre-of-mass-energy and assumingmH =125.09 GeV. Uncertainties are statistical only. The systematic uncertainties are given in Table9