arXiv:1109.6446v1 [astro-ph.HE] 29 Sep 2011
32NDINTERNATIONALCOSMICRAYCONFERENCE, BEIJING2011
Testing the emission models of blazar jets with the MAGIC telescopes
J. BECERRA-GONZALEZ´ 1,2, A. STAMERRA3, K. SAITO4, D. MAZIN5, F. TAVECCHIO6, L. MARASCHI6, E. PRANDINI7, J. SITAREK8ANDK.BERGER1ON BEHALF OF THEMAGICCOLLABORATION.
1Instituto de Astrof´ısica de Canarias
2Universidad de La Laguna
3Universita di Siena and INFN Pisa
4Max-Planck-Institut fur Physik
5Institut de Fisica d’Altes Energies, Barcelona
6INAF National Institute for Astrophysics
7Universita di Padova and INFN
8University of Lodz jbecerra@iac.es
Abstract: The MAGIC telescopes discovered very high energy (VHE, E>100 GeV) gamma-ray emission coming from the distant Flat Spectrum Radio Quasar (FSRQ) PKS 1222+21 (4C +21.35, z=0.432). It is the second most distant VHE gamma-ray source, with well measured redshift, detected until now. The observation was performed on 2010 June 17 (MJD 55364.9) using the two 17 m diameter imaging Cherenkov telescopes on La Palma (Canary Islands, Spain). The MAGIC detection coincides with high energy MeV/GeV gamma-ray activity measured by the Large Area Telescope (LAT) on board the Fermi satellite. The averaged integral flux above 100 GeV is equivalent to 1 Crab Nebula flux. The VHE flux measured by MAGIC varies significantly within the 30 minutes of exposure implying a flux doubling time of about 10 minutes. The VHE and MeV/GeV spectra, corrected for the absorption by the extragalactic background light, can be described by a single power law with photon index2.72±0.34between 3 GeV and 400 GeV, consistent with gamma-ray emission belonging to a single component in the jet. The absence of a spectral cutoff at 30-60 GeV (indeed, one finds a strict lower limitEc >130 GeV) constrains the gamma-ray emission region to lie outside the broad line region, which would otherwise absorb the VHE gamma-rays. Together with the detected fast variability, this challenges present emission models from jets in FSRQs.
Keywords: galaxies: active galaxies: jets quasars: individual (PKS 1222+21) cosmic background radiation gamma rays: galaxies
1 Introduction
Blazars are active galactic nuclei hosting powerful rela- tivistic jets pointing toward the observer. They are char- acterized by strong non-thermal emission extending across the entire electromagnetic spectrum, from radio up to γ- rays. The blazar PKS 1222+21 (also knows as 4C 21.35) belongs the class of Flat Spectrum Radio Quasars (FSRQs) and is located at a redshift ofz = 0.432[1]. FSRQs dis- play luminous broad emission lines, often accompanied by a “blue bump” in the optical-UV region which is associ- ated with the direct emission from the accretion disk. This optical-UV emission is believed to be re-processed by the Broad Line Region (BLR) clouds, filling the BLR with a dense optical-UV radiation field which can interact with VHE γ-rays causing internal absorption in the VHE do- main [6]. PKS 1222+21 is the third FSRQ detected in VHE γ-rays after PKS 1510-08 [2] and 3C 279 [3, 4] at the red- shifts ofz = 0.36andz = 0.536, respectively. It is thus
the second most distant VHE source after 3C 279 with well measured redshift (the BL Lac 3C 66A with an estimated redshiftz = 0.444[5] would occupy this position of the ranking, but the measurement has a large uncertainty).
In this proceeding, we will present the MAGIC discovery of this source which was detected during aγ-rays flare an- nounced by the Fermi/LAT collaboration and its physics implications.
2 MAGIC discovery
MAGIC consists of two 17 m diameter Imaging Atmo- spheric Cherenkov Telescopes (IACTs). The data were taken at zenith angles between26◦and35◦. Stereoscopic events, triggered by both telescopes, were analyzed in the MARS analysis framework [8]. Details on the analysis can be found in [23] whereas the performance of the MAGIC
J. BECERRA-GONZALEZ´ et al. TESTING THE EMISSION MODELS OF BLAZAR JETS
Figure 1:Distribution of the squared angular distance (θ2) for events in the direction of 4C +21.35 (black points) and normalized off-source events (grey histogram). The signal is extracted in theθ2-region denoted by the vertical dashed line.
stereo system will be discussed in detail in a forthcoming paper [10].
PKS 1222+21 was observed by MAGIC on June 17 (MJD 55364) for 30 minutes as part of a Target of Opportunity program triggered by an increased flux in the Fermi en- ergy band [9]. During this detection by MAGIC the source was close to the brightest flare ever observed by the Fermi Large Area Telescope (LAT) [22]. The signal evaluation was performed using the θ2 distribution (squared angular distance between the true and reconstructed source posi- tion), see Fig. 1. We got an excess of 190γ-like events (6γ/min.) above a background of 86 events, which corre- sponds to a statistical significance of 10.2σusing eq. 17 in [7]. The energy threshold of this analysis is≈70GeV.
2.1 Very High Energy Spectrum
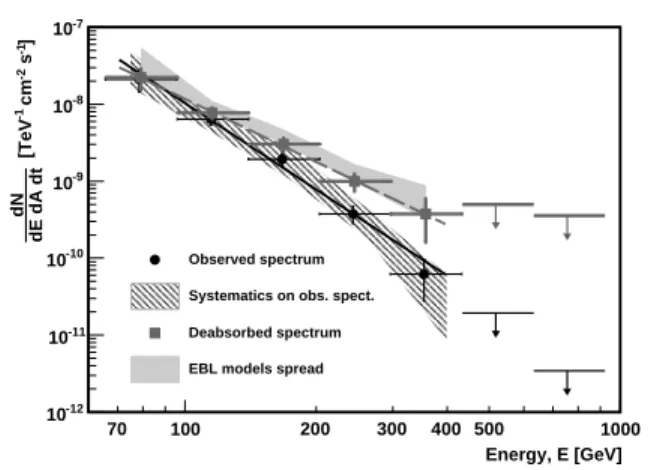
The differential energy spectrum measured by MAGIC ex- tends from 70 GeV to 400 GeV (Figure 2) and it is well- described by a simple power law of the form:
dN
dE =N200
E
200GeV −Γ
(1) with a photon indexΓ = 3.75±0.27stat±0.2systand a nor- malization constant at 200 GeV ofN200 = (7.8±1.2stat± 3.5syst)×10−10cm−2s−1TeV−1, yielding an integral flux (4.6±0.5)×10−10cm−2s−1 (≈1 Crab Nebula flux) at E>100GeV. For energies higher than 400 GeV no signif- icant excess was found but two upper limits correspond- ing to 95% confidence level (C.L.) have been derived. The method used for the spectral reconstruction is the so-called
“Tikhonov” unfolding algorithm [15], which takes into ac- count the finite energy resolution of the instrument and the biases in the energy reconstruction. The systematic un- certainty of the analysis (studied by using different cuts and different unfolding algorithms) is shown by the striped area.
Energy, E [GeV]
70 100 200 300 400 500 1000
] -1 s-2 cm-1 [TeV dE dA dtdN
10-12
10-11
10-10
10-9
10-8
10-7
Observed spectrum Systematics on obs. spect.
Deabsorbed spectrum EBL models spread
Figure 2:Differential energy spectrum of PKS 1222+21 as mea- sured by MAGIC on 2010 June 17. Differential fluxes are shown as black points, upper limits (95% C.L.) as black arrows. The black line is the best fit to a power law. The black-striped area rep- resents the systematic uncertainties of the analysis. The absorp- tion corrected spectrum and upper limits using the EBL model of [11] are shown by the grey squares and arrows; the dashed grey line is the best fit power law. The grey shaded area illustrates the uncertainties due to differences in the EBL models of [12, 13, 14]
and [3].
The deabsorbed spectrum is shown by the grey squares in Fig. 2, where the EBL model of [11] has been used. It is well fitted by a power law with an intrinsic photon index of Γintr = 2.72±0.34between 70 GeV and 400 GeV. Uncer- tainties caused by the differences between the EBL models are represented in Fig. 2 by the grey shaded area. The cor- responding spread is smaller than the systematic uncertain- ties of the MAGIC data analysis.
Using theχ2difference method we studied the possibility of a cut-off in the energy spectrum. We tried to fit the spec- trum by a broken power law with different photon indexes and values for the cut-off. We concluded from this study that with the available statistics, at the 95% C.L. we cannot exclude the presence of a cut-off above 130 GeV for a pho- ton index 2.4 (the lowest possible value compatible with fit uncertainties and with the Fermi/LAT data, see Fig. 4) or above 180 GeV for a photon index 2.7.
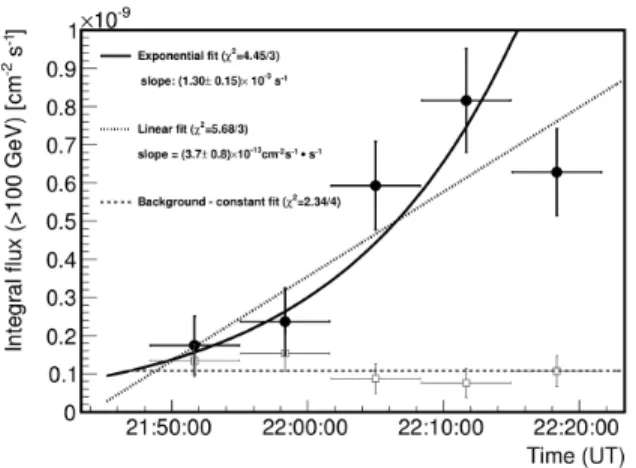
2.2 Variability in Very High Energyγ-rays Thanks to the strength of the signal even if the observa- tion time is as short as 30 minutes, a variability study is possible. In Fig. 3 the light curve binned in 6 minute long intervals is shown. It reveals a flux variation within the 30 minutes of observation time. The hypothesis of a constant flux is rejected (χ2/N DF= 28.3/4) with high confidence (probability< 1.1×10⁻⁵). The flux of the background events surviving theγ/hadron selection cuts is compatible with being constant and hence we can exclude a variation of the instrument performance during the observation.
32NDINTERNATIONALCOSMICRAYCONFERENCE, BEIJING2011
Figure 3:PKS 1222+21 light curve above 100 GeV, in 6 minute bins (black filled circles). The observation was carried out on MJD 55364. The black solid line is a fit with an exponential func- tion and the black dotted line a fit with a linear function. The grey open squares denote the fluxes from the background events and the grey dashed line is a fit with a constant function to these points.
To quantify the variability time scale we performed an ex- ponential fit (solid black line in Fig. 3). A linear fit is also acceptable but does not allow us to define a time scale unambiguously. For the exponential fit the doubling time of the flare is estimated as 8.6+1.1−0.9minutes. The derived timescale corresponds to the fastest time variation ever ob- served in an FSRQ in the VHE range and in any other en- ergy range [20], and is amongst the shortest measured from any TeV emitting source [21, 17].
3 Spectral Energy Distribution
The high-energy Spectral Energy Distribution (SED) is shown in Figure 4 where the MeV/GeV energy range spec- trum from Fermi/LAT and the GeV/TeV spectrum mea- sured by MAGIC are combined. The source showed a significant flare in the Fermi band lasting ∼3 days, with a peak flux on 2010 June 18 (MJD 55365) [22]. During the 30 minutes MAGIC observation there is a gap in the LAT exposure, so we analyzed the closest data available, a period of 2.5 hr (MJD 55364.867 to 55364.973) before and after the MAGIC observation. Given the short observation time (chosen in order to be as much contemporaneous as possible with the MAGIC data) there is no detection above 2 GeV in the Fermi/LAT data, but an upper limit at the 95%
C.L. in the energy range2−6.3GeV has been calculated together with the spectral points up to 2 GeV and combined with the MAGIC data in the SED shown in Fig. 4.
If we extrapolate the intrinsic MAGIC spectrum to lower energies we can see that there is a potentially smooth connection between the Fermi/LAT and MAGIC extrapo- lated data and the photon index steepens from 1.9 in the Fermi/LAT range to 2.7 in the MAGIC range. These results agree with the analysis of larger temporal intervals during
logE(GeV)
-1 -0.5 0 0.5 1 1.5 2 2.5 3 3.5
)-1 s-2dN/dE) (GeV cm2Log(E
-9.5 -9 -8.5 -8 -7.5 -7 -6.5 -6 -5.5
)-1 s-1) (erg cmνFνLog(
-12 -11 -10 -9 (Hz)
ν
1023 1024 1025 1026
MAGIC SED extrapolation (EBL Model: Dominguez+10)
: 2.7 Γ absorbed intrinsic
Fermi - 2.5 hrs MAGIC PKS1222+21 z= 0.432
Figure 4: High energy SED of PKS 1222+21 during the flare of 2010 June 17 (MJD 55364.9), showing Fermi/LAT (squares) and MAGIC (circles) differential fluxes. A red bow tie in the MeV/GeV range represents the uncertainty of the likelihood fit to the Fermi/LAT data. The unfolded and deabsorbed spectral fit of the MAGIC data is also shown as a grey bow tie, extrapolated to lower and higher energies (dotted lines). A thick solid line (photon indexΓ = 2.7) indicates a possible extrapolation of the MAGIC deabsorbed data to lower energies. The thick dashed line represents the EBL absorbed spectrum obtained from the extrap- olated intrinsic spectrum using the model of [11].
this flare and during the whole active period, in which the source spectrum is well described by a broken power law with an energy break between 1 and 3 GeV [22]. Further- more it is found that the high energy tail (E>2GeV) of the Fermi/LAT spectrum of 4C +21.35 extends up to 50 GeV, with a photon index in the range 2.4-2.8.
4 Physical implications on the jet emission models
As we have discussed, the almost simultaneous VHE and GeV spectra are consistent with a single power law with index∼ 2.7±0.3between 3 GeV and 400 GeV, without a strong intrinsic cutoff and with a smooth connection to the lower energy spectrum. This evidence suggests that the 100 MeV - 400 GeV emission belongs to a unique compo- nent, peaking at≈2−3GeV, produced in a single region of the jet. Considering the inverse Compton scattering on external photons and relativistic electrons in the jet as the emission process, as it is usually assumed, we have two possible scenarios. The emitting jet region could be in- side of the Broad Line Region (BLR), where the external photons field would be the UV photons from the BLR or we can assume this emitting region to be outside of the BLR where the photon field would be composed of the IR photons coming from the torus. There are two important effects that need to be taken into account: the decreased ef- ficiency of the IC scattering occuring in the Klein-Nishina (KN) regime and the absorption ofγ-rays through pair pro- duction.
J. BECERRA-GONZALEZ´ et al. TESTING THE EMISSION MODELS OF BLAZAR JETS
The energy above which the KN effects andγ-ray absorp- tion become important in the case of UV external photons from the BLR is ∼tens of GeV, and thus we would ex- pect a cut-off at these energies if the emitting jet region is inside the BLR. But if we consider as target photons the ones coming from the IR torus this effect would start to be appreciated only at much higher energies above≈1 TeV.
Since there is no evidences of a cut-off at low energies we can conclude that the emission should come from outside of the BLR, as has been proposed by the “far dissipation”
scenarios [e.g. [19]].
Besides, the other important result of the MAGIC observa- tion is the fast variability,tvar ∼ 10minutes which indi- cates an extremely compact emission region. This is diffi- cult to reconcile with the “far dissipation” scenarios if the emission takes place in the entire cross section of the jet since in this case the emitting region should be close to the central black hole and thus inside of the BLR.
Some explanations have been already proposed in order to solve this kind of incongruities, invoking the presence of very compact emission regions embedded within the large scale jet [18, 24] or the possibility of a very strong jet rec- ollimation [e.g. [16]].
In conclusion the MAGIC observation of VHE emission from the FSRQ PKS 1222+21 sets severe constraints on the emission models of blazar jets.
5 Acknowledgments
We would like to thank the Instituto de Astrof´ısica de Ca- narias for the excellent working conditions at the Observa- torio del Roque de los Muchachos in La Palma. The sup- port of the German BMBF and MPG, the Italian INFN, the Swiss National Fund SNF, and the Spanish MICINN is gratefully acknowledged. This work was also supported by the Marie Curie program, by the CPAN CSD2007-00042 and MultiDark CSD2009-00064 projects of the Spanish Consolider-Ingenio 2010 programme, by grant DO02-353 of the Bulgarian NSF, by grant 127740 of the Academy of Finland, by the YIP of the Helmholtz Gemeinschaft, by the DFG Cluster of Excellence “Origin and Structure of the Universe”, and by the Polish MNiSzW grant 745/N-HESS- MAGIC/2010/0.
References
[1] D. E. Osterbrock & R. W. Pogge, ApJ,1987, 323, 108 [2] Wagner, S. & Behera, B. ,10th HEAD Meeting,
Hawaii, 2010, BAAS 42, 2, 07.05 [3] J. Albert et al., Science,2008, 320, 1752 [4] J. Aleksic et al., A&A, 2011, 530, A4 [5] D.A. Bramel et al., ApJ, 2005, 629, 108-114
[6] A.-C. Donea & R. J. Protheroe, Astroparticle Physics, 2003, 18, 377-393
[7] T.-P. Li & Y.-Q. Ma, ApJ, 1983, 272, 317
[8] A. Moralejo et al., Proc. of 31st ICRC, 2009, arXiv:0907.0943
[9] D. Donato, The Astronomer’s Telegram, #2584 [10] J. Aleksic et al., in prep.
[11] A. Dominguez et al., MNRAS, 2011, 410, 2556 [12] T. M. Kneiske & H. Dole, A&A, 2010, 515, 19 [13] R. Gilmore et al., MNRAS, 2009, 399, 1694 [14] A. Franceschini et al., A&A, 2008, 487, 837 [15] J. Albert et al., Nucl. Instr. Meth., 2007, A 583, 494 [16] K. Nalewajko & M. Sikora, MNRAS, 2009, 392,
1205
[17] J. Albert et al., Physics Letters B, 2008, 668, 253 [arXiv:0708.2889v3]
[18] G. Ghisellini & F. Tavecchio, MNRAS, 2008, 386, 28 [19] M. Sikora et a., ApJ, 2008, 675, 71
[20] L. Foschini et al., A&A, 2011, bf 530, A77 [21] A. Abramowski et al., A&A, 2010, 520, 83 [22] Y.T. Tanaka, ApJ, 2011, 733 (1), 19
[23] J. Aleksic et al., ApJL, 2010, 726, 58 [arxiv:1010.0550]
[24] F. Tavecchio et al., Submitted to A&A, 2011,arXiv:1104.0048v1