arXiv:1109.6451v1 [astro-ph.HE] 29 Sep 2011
32NDINTERNATIONALCOSMICRAYCONFERENCE, BEIJING2011
Stereoscopic Observations of the Blazar 3C 66A with the MAGIC Telescopes
STEFANKLEPSER1, KOJISAITO2FOR THEMAGICCOLLABORATION 1IFAE, Edifici Cn., Campus UAB, E-08193 Bellaterra, Spain
2Max-Planck-Institut f¨ur Physik, D-80805 M¨unchen, Germany klepser@ifae.es
Abstract: 3C 66A is an intermediate-frequency peaked BL Lacertae object of uncertain redshift. We report recent observations of the region around the blazar with the MAGIC telescopes. The source was observed and detected in 2009 December and 2010 January, in2.3 hof good quality data. The signal could clearly be assigned to the blazar 3C 66A, statistically and systematically rejecting the nearby radio galaxy 3C 66B as a possible origin of the gamma-ray signal by 3.6 standard deviations. The derived integral flux above100 GeVis 8.3%of the Crab Nebula flux, and the energy spectrum is reproduced by a power law of photon index3.64±0.39(stat.)±0.25(sys.). Within the errors, this is compatible with the spectrum derived by VERITAS in 2009. From the spectra corrected for absorption by the extragalactic background light, we only find small differences between the four modellings that we applied, and constrain the redshift of the blazar toz <0.68.
Keywords: MAGIC, blazar, 3C 66A, very-high energy gamma-rays
1 Introduction
3C 66A is a very high energy (VHE) gamma-ray blazar classified as a BL Lac object [26], or an intermediate- frequency peaked BL Lac object (IBL, [32]). It has an uncertain redshift reported to be 0.444 [29, 24] or 0.321 [40], estimated from a single spectral line, or a marginally resolved host galaxy respectively. Besides that, the exist- ing upper and lower limits to the redshift are>0.096[15],
<0.44[33] and<0.58[41].
In the VHE band, the source was first claimed by the Crimean Astrophysical Observatory above 900 GeVwith an integral flux of(3±1)×10−11cm−2s−1[35]. Later observations by HEGRA and Whipple reported upper lim- its [4, 21], while STACEE found a hint of a signal at a significance level of 2.2 [12]. More recent VERITAS observations of 3C 66A took place in 2007 and 2008, for a total of 32.8 hours, and resulted in a clear detec- tion in VHE gamma rays [3]. The derived energy spec- trum was compatible with a power law of photon index Γ = 4.1±0.4stat ±0.6sys and an integral flux above 200 GeVof (1.3±0.1)×10−11cm−2s−1(6%of the Crab Nebula flux).
In the GeV band, the gamma-ray emission spot 3EGJ0222+4253 measured by EGRET was associated to 3C 66A, although an influence by the nearby pulsar PSR J0218+4232 could not be excluded [20, 23]. Fermi/LAT has monitored 3C 66A since 2008 August, covering the latter part of the VERITAS observation. According to [1],
which reported the first 5.5 months of Fermi/LAT data of 3C 66A, it showed a significant flux variability (a factor of 5-6 between the highest and lowest fluxes). In the new multiwavelength study published in [2], photon indices for the dark period (1.9±0.1stat ±0.1sys) and flare period (1.8±0.1stat±0.1sys) were estimated. In combination with the VERITAS spectrum, this indicates a softening of the spectrum above100 GeV.
From MAGIC observations of that sky region in 2007, we reported a significant VHE gamma-ray signal cen- tered at 2h23m12s, 43◦0′7′′. This excess (named MAGIC J0223+430) coincides within uncertainties with the position of a nearby, Fanaroff-Riley-I (FRI) type galaxy 3C 66B [36,z = 0.0215,]. Still, judging from the sky- plot alone, and taking into account statistical and sys- tematic errors, the probability of the emission to origi- nate from 3C 66A was 14.6%. The energy spectrum of MAGIC J0223+430 was compatible with a power-law with an index ofΓ = 3.1±0.3. The integral flux above150 GeV corresponded to (7.3±1.5)×10−12cm−2s−1(2.2%of the Crab Nebula flux). According to [37], the radio galaxy is also a plausible source of VHE gamma-ray radiation. Also, the recent MAGIC detection of IC 310 [8], a radio galaxy at a very similar redshift (z= 0.0189) indicates that 3C 66B is in principle a feasible object to explain all or part of the MAGIC detection from 2007.
KLEPSERet al. STEREOSCOPICOBSERVATIONS OF3C 66A
2 Data set and analysis methods
In August 2009, 3C 66A went into an optical high state which was reported by the Tuorla blazar monitoring pro- gram1. This outburst triggered new observations by the MAGIC telescopes, located on the Canary Island of La Palma (28.8◦ N, 17.8◦ W, 2220 m a.s.l.). The two 17 m diameter telescopes use the atmospheric Cherenkov imag- ing technique and allow for gamma-ray measurements at a threshold as low as50 GeVin normal trigger mode.
We observed 3C 66A in several time slots between 2009 September and 2010 January. However, the ”starguider”
CCD cameras that are used to cross-check the telescope pointing only became fully applicable to stereo observa- tions in early December. To allow for a high-confidence statement on the directional origin of the gamma rays, we only used data taken after these upgrades, which were 5.6 hours in total. Furthermore, we had to discard data with low event rates, affected by the exceptionally bad weather conditions in that winter. Finally, we had 2.3 hours of good quality data left after all quality cuts. They were taken on 6 days between 2009 December 5 and 2010 January 18, partly under low intensity moon light conditions.
The data were taken using the so-called ”wobble” method [16], in which the pointing direction alternates every 20 minutes between two positions, offset by±0.4◦in RA from the source. These wobble positions were chosen to be cen- tered on 3C 66A, but the small distance to 3C 66B (0.01◦) allows equal judgment for both sources. The data were taken at a zenith distance between 13◦and 35◦.
The analysis we present here involved only events that were triggered by both MAGIC telescopes. The analysis was done with the MARS analysis framework [30], taking ad- vantage both of the advanced single-telescope algorithms (e.g. [10]) and newly developed stereoscopic analysis rou- tines. A paper about these stereoscopic analysis methods of MAGIC is in preparation.
In the skymapping procedure of MAGIC, which is crucial for the directional statements, first an exposure model is calculated in coordinates relative to the viewing direction.
From that, a background expectation distribution is sam- pled randomly to celestial coordinates. After applying a folding with a Gaussian kernel, the background and real event distribution are compared using equation (17) of [25]
as a test statistic. The resulting null-hypothesis distribution of this test statistic is mostly resembling a gaussian distri- bution, but in some cases has poissonian components as well, therefore the detection significance is always taken from the (unsmeared, and unmodeled) θ2-distributions.
The performance of the analysis software was checked with contemporaneous Crab Nebula data and simulations. The achieved angular resolution2. was 0.1◦at100 GeVand ap- proaching 0.065◦at higher energies.
The systematic uncertainty on the direction reconstruction is a product of the telescope pointing uncertainty and pos- sible biases that occur in the reconstruction algorithms in
RA [ h ]
DEC [ deg ]
42.6 42.8 43 43.2 43.4
-4 -2 0 2 4 6 3C 66A/B Significance Map
2.34 2.36 2.38 2.4 2.42
3C 66A 3C 66B
PSF
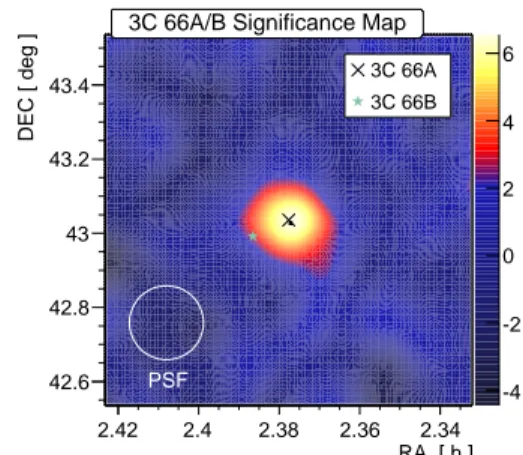
Figure 1: MAGIC significance test statistic skymap of the region around 3C 66A/B for events with reconstructed en- ergies above100 GeV.
the presence of e.g. star light inhomogeneities or electronic imperfections in the hardware. Both the total pointing devi- ation and the telescope pointing precision of MAGIC were always monitored over the years [13, 7], and along with studies of contemporary stereo data of known direction lead to an estimate of the maximal systematic stereoscopic pointing uncertainty of 0.025◦.
The publicly accessible Fermi/LAT data3 were ana- lyzed using the public software package LAT Science Tools v9.15.2, including the Instrument Response File P6 V3 DIFFUSE, and galactic, extragalactic and instru- mental background models.
3 Results
A a skymap of the observed region above 100 GeV is shown in Fig. 1. To calculate a conservative detection sig- nificance, we investigated the distribution of squared an- gular distances (θ2) between photon directions and the as- sumed source position. The expected background is ex- tracted from the opposite side of the field of view, at the same distance from the pointing direction. Comparing the events at the source position with this expectation we find a significance of5.2σ(see Fig. 2).
Unlike in the previous 2007 detection of MAGIC, the emis- sion peak this time is clearly located on top of 3C 66A. The fitted center of gravity of the excess (small black square in Figure 1) is at a distance of0.010◦±0.023◦stat±0.025◦sys from 3C 66A, and 0.108◦ ±0.023◦stat ±0.025◦sys from 3C 66B. While being compatible with the blazar 3C 66A, the statistical rejection power for the emission to emerge from the radio galaxy 3C 66B corresponds to 4.6 standard deviations. Even considering the unlikely case of a system-
1. http://users.utu.fi/kani/1m/index.html
2. defined as theσof a two-dimensional Gaussian function 3. http://fermi.gsfc.nasa.gov/
32NDINTERNATIONALCOSMICRAYCONFERENCE, BEIJING2011
2] [degree θ2
0 0.1 0.2 0.3 0.4
eventsN
0 20 40 60 80 100 120 140 160 180 200
220 Time = 2.3 h
8.7
± = 232.3 = 331; Noff Non
= 98.7 Nex
σ Significance (Li&Ma) = 5.2
Figure 2: θ2 distribution with respect to the position of 3C 66A (θ2) for events with reconstructed energies above 100 GeV. The OFF data are taken from three positions that are symmetrical with respect to the telescope pointing di- rections.
atic offset exactly towards the blazar, the rejection signifi- cance of 3C 66B is3.6σ.
To derive an energy spectrum, we compared four differ- ent unfolding algorithms [5] which correct for efficiency, smearing and biasing effects in the energy response of the detector. Among these, also the so-called forward unfold- ing was tested, which essentially is a fit with correlations defined by the response matrix. With all unfolding meth- ods, we found that the data are well compatible with a power law of the form
dF
dE =K200
E
200 GeV −Γ
. (1)
Here the photon index isΓ = 3.64±0.39stat±0.25sys
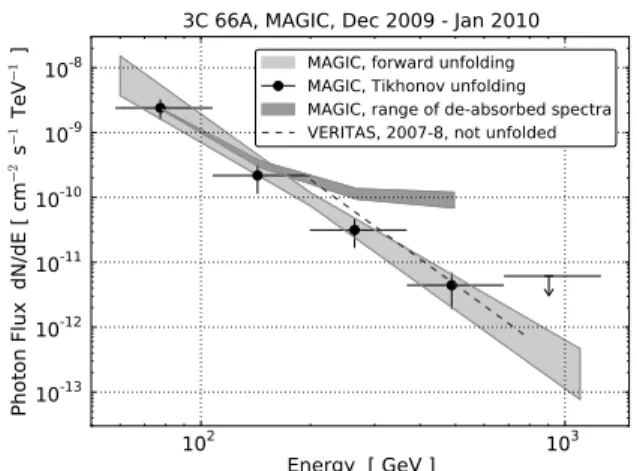
and the flux constant200 GeVofK200 = 9.6±2.5stat± 3.4sys ×10−11cm−2s−1TeV−1. The integral flux above 100 GeV is equivalent to(4.5±1.1)×10−11cm−2s−1 (8.3%Crab Nebula flux). The parameters and statistical errors are taken from the forward unfolding, while the sys- tematic errors reflect the variations among the other unfold- ing algorithms, plus several additional uncertainties dis- cussed in [6]. The systematic flux uncertainties add up to about 36% in total. Figure 3 displays the spectral points derived using the Tikhonov unfolding method [38], and the function we fitted through forward unfolding.
We also analyzed the Fermi data from the same time period.
We found the flux variability to be insignificant in a week- to-week lightcurve. Given the statistical uncertainties of the lightcurve, we would be sensitive on 3σlevel to flux variations of 60%or greater, and conclude the variability in the days we observed must be less than that. The averaged flux above200 MeVis comparable to the one found in [1], and less than the flux level seen in 2008 October. A single power-law model can reproduce the source spectrum, and the photon index is again compatible with the one found in [2], indicating no significant change in the overall spectral shape.
102 Energy [ GeV ] 103 10-13
10-12 10-11 10-10 10-9 10-8
Photon Flux dN/dE [ cm2 s
1 TeV
1 ] 3C 66A, MAGIC, Dec 2009 - Jan 2010 MAGIC, forward unfolding MAGIC, Tikhonov unfolding MAGIC, range of de-absorbed spectra VERITAS, 2007-8, not unfolded
Figure 3: Differential energy spectra of 3C 66A in the pe- riod of 2009 Dec and 2010 Jan. The light-shaded area in- dicates the1σrange of the observed unfolded power law spectrum gained by forward unfolding, the crosses are from the unfolding after [38] for comparison. The dark-shaded area is the spread of the EBL-corrected, mean flux values obtained by the four applied EBL models, assuming the redshift of z=0.444. The VERITAS (observed) spectrum after [3] is shown for comparison.
4 Discussion and Conclusions
MAGIC detected a VHE gamma-ray signal from 3C 66A in the period between December 2009 and January 2010, and during an optical active state of 3C 66A [9]. We rule out the emission to come from 3C 66B at a confidence level of3.6σ. In our previous detection from 2007 we could not significantly reject any of the two sources, so the new detection does not contradict the previous conclusion that the signal in 2007 might have been emerging from the radio galaxy. In particular, both objects are not only viable VHE emitters, but both would be likely to be variable sources.
Given the strong flux we detected in 3C 66A, we further- more conclude that 3C 66A might have to be in a low flux state in order not to outshine the comparably weak emis- sion from 3C 66B, assuming it is responsible for the flux level MAGIC detected in 2007.
The energy spectrum we unfolded is softer than in the pre- vious MAGIC detection (Γ = 3.10±0.31stat±0.2sys), and at the same time compatible with the VERITAS spec- trum of 3C 66A. Compared to VERITAS, MAGIC has a lower threshold and the spectrum is extending to well be- low 100 GeV. The flux level of 8.3% Crab Nebula flux is similar to the one reported by VERITAS (6%), and sig- nificantly higher than in the previous MAGIC observation (2.2%).
The VHE gamma rays produced at the source can be ab- sorbed in the intergalactic space by pair production with the UV to infrared photons of extragalactic background light (EBL) [34, 19]. The amount of absorption depends on the energy and redshift, and can be corrected for in
KLEPSERet al. STEREOSCOPICOBSERVATIONS OF3C 66A the data, assuming a given modeling of the EBL density.
This kind of de-absorbed spectrum can be regarded as the source-intrinsic spectrum that we would measure if there were no EBL. To derive such a de-absorbed spectrum, we tested several state of the art EBL models, namely [17], the fiducial model in [18], [22] and [14]. The EBL correc- tions were applied in the unfolding procedure, because it needs the covariance matrix to correctly calculate the er- rors. The spread of the differential, de-absorbed flux spec- tra, obtained with the four models and assuming the red- shift of z = 0.444, is shown as the dark shaded area in Figure 3. The de-absorbed photon indices for the four EBL modelings we used are2.57±0.68[17],2.61±0.67[18], 2.59±0.68[14] and2.37±0.70[22]. We conclude that the differences between the de-absorbed spectra are very small, reflecting the fact that also the predicted EBL shapes and densities are very similar.
Following the predicions of most VHE emission models, the de-absorbed spectrum of a blazar is not expected to be concave, i.e. rising towards higher energies. Two ways of testing this are to comparing the various points of our own spectrum, or to compare the points with the Fermi photon index. The fact that we find our spectrum neither signifi- cantly concave, nor harder than in Fermi, suggests that the assumed redshift ofz = 0.444does not contradict our ob- servations. We investigated the plausibility of the redshift quantitatively, assuming that the intrinsic spectrum is not expected to be exponentially rising, and thus have a pile- up, at highest energies. This common method was previ- ously used and described for example in [27, 28]. Using the [17] model and the likelihood ratio test between the ”power law” and ”power law + pile-up” hypotheses, as described in the reference, we derive an upper limit on the redshift of z <0.68.
Achieving these results in only 2.3 h of observations demonstrates the striking advantages of the MAGIC stereo- scopic system with respect to its monoscopic era. Further MAGIC and other gamma-ray observations of this region can provide interesting information about the IBL type BL Lac object 3C 66A, and, during low flux periods of that, also the FRI type galaxy 3C 66B.
References
[1] Abdo, A. A., et al., ApJ, 2009, 707(1310) [2] Abdo, A. A., et al., ApJ, 2011, 726(43) [3] Acciari, V. A., et al., ApJ, 2009, 693(L104) [4] Aharonian, F., et al., A&A, 2000, 353(847)
[5] Albert, J. et al., Nucl. Instr. Meth. A, 2007, 583(494) [6] Albert, J. et al., ApJ, 2008, 674(1037)
[7] Aleksi´c, J. et al., A&A, 2010, 524(A77) [8] Aleksi´c, J. et al., ApJ, 2010, 723(L207) [9] Aleksi´c, J. et al., ApJ, 2011, 726(58)
[10] Aliu, E. et al., Astropart. Phys., 2009, 30(293) [11] Aliu, E., et al., ApJ, 2009, 692(L29)
[12] Bramel, D. A., et al., ApJ, 2005, 629(108)
[13] Bretz, T., Dorner, D., Wagner, R. M., Sawallisch, P., Astropart. Phys., 2009, 31(92)
[14] Dom´ınguez, A., et al., MNRAS, 2010, 410(4), 2556 [15] Finke, J. D., Shields, J. C., B¨ottcher, M., & Basu, S.,
A&A, 2008, 477(513)
[16] Fomin, V. P., Stepanian, A. A., Lamb, R. C., Lewis, D. A., Punch, M., Weekes, T. C., Astropart. Phys., 1994, 2(137)
[17] Franceschini, A., Rodighiero, G., & Vaccari, M., A&A, 2008, 487(837)
[18] Gilmore, R. C., Madau, P., Primack, J. R., Somerville, R. S., & Haardt, F., MNRAS, 2009, 399(1694)
[19] Hauser, M. G., & Dwek, E., ARA&A, 2001, 39(249) [20] Hartman, R. C., et al., ApJS, 1999, 123(79)
[21] Horan, D., et al., ApJ, 2004, 603(51)
[22] Kneiske, T. M., & Dole, H., A&A, 2010, 515(A19) [23] Kuiper, L., Hermsen, W., Verbunt, F., Thompson,
D. J., Stairs, I. H., Lyne, A. J., Strickman, M. S., &
Cusumano, G., A&A, 2000, 359(5)
[24] Lanzetta, K. M., Turnshek, D. A., & Sandoval, J., ApJS, 1993, 84(109)
[25] Li, T.P., Ma, Y.Q., ApJ, 1983, 272(317)
[26] Maccagni, D., Garillini, B., Schild, R., & Tarenghi, M., A&A, 1987, 178(21)
[27] Mazin, D., & Goebel, F., ApJ, 2007, 655(L13) [28] Mazin, D., & Raue, M., A&A, 2007, 471(439) [29] Miller, J. S., French, H. B., & Hawley, S. A. 1978,
in Pittsburgh Conf. BL Lac Objects, ed. A. M. Wolfe (Univ. Pittsburgh, PA), 176
[30] Moralejo, A. et al., Proc. 31st ICRC (Ł´od´z), 2009 (arXiv:0907.0943)
[31] M¨ucke, A., Protheroe, R. J., Engel, R., Rachen, J. P.,
& Stanev, T., Astropart. Phys., 2003, 18(593) [32] Perri, M., et al., A&A, 2003, 407(453)
[33] Prandini, E., Bonnoli, G., Maraschi, L., Mariotti, M.,
& Tavecchio, F., MNRAS, 2010, 405(L76)
[34] Stecker, F. W., de Jager, O. C., & Salamon, M. H., ApJ, 1992, 390(L49)
[35] Stepanyan, A. A., Neshpor, Y. I., Andreeva, N. A., Kalekin, O. P., Zhogolev, N. A., Fomin, V. P., & Shitov, V. G., Astron. Rep., 2002, 46(634)
[36] Stull, M. A., et al., AJ, 1975, 80(559)
[37] Tavecchio, F., & Ghisellini, G., MNRAS, 2008, 394(L131)
[38] Tikhonov, A.N., & Arsenin, V.J., Methods for the so- lution of ill-posed problems (Nauka, 1979)
[39] Urry, M. & Padovani, P., PASP, 1995, 107(803) [40] Wurtz, R., Stocke, J. T., & Yee, H. K. C., ApJS, 1996,
103(109)
[41] Yang, J., & Wang, J., PASJ, 2010, 62(4, L23)